
 |
Interview Playback: |
Elliott Waves and Probability
Elliott waves are price cycles. The work by Ralph Nelson Elliott in the 1930s-50s identified a wave structure for the stock market the was heavily based on the fibonacci sequence, although his work most concentrated on the structure and, more specifically, market patterns.
The short of it is that the markets (currencies, stocks, futures, et al) move in a very predictable manner and are not affected to any great degree by events. Markets move based on the collective mood of the “herd” around the world who invest, or trade in them.
Expanding on that thought, you have to keep in mind that the direction of the market on a grand scale is determined by market participants on a worldwide basis. Many a time I wince at the suggestion that the market has had a major reaction to an event in any one country, while it’s rather obvious that the event in question has little significance beyond the borders of that country, or even within that country’s borders.
There are other times when I chuckle as the pundits one day align a market move with a major event, while the next day scramble to explain why the market has completely retraced that move on the following “no-news day.” Events simply have little, if anything, to do with the movement of the market.
On the other hand, what is very clear is that the market moves in identifiable patterns that correspond to specific fibonacci ratio measurements. In my time in the markets (over 20k hours), I have yet to find a wave sequence that did not have a fibonacci relationship with a larger pattern relating to the golden mean (1.618 or .618) or its reciprocal of .382. Fibonacci measurements are critical in determining the lengths of waves, and therefore the next turn in the opposite direction.
Fibonacci ratios run all through the markets. They’re found all through nature, as well. And of course, they originate with the planets in our solar system. The ratio of the distance between the planets in our solar system averages out to 1.618.
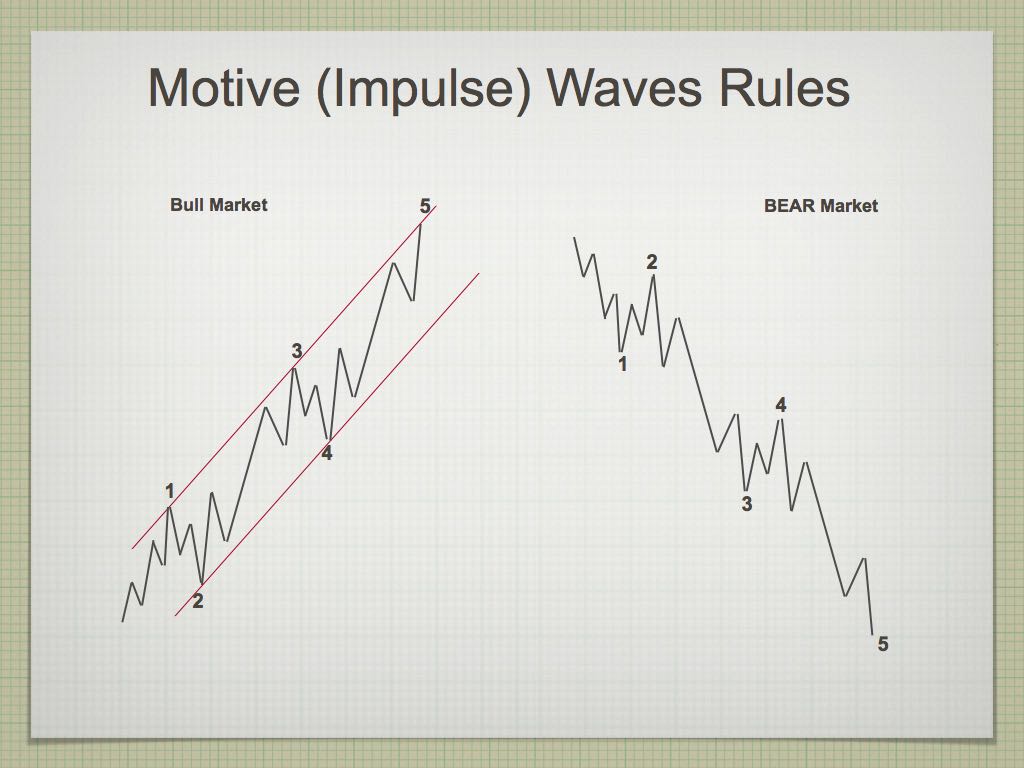 For those who are new to Elliott waves, what Mr. Elliott discovered way back in the ’30s, is that a market trend moves in 5 waves, a countertrend in three waves.
If you look at the chart on the left (click to expand), it shows a wave pattern on the left that’s a bull market trend. You can see that the first wave up moves in 5 “trending” subwaves (not numbered). The second wave then retraces in 3 waves (a countertrend move) 62% of the distance of travel of the first wave.
The third wave follows and it will typically rise 1.618 times (the golden mean) the distance of the first wave. At the top of that third wave, a countertrend wave will develop (a fourth wave) that will retrace 38% of the combined distance of waves 1, 2, and 3. Finally a fifth wave will trace out a length of 1.618 times the length of the original first wave.
Elliott wave impulsive sequences are fractal, and so what happens next is that the market will then retrace 62% of the entire distance of that combined sequence (which now becomes the first wave of a larger impulsive sequence). The wave that retraces 62% now becomes the second wave, and a new larger sequence develops that will rise to a “higher degree,” but with the same fibonacci relationships as that of all the waves within that first wave up. This pattern regenerates again and again until it has developed a full 5 waves as this higher degree.
The key to being able to predict the market is knowing where you are in either a trend or countertrend pattern. Knowing where you are (what pattern you’re in) produces a high probability trade, because these sequences and patterns happen over and over again within the larger market—in fact, throughout all markets. It doesn’t matter if it’s bonds, currencies, futures, commodities or what-have-you. The market moves in the same manner worldwide, every single day of the year.
A motive (impulsive), trending sequence has one basic form. It’s a five wave move and conforms to a specific set of rules that cannot be broken. If any of these rules are broken, the resulting sequence must be re-classified as a corrective (countertrend wave). These corrective waves have far fewer rules and there are many more corrective patterns than there are motive patterns. They are therefore, more difficult to predict. The secret to success is being able to identify a pattern early on, and trade them as the pattern continues to unfold and risk gradually reduces.
It’s the identification of these patterns that’s the key to unlocking the power of the Elliott wave sequence. If you spend the time the learn the system, which requires a knack for pattern recognition, the secrets of the market will morph before your eyes into a very readable map and lead to a very lucrative future.
Elliott wave price cycles work very well with time cycles, although I have found time cycles to be far less accurate and predictive. However, using time cycles to support EW price cycles gives you a much higher ability to predict and time any market. It reduces risk and heightens confidence.
Here’s a very recent interview with Bob Prechter, in which he reiterates his prediction of the trajectory for the not too distant future. Good reading if you’re interested in Elliott wave or the movement of the market.
Until you buy into this concept that the market moves in a very predictable manner based on the mood of the herd, you’ll never have a chance of beating the casino, because you’re playing against it. Period.
Tops in your field DZ 2
Tops in your field …You are tops in your field. Tried to follow Elliot Wave international for years. They were always behind the market. After discovering you, I perceive that you are an expert in reading the waves, which puts you way ahead of the rest of your peers. And you can read the Waves like you are reading tomorrow’s financial section. I pray you stay healthy. —DZ |
Get an upper hand … JC 2
Get an upper hand in trading …Seeing all the different currency pairs and the wave structures and hearing you explain why this has to do that on a nightly bases gives one a upper hand when trading. Elliott Wave applies to all stock and indices and can be applied to any candlestick chart. If someone ask what you want for Christmas – Tell them a membership to Peter’s “Traders Gold!”—JC |
the real deal SM 2
The real deal …‘Educational, insightful and thorough market analysis for all levels of traders. It’s Elliott Wave at its best….Peter Temple is the real deal’ —SM |
Have not had a losing week RW 2
Have not had a losing week …I have been with Peter almost a year. The only thing that matters is have I made money with his service. I think I have finally turned the corner using Peter’s EW. I have not had a losing week in the last 5 months. Thanks Peter, for your amazing amount of hard work. —RW |
Couldn’t be happier … KK 2
Couldn’t be happier …The analysis and insight you provide is simply amazing! I’ve been trading the futures and equity markets for well over thirty years and usually average around 5% monthly. Since joining your Traders Gold Service two months ago, that number has better than doubled. I couldn’t be happier.—KK |
Rise above the rest … SM 2
Rise above the rest …I have only ever met a few people who, in their chosen fields (astrology, medicine, music, martial arts, technical analysis), rise above all the rest and you are one of them…you have ‘the gift’…and that’s why I’m a Trader’s Gold member. —SM |
A true expert in Elliott Wave FL 2
A true expert in Elliott Wave …You are a true expert in EW analysis. What you provide is not available anywhere and is priceless. Subscription on your services is the best thing I have ever done. Many thanks for your effort to make me a better investor. I now have more trust in my investment decisions. I hope you will continue the excellent work! —FL |
The best of them JL 2
The best of them …Last couple of years, I subscribed to several ‘market traders’. You are by far the best of them and the personal contact is awesome. Daily and daily updates are very well written! Besides your expertise in EW, I also like your cycles analysis. Best investment I ever made! —JL |
The Market This Week
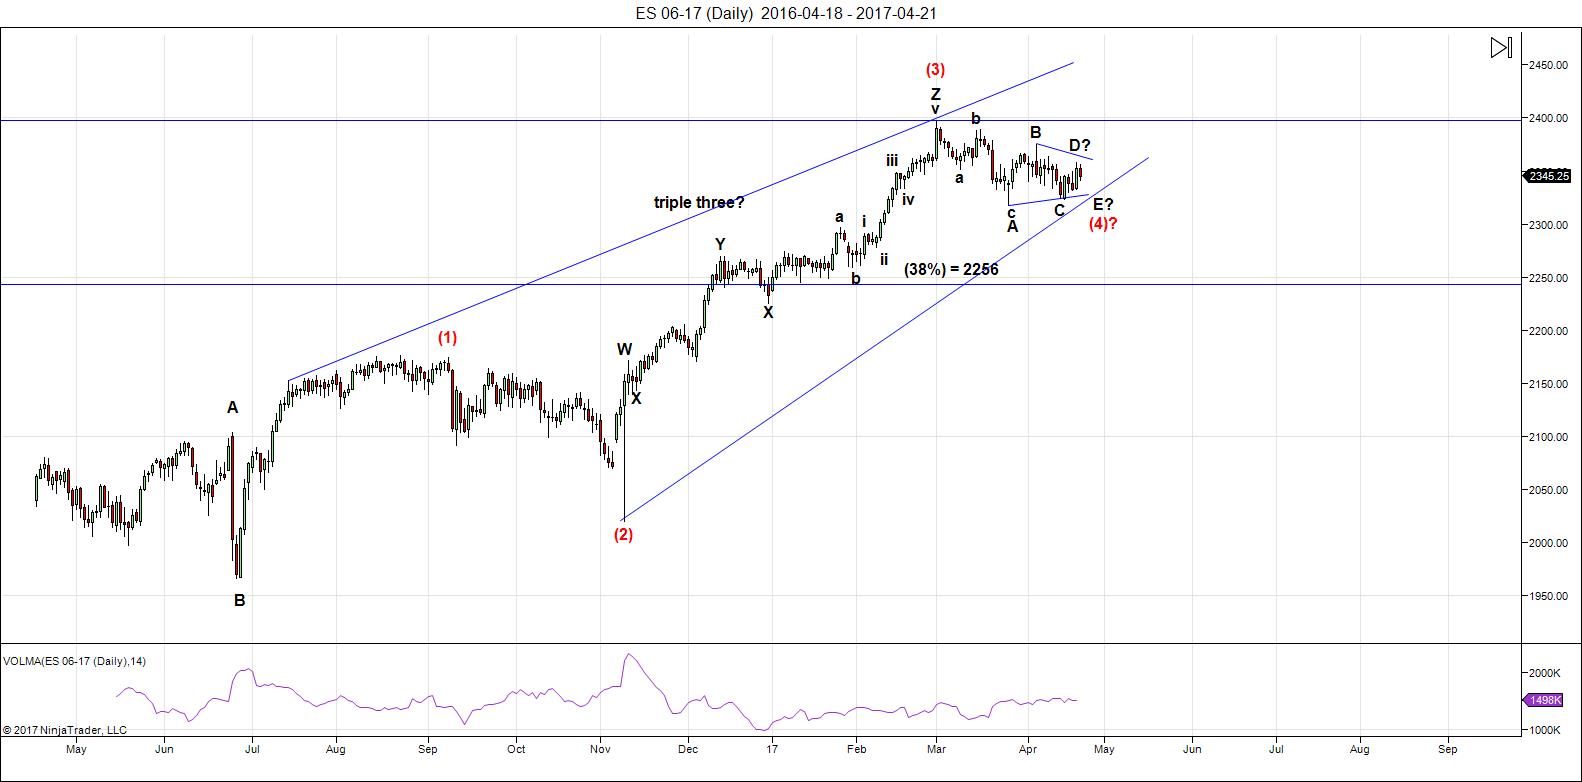
Above is the daily chart of ES (click to enlarge).
We appear to be in the second pattern of an ABC 4th wave correction. The second pattern is almost certainly tracing out a triangle. A triangle is always a final pattern in a combination sequence. If this is the case, I don't expect a wave below the previous low of about 2316.
As I describe above, technically a triangle is not confirmed until the D wave is in place. However, it's been a high probability prediction of mine from rather early on in its formation. An E wave down will follow the D wave.
I predicted the triangle very early on, because of the knowledge of Elliott wave patterns. Once we'd traced out a flat down (the first pattern in this fourth wave), the options (after a subsequent three wave move up) reduced to either a zigzag or a triangle. Once the zigzag option was eliminated, the triangle became the much higher probability pattern.
After completing the current fourth wave, we'll have one more wave to go, which could be an ending diagonal as a fifth wave. The long awaited bear market is getting closer.
_____________________________
Sign up for: The Chart Show
Thursday, April 27 at 2:00 pm EST (US market time)

The Chart Show is a one hour webinar in which Peter Temple provides the Elliott Wave analysis in real time for the US market, gold, silver, oil, major USD currency pairs, and more. You won't find a more accurate or comprehensive market prediction anywhere for this price.
Get caught up on the market from an Elliott Wave perspective. You’ll also get Andy Pancholi cycle turn dates for the balance of the current month. There’ll be a Q&A session during and at the end of the webinar and the possibility (depending on time) of taking requests.
All registrants will receive the video playback of the webinar, so even if you miss it, you’ll be sent the full video replay within about an hour of its conclusion. For more information and to sign up, click here.


Peter,
I believe you need to correct your “link” that is at the end of last week’s commentary. It currently takes you to last week’s commentary rather than this week’s update!
Thanks. You have a very fast reaction time. I actually pasted it wrong in two places and was in the midst of replacing.
Nice summary of EW as it pertains to the current market. Thanks, Peter!
🙂
Had I written that post after the market was open, I would have mentioned that I remained long over the weekend knowing that ES had to reach 2370. I’m now short for the final wave of the triangle.
Great analysis Peter – you’re the only sweet thing about Monday mornings 😉 you and coffee…
rut final broadening top is set. the chart that has been posted ‘forever’ and still standing…..
https://invst.ly/3t61e
Good call Luri congrats..
So now we can make the plunge into May?.
I think we have to respect the momentum of the move out of the triangle so far. The gap up last Thursday and now sky rocketing futures seem a cautionary note. I was interpteting the new DJI low as bearish but the failure of SPX to confirm could mean the opposite. The triangle could be complete.
Tom,
Can you post a new energy chart for this week ?
Thanks in advance?
This weeks energy stream chart
https://s7.postimg.org/57tmkwr5n/April_24_to_28_energy_stream.gif
Thx Tom!! Week looks kinda flat, no fun for us 🙁
I would say it looks bearish
Energy stream not working so well this week.
Today looks real good
if you understand it was inverted
https://s29.postimg.org/xwp4zlq13/April_26_final.gif
Peter, what is your reasoning as to why a 38% retrace will not occur in this 4th wave example? Does it have to do with rules reguarding triangles or zigzags within a wave?
Jeff
Jeff T,
The wave up from Feb 11, 2016 is a zigzag, which is a corrective pattern. Other than having a 5-3-5 configuration, there are really no other rules. https://worldcyclesinstitute.com/forum/elliott-wave-resources/zig-zags/
Peter,
Do you think wave 4 is completed and we are in the final 5th wave?
https://invst.ly/3t8e0
A fourth wave completes when it reaches a new high (in a bull market).
One batch of ES shorts 2368. I have 2 other shorts from 2335, 2337. Every one.Will have to do some challenging trades to get get myself out of this mess. Good luck
Usually market has weakness for 7 calendar days after Mercury inferior conjunction last Thursday, and 21 days after Jupiter opposition (4/3). While lunar seasonals are strong this week, the two planetary combined with budget shutdown looming in 6 days may result in selling into next Tuesday’s Fed meeting.
Peter,
Hi and thanks for all you do for us all.
Above you said the fourth wave completes with a new high….from your es chart above it seems the e wave of 4 would be to the bottom of the triangle. Thus how can it complete at a new high?
Harvey,
A triangle is in 5 waves. The E on the chart completes the fourth wave. Then you have a wave to a new high, which completes the triangle.
There is a question today however, as to whether the triangle is indeed the operating pattern.
That’s is you count the A wave as the entry wave. Either way a triangle enters from one end and exits from the other. In the case of ES, the new high would be above 2400. That would mark the end of the larger wave 4.
Valley
The venus bull market i touched on a few weeks ago dovetails with mercury .
i would watch the inferior and superior conjunctions with mercury
until December and watch for repeat patterns .
on a last note in regards to mercury , the 10 day lag from mercury starting its
retrograde motion was the low on april 19th . adding 10 days to mercury
ending its retro grade motion targets may 13th as a high .
my may 11-13th date i m keeping as a high
Peter
If the SPX cash touches 2385 would it change your Triangle pattern
in the larger picture ?
Also , in the ES , today’s high is just slightly above the high of 2375
on april 5th . i think your correct on the triangle overall yet
today’s market action appears to be changing the details of
this triangles swing points .
Note an elliott wave observation yet time wise im starting to see
Wednesday as a potential turn
march 1 to march 27th was 18 trade days down .
march 27th to wednesday will be 21 trade days up .
march 27th to april 5th was 7 trade days
april 5th to april 17th was 7 trade days
april 17 to wednesday will be another 7 trade days .
another odd ball .
march 16 high plus 14 trade days ( double the 7 trade days )
april 5th high plus 14 trade days
wednesday march 26th .
2380 on the ES on wednesday looks like a magnet .
after that i don’t know how to call this wave .
if this is a simple A B C decline from march 1st though
if say Wave A = 18 trade days
“IF” wednesday is the high of wave B ? then adding
18 trade days to wednesday april 26th would
target may 19th as the end of this wave .
i m not going to rule out Dow 20054-19748 just yet
despite my bullish bias .
I appreciate the time you spend on your updates
Joe
Rather than a symmetrical triangle, it could be developing as a barrier triangle.
Another possible structure could be a double zig zag perhaps, with the C wave yet to come? This market is certainly full of surprises, thanks to all the relentless bankster machinations. NDX composite putting in a nice doji above the upper B band today along with a new all time high.
Peter
i read your notes after i had posted ,
i see we are on the same page ( in general anyways )
thanks
joe
We might be morphing into a flat.
🙂
Peter, as in back to 2402 then back to 2320s? Big ABC flat?
here is a new thought
I am looking to take a short position on Tuesdays close or
the overnight session Tuesday night or early Wednesdays
market session . Im working on the details of the potential leg down.
at the moment im thinking we will see another A B C decline which
will define wether or not this is a triangle .
Wave A of this decline should bottom near may 2-3
wave B would be may 11-13th ? wave C may 18-19th.
My may 13th date im favoring as a high yet im not completely sold
on it . This is now becoming interesting to me and i think if this is
a larger bearish pattern then the risk reward for a bearish trade
should set itself up either late tomorrow or early wednesday .
a failure to break down Thursday and Friday would bother me
yet the set up is appearing .
not financial advice just my thinking
good luck everyone
joe
On the one hand, if we have triangle, downside is limited to the low of the C wave around 2328, on the other it looks like exhaustion gaps in both RUT and NDX comp, the latter being a new ATH. Either the markets are going to diverge considerably or there is greater bearish potential all around.
Peter
You answered my question ahead of my posts twice
in the same day 🙂
I am in agreement on that flat
we should see soon enough
thank you
Joe
What is a “flat”?
Valley,
What a flat looks like: http://thepatternsite.com/EWFlat.html
Thanks, Peter!
Well, it’s probably not the best example. But in this case, it’s a wave down in 3, a wave up in 3 and then a big wave down in 5 waves. We had that pattern from the top of the third wave. This might be the same thing again.
Thanks, Peter!
odd news event coming up
Trump or trumps team to talk about tax reform
on wednesday .
SPY 238.32 is an unfilled gap.
We have both a B. Gartley and an AB=CD that end there, to the tick.
I was looking at that target last week, asking myself “How can we get there with no buying whatsoever”. Well now I have my answer…the magic of moving the market on 0 volume when it’s closed lol…I wouldn’t be surprised if we need another gap up tomorrow…the old trick – gap it up and get dumb$ hold the bag didn’t work…
Peter, on another note, I’m sure you noticed that the former Rothschild’s wiz-kid is winning the France elections as an anti-establishment candidate LMAO.
Sometimes I think we fully deserve what’s coming…
Alex,
haha… yeah, I noticed, but it’s early yet …
He is a marketing specialist so his remaking himself is certainly understandable. What is peculiar is the gullibility of the French ( or ignorance) to buy what he is selling. If Le Pen has any competent strategists on her team they should have no trouble exposing him for the fraud that he is. But then again, there is no accounting for the stupidity of the voting public. I guess they need more blood flowing in the Champs Elysees…so sad!
BTW, this subterfuge worked splendidly with Alexis Tsipras in Greece and those poor folk still have not figured out how and why they got royally shafted….
Ahah…so true Verne. You know what they say? “If voting made any difference, they wouldn’t let us do it” Mark Twain 🙂
Andre’,
You were exactly right on 4/24…and maybe higher highs tomorrow! You said last week that 4/27 and 4/28 were dark days and that every month had dark days…and you considered all dark days as down days.
That takes us into the weekend…and you are looking for a 5/3 low. Does that perhaps mean 3 or 4 down days bunched together. Say…4/27, 4/28, 5/1, 5/2 and then the 5/3 low? Not looking for investment or trading advice. Just really captivated by your work.
Ed,
I have said 4/24 and 4/25 were dark days; 27/28 days in lunar month.
Andre’,
Thanks for straightening me out! I read it again…and you were saying that 27 and 28 days were dark days when discussing what Carolan says about October’s. I read it as 4/27 and 4/28 were dark days. I added in the “4/?” and totally misinterpreted what you were saying. Thank you for clarifying!
ok y’all – i am being as ‘sincere’ as is possible for ‘the luri’……… we are now offically in the ‘time’ zone of the END…….. https://invst.ly/3thrv see the shaded oval area of the ever posted final broadening top for the RUT….
i know everyone has their own count…… well my count says “BE WARNED”. i predict we are in the time zone for an “event” to occur that RIP the markets away from their handlers…….absolutely be careful and aware……..who knows what this event could be???….. It could be the night that OPRAH eats a case of “BUSH’s” tinned baked beans – and she has the misfortune of timing as to light a ‘scented’ candle just as said case of beans were working its way through her digestive system…….the resulting EMP pulse – could be mistaken as a N. Korean attack on the USA………… in other words – it could be anything…….BE WARNED! https://invst.ly/3thym
lol! luri; The ultimate false fart…er…I mead flag! 🙂
2 gap ups.. That is an island top reversal pattern.
I still think we have seen minute W1 down and we are wrapping up a minute W2 in a larger intermediate W1 down that will target SPX 1750-1775 area by mid Oct 2017
3-1-17 2400 was the top. imho
My reasons.
Fib 8 yrs almost to the day from the 2009 pivot
W5 equals a quality in length with W1 off the 2009 pivot
2400 nice round number.
And most everyone is expecting us to go higher.
One poster said it best when I asked and your bullish why? Most will refuse to admit at first when they get it wrong, they will hold on until SPX 1799 or so then sell when the pain gets to be too much to bare, and then will not believe the W2 snap back into the end of the year.
But not this group!
Well maybe 1 or 2 of you 🙂 haha!! jkjk
jody, for what it is worth….here is a “best count” effort of the final C wave of v of the RUT final broadening top. https://invst.ly/3tigf
We’re just filling a SPY gap 🙂 see above (Gartley and AB=CD end right at gap fill). Today should turn around 238.25.
alex, possible rotation of $$ into small caps – maybe new high in small caps – sets up divergences between indexes, where spx and dow fail to make new high, and rut/ndx make new high…. https://invst.ly/3tivc
SPY gap fill is right here. If we go above it, please Iuri give a kiss to your kids and follow me in the bunker, bring wine (vodka is ok too).
alex,
do you like ‘rum’ alex – i am loaded down with rum…….barrels of colombian rum!!! “splice the main brace alex……”””
should i be nervous here?? YIKES!!! ahhhhhhhh……….!!! [cough] https://invst.ly/3tjc3
Funny you should say that. I was telling a few other traders I know that the current move up has all the earmarks of a manic second wave. It is not unusual for sentiment at the end of these second waves (if that is what it is) to exceed that seen at the actual top. While we do not yet have a new low in VIX, we do have one in UVXY, and are close to a new high in SVXY.
Meanwhile NDX is cavorting in rarefied air above its upper BB, more than 3 standard deviations from its monthly mean. Strange that anyone would expect this kind of lunacy to continue indefinitely….strange indeed!!
I don’t like rum but I’ll like the effect, I’m not particularly selective and I drink like there’s no tomorrow – BE WARNED! today should be a turn date and hurst cycles are pointing down all May (basically the 80 week top should be already in, the first week of may we have a bunch of lower cycles pointing down, that should give the final momentum push).
Peter are you sure this isn’t already some sort of Wave V? I mean…it seems like it’s going in that direction bigly 🙂
update
https://invst.ly/3tjnt
The problem with looking for any kind of important top here is the cumulative advance-decline line of the NYSE. It registered a new all-time high yesterday and is doing so so far again today. I would challenge you to show me a market top in the popular averages any time over the past 90-100 years that occurred at a concurrent new all-time high in the a-d line. We need to see a divergent high with Indexes making new highs unconfirmed by the a-d line…
concur…on April 22 & 24 emailed several associates (to include readers/posters here) that “NYAD continues to power on”…
There are all kind of metrics in these markets that no longer have any real probative value. One that quickly comes to mind is volume. Conventional wisdom would have considered it highly unlikely for these prices to be sustained in the face of the years’ long declining volume profile, yet here we are. In addition, the kind of top we are putting in is one no one has seen in centuries, in fact ever. Try as you might, you could simply not find a comparable referent. I have always wondered whether normally bullish metrics would similarly prove unreliable at a top of this magnitude. We won’t know until we know…! 🙂
This is true. The entire wave up from 2009 is corrective and continues so. To my knowledge, we’ve never had a corrective top; it’s always been motive. So it makes analysis more difficult because there are fewer EW rules (well, for EW people … lol). But we’re still following what rules there are and honoring fibonacci ratios.
Peter, this is why I come here , for your different points of view. But I must admit that I am baffled by you calling the wave from 2009 a corrective wave. By definition a corrective wave has to correct against a previous wave without surpassing the origin of that wave. Once your corrective wave from 2009 low passed the high of SPX 1576 which is the origin of the previous wave, by definition it can no longer be called a corrective wave. The price area above 1576 can not be corrected since there was never any price there. It is impossible to correct what never existed. How can we be in a correction and make new highs of this magnitude? Maybe I am missing something?
Ken,
If you don’t like the word, “corrective,” then let’s call it a “countertrend wave.” 🙂
A corrective wave (Prechter/Elliott) is a wave that travels against the trend of one higher degree, and is in three waves. It can be as short or as long as it likes (within EW rules), as far as I know. I’ve never read your definition in Elliott’s or Prechter’s work, but if you can tell me where you found it, I’d be more than interested in looking at it.
I’m talking about the structure of the wave. Elliott didn’t have other terms for a wave in a corrective structure. The wave up is clearly not motive; it’s a zigzag, a large one, but a zigzag nonetheless. We’re in a smaller degree zigzag now.
Hence my comment that we’ve never seen this before. I would attribute it to debt pushing the market higher rather than human exuberance. But the wave up is certainly not motive, or impulsive, in structure.
Thanks Peter, call me old fashioned but if we are 900 points above the previous all time high, it is hard for me to think of this wave off the 2009 lows as corrective or countertrend simply because there was “no trend” ( or price) above the October 2007 high of SPX 1576 until this wave blew right by it. Maybe I have a bad case of cranial rectumitus.
haha … well those are words in the context of Elliott wave that describe wave structure rather than the traditional meanings, in my experience, anyway.
Peter
might this be the X wave of a further developing triangle ??
today the spx overlapped the B wave from march 15th .
your note yesterday about the previous and a 5 wave structure
coming next i can agree with also .
To sum it up we have A B C , then today being X ?
the B wave low on april 13th and 19th ( spx vs dow )
im still thinking of taking a bearish stance late today or early tomorrow .
Bottom line : the triangle is not ruled out and nor is the possible flat .
Joe
my plan
im looking to take a position in the next 24 hours.
my risk will be limited to the previous all time highs
if this market fails to break down Thursday and Friday
i will abandon my bearish stance and wait until June 30th.
The problem i see with the timing , first off i was wrong about
the april 19-21 high ( april 19th was a low and april 20-21 was
an acceleration up ) the may 2nd date is calculated as a low .
back step for a second , the 10 lag of mercury retrograde
considers the april 19th low and adding 10 days to the
mercury retrograde end date labels may 13th a high .
we are basically in a crash phase with the market crashing up !
mars Uranus cycle has a may 2 low and a may 11th high .
combining the 2 i have have may 11-13th as a high .
the next cycle is may 18th-19th as a low and then June 30th as a high .
The 10 day trin gave the buy signal to this present rise .
the reason for my up coming bearish trade is based on the 7 trade day
market swings .
cash dow :
march 16th swing high
plus 7 trade days
march 27th swing low ( start of venus bull market cycle ) important low
plus 7 trade days
april 5th high
plus 7 trade days
april 17th ( this is where the divergences began dow vs spx .
progression on spx
march 8 closing low
plus 13 trade days
march 27th print low
april 13th print low as close low .
the next 7 trade day cycle on the dow is tomorrow april 26th
yet on the spx we would be looking at may 3rd .
the 2 index’s don’t match up time wise.
in an attempt to match up price between spx and dow .
i take the low march 27th on spx to the high on april 5th spx
and add that price movement to the april 19th <– low on the spx
in doing that i have a target of 2391.16 .
the .886 on the spx is 2392
now looking at the cash dow .
using the .886 retrace i see 21082 . not sure we get there yet
that is the levels ill watch closely if they are seen .
id say one of these levels get touched yet im doubting both .
all for now
Joe
same dates
Joe,
Tomorrow is a bradley turn (geo+helio) and mercury latitude (wich I thought would be a low) .
Goodluck.
$nya should be watched since it has failed to poke above
its respective march 16 th high .
ill add that the late jerry favors always said the $nya was best for timing purposes
Market gaps are generally seen at the end, and at the start of bullish legs. Considering the sideways movement of the last several weeks, we really could not consider this current move as the end of a bullish run. As improbably as it seems, at least to me personally, price action is what it is. We could of course always see price behave differently form previous occasions but while I was certain the gap back on May one was an exhaustion gap, that interpretation has been firmly negated by today’s price action. We should expect new highs.
no more posting until the weekend for me .
im looking at several comparisons and will
decide later.
the best cycle window i still see as may 18-th low and june 30th high .
next week is my key week even though im looking to be bearish
in the next day ( it may not work though and if not next week
will be the key )
20904 pivot for the weekly chart on cash dow
last post
look at weekly chart of cash dow in 1987
ive made my case for the may 11-13th date
look at the week of may 11 1987
also week of may 19th
odd that my timing model is lined up
all for now
weekly chart of 1929
week of
feb 25 high
march 25 low
april 29th and may 6th high
may 27th low
yet 1987
has week of may 18th low
my timing says may 18th-19 low
sorry peter taking notes before my trade
lol … your brother posted here a while ago … “no more posting until the weekend for me.” I guess the two of you don’t talk much. 🙂
Just can’t get enough ….
If this turns out to be a flat
then next week must be down
there is a chance of a slight swing high above this week .
so as i noted before im looking to take a bearish stance
yet i need to see Thursday and Friday as down .
the bigger picture is next week as a down week
its the rhyme since comparison charts are rarely exact.
Blue is the year 2016 to date .
http://imgur.com/qx9tsvw
Sorry peter
May 11th-13th is my focus for a hard down
im finished 🙂
doing homework .
now back to building my file cabinet .
Joe
Sorry? Not a chance … you love it! Thanks for posting. No disrespect meant. Just thought it was funny … 🙂
We may go up until every bear is dead: http://www.zerohedge.com/news/2017-04-25/here-we-go-again-another-fund-caught-short-gamma-trap
http://mobile.reuters.com/article/idUSL8N1B7383
Has anyone wondered what if the persistent extremes in markets we are seeing persist for so long could be evidence that we no longer have a normal market driven by normal human sentiment, which clearly ebbs and flows to produce the wave forms of EW theory. How does sentiment ebb and flow when you have market participants with very deep pockets, determined to employ every scheme and subterfuge to keep the market elevated?! This is beyond nuts! 🙂
LOL! 🙂
Or running off screaming into the forest with fur on fire!
I remember when hedge funds were supposed to be smart money 😀
The most recent chart of money flows that I saw was all retail investors. First the institutions headed for the exits, then the hedge funds, followed closely by the insiders, all unloading hundreds of billions to the latest eager beavers!
Hmmnnnn…!
Peter
i figured you were joking
i get carried away before my trades and well
i was in my moment double checking things
there are 4 hourly time lines that run
from 1230 ( 1/2 hour before the close )
to 0830 tomorrow ( 2 hours after the open )
that is a lot of timelines compressed into a relatively
short time span .
My focus will be the open tomorrow and as for price
sticking with spx 2392 and dow 21079-21082
spx is very close right now ,
tomorrow early morning market session
ill take the trade .
thats it for reals 🙂
Peter,
Are you still short from 2370, you still think we retrace back 2316 to complete e wave within triangle or the triangle has resolved to upside.
No, I got out when we approached a new high and the structure was obviously supporting a new high. I’m watching.
Everyone and their mother is short: https://charts.stocktwits.com/production/original_81150475.png?1493157844
This probably explains a lot…
That graphic is probably somebody’s idea of a very funny joke.
Think about it folk. There is no way VIX, which is the SPY put/call ratio would have been trading at the historic low levels we have been seeing if that graphic were true. I am surprised that any one would publish it. There is a lot of mis-direction and propaganda floating around out there about market sentiment. I think it is also true that a lot of this pop we have been seeing is due to short covering in the indices. (which is not necessarily reflected by VIX). The reason I think so is because of the pathetic volume accompanying the moves up. Triangles occur in next to final wave positions and I think this move up may not have very far to go. Just my two cents.
I just noticed that it was only for one strike price of 236 so that was definitely an out-lier considering where VIX was trading…
“Throwing In The Towel” – US Stock Market Shorts Hit 10-Year Low
http://www.zerohedge.com/news/2017-04-25/throwing-towel-us-stock-market-shorts-hit-10-year-low
Peter
This movie is coming out in July
And to think I’m expecting a wicked cold winter
This next year .
I consider this another move against trump
And unbelievable how the lies don’t stop
https://m.youtube.com/watch?v=huX1bmfdkyA&feature=youtu.be
John,
Yesterday at 10:23am you stated to Joe that “Tomorrow is a Bradley turn(geo+helio) and mercurylatitude…” I Googled Bradley Turn Dates and could not find “April 26th” listed. However, did find “April 29th”!
Can you verify April 26th? 3 days difference. Just being thorough and double checking! Thanks!
Ed,
Take a look here:
http://time-price-research-astrofin.blogspot.nl/search/label/Bradley%20Index
A lot of times a low is a high and a high a low,just watch the turns..
Good luck.
Thank You! You are correct!
update on rut futures overnight – the final leg! ……you know what i am going to do next, don’t you – BE WARNED! https://invst.ly/3trow
daily view https://invst.ly/3trre
perspective view https://invst.ly/3trsr
Does anyone know if expanding diagonals retrace the same as contracting ones?
Warned about what Iuri? Did I miss something?… 😕
alex,
buddy – “”BE WARNED” is my signature statement!!….it is pure “LURI”…. although, for me, the end of this final broadening top formation of the RUT, which is a fractal of the intermediate, which in turn is a fractal of the long term going back to 2000 signifies “THE END” for the market as we know it…finish – kaput!! so, for me, we are within “days” of this ending!! my spidey senses are going “JACK DANIELS”/ “JOSE CUERVOS”/ “CAPTAIN MORGAN” crazy right now…….RUN FOR YOUR LIVES…..ahhhhhh [BE WARNED!}… :-))
I was messing with you. Did I succeed 😛 ?
https://invst.ly/3tubb
alex check it out……what do you think the chances are that ‘on the short term RUT chart’, that the 5th wave chops up in an ending diagonal??
thoughts?
Friday will be a high, 5/1 low. Then up into 5/5 for a very signifcant high (with a low 5/4). After that down into 5/18.
This changes my outlook.
Carolan’s spring low gives 5/18.
streams support some of your dates
https://s27.postimg.org/qtyq62kjn/april_26_to_May_22_energy_stream.gif
spx and es and cash dow satisfied their respective overlaps yesterday
the dow futures satisfied its overlap this morning .
the last hold out is now the NYA .
Andre
we are becoming more in sinc .
we agree on the spring low date , your may 18th and i have may 18-19th
may 11-13th though is the swing high yet i am not sure if it becomes
a lower swing high .
im still looking to be short this morning and im now using the nya
as my trigger ( which may not work yet giving it until 2 hours after the open
to prove or disprove itself )
Joe
Andre’,
Just curious….Does the “Flash Crash” on May 10, 2010 “tie in” to any dates on your work?
Should be May 6th…
Ed,
It certainly does. My system gives 5/5 and 5/8; so anything in between is confirmed. And then down into 18.
If Le Penn wins the run off election on the 7th in France you will get your big drop on Monday! I’m betting she will win!
Does MS still think S&P will not pass 2405? I think that prediction will not come true.
sox index about to give up all of yesterdays rally
NYA came within 5 pts its march 16 high yet failed to poke above it
sell stop ( to go short) dow mini futures at 20939 is we see a sell off
or ill take a short position at higher levels if the nya pokes above its march 16th
high .
here goes nothing lol
sell stop at 20965 dow mini
ill move it up possibly yet need to see
the advance decline line weaken
buy stop 20975
advance decline line still rising
final wave 3 of 5 of C for looks to be potentially over now. hit the top of the channel with slight overthrow, and pegged the 361.8% extension of wave 1 perfectly…we shall see..
https://invst.ly/3tvli
its either a B wave or its not .
using Cash spx as stop yet dow has more room
its possible that spx hits a hew high .
ill keep my note to myself till the end of the day
lol 🙂
short again down mini at 21000
This website is for educational purposes relating to Elliott Wave, natural cycles, and the Quantum Revolution (Great Awakening). I welcome questions or comments about any of these subjects. Due to a heavy schedule, I may not have the time to answer questions that relate to my area of expertise.
I reserve the right to remove any comment that is deemed negative, is unhelpful, or off-topic. Such comments may be removed.
Want to comment? You need to be logged in to comment. You can register here.