
If you know anything about Elliott waves, it’s probably that there are two types of waves: “motive” and “corrective.” Motive waves are in 5 waves (trending waves) and corrective waves are in three waves (moving counter to the trend, or “countertrend”). Motive waves advance the trend through having a larger number of waves than corrective waves. Within those five waves are two “corrective waves” (waves 2 and 4). These two subwaves have three subwaves themselves.
The term “motive waves” is a “catch-all” for waves with five subwaves, and include diagonals. Ending diagonals can be found in both corrective waves and motive waves (ending diagonals only appear in the fifth and final wave in either). However, diagonal waves contain five waves that overlap (they could really be considered as corrective waves, even though they’re included within the motive wave definition).
On the left (click to expand) is a diagram of an “impulsive” wave. Impulsive waves are motive waves (contain 5 subwaves) that do not overlap. They must adhere to the following rules:
- Wave 4 cannot enter the price area of wave 1 (they do not overlap)
- Waves 1, 3, and 5 must contain 5 impulsive subwaves themselves.
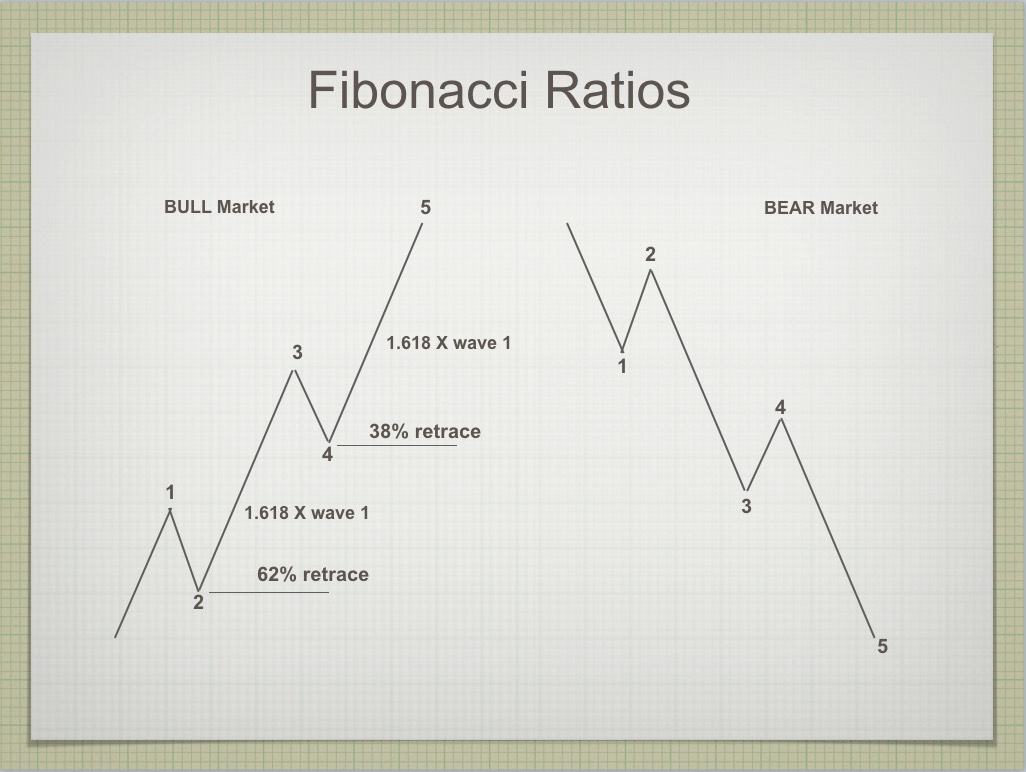
Let me add that the second wave of an impulsive sequence must retrace 62% of the first wave. Wave 4 must retrace 38% of the length of the first three waves combined. (These two rules are not found in The Elliott Wave Principle, by Prechter and Frost, but are based upon my extensive time spent in observing Elliott wave structure in the market itself).
If you’re been with me for any length of time, you might remember waiting for a large turndown by all the major indices, but having to wait for the NYSE index to retrace exactly 62% in a second wave before all the other indices could complete their turn.
In terms of wavelengths of impulsive waves go, wave 3 is almost always 1.618 or 2.618 times the length of the first wave (we call the latter measurement an extension). Wave 5 is almost always 1.1618 times the length of the first wave. Wave 5 can also extend on occasion.
Summary: So the word “impulsive” and “motive” are often interchangeable, other than the fact that “motive” can include an ending diagonal, because even though the structure of an ending diagonal appears corrective, it is often found at the end of an otherwise motive sequence. Odd, but true.
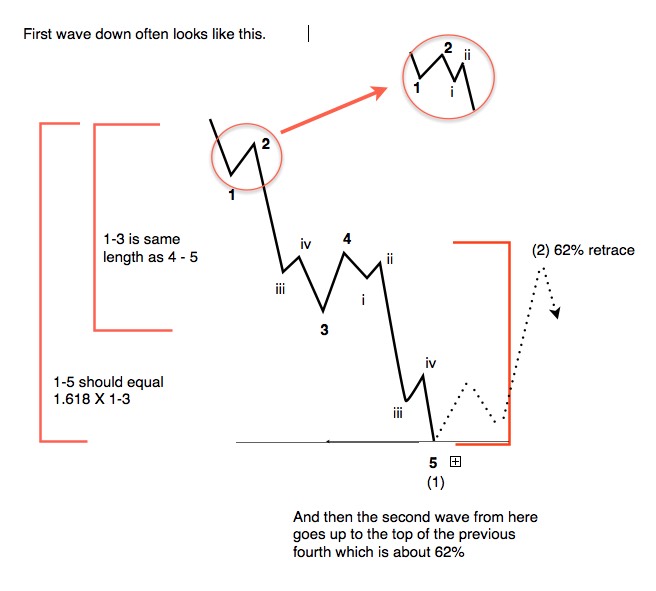 There is one exception to the structure of an impulsive sequence. This is found in a first wave (diagram on the left). Wave 1 of a motive sequence often has a slightly different structure, where there is a large fourth wave that retraces 38% to “test” the previous 4th wave of one lesser degree and leads to a large fifth wave that will trace out the same length again as the length of the first three waves combined.
If wave sequences break the above rules, they’re not impulsive waves, but corrective. Corrective waves have their own rules and structures, but we’ll save that for another article. In fact, corrective waves can themselves be made up of waves that have 5 subwaves within them, but these waves are not impulsive and do not conform to the rules of an impulsive wave. This is a subtle difference that has been made very confusing to most because it is never explained in The Elliott Wave Principle book.
The Right Look
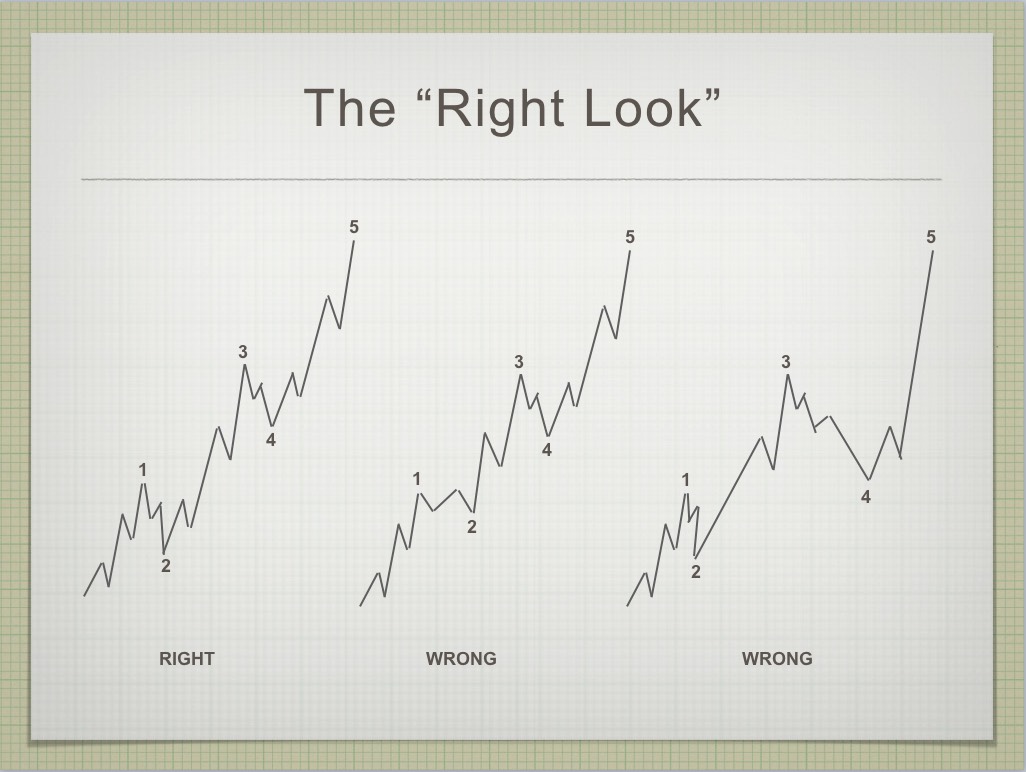
But, let’s get back to those impulsive waves. While waves that do look at first glance like an impulsive wave often are not. This is where the “right look” comes in. As you get familiar with these trending waves, being able to discern the difference is the key to being successful in trading (and analysis).
Left-most in the adjacent diagram is a bullish, impulsive wave with the correct structure and “look.” You can see the five subwaves within each of the motive waves and the three subwaves within each of the correct waves (waves 2 and 4).
The “wrong view” in the center of the diagram shows a second wave that does not retrace 62%, but otherwise the wave look impulsive. However, this discrepancy makes it a corrective wave and it’s likely to trace out another wave at the tail end or end in a double top.
The “wrong view” on the right shows a wave with a very large fourth subwave. The “right look” again is key to proper analysis. If wave 2 or wave 4 is out of proportion to the other elements of the wave structure, then the wave is likely corrective. I would refer this wave as a “3,” because when you squint your eyes, all you really see is 3 waves. Waves 1, 2 and 3 together would count as the A wave, wave 4 and the B wave, and wave 5 as the C wave. You have an ABC 3 wave sequence and it should completely retrace.
Application of Motive Wave Rules to the Chart of ES
You can apply the principle above to the daily chart of ES (to waves 1 – 4) and you’ll see that it doesn’t fit the criteria for an impulsive set of waves. Therefore, it is corrective. The waves form a zigzag. A zigzag is comprised of an A wave in 5 waves (not an impulsive one), a following B wave in 3 waves, and a C wave in 5 waves. The A wave is not shown on the ES chart below (the very top of it is), but the B and C waves are visible. We’re in the fourth wave of the C wave, with only the fifth wave to complete.
In the daily chart below, we actually have to complete the fourth wave first, but the after that, the final fifth wave will be “up a bat.” The fifth wave will be the final wave of the entire bullish, corrective sequence.
A Note About the Coming Top of the Market
A major wave sequence must start and end in a motive wave sequence (in other words, in five waves). Until you see a five wave sequence down, we will not have seen the top of the market.
Have not had a losing week RW 2
Have not had a losing week …I have been with Peter almost a year. The only thing that matters is have I made money with his service. I think I have finally turned the corner using Peter’s EW. I have not had a losing week in the last 5 months. Thanks Peter, for your amazing amount of hard work. —RW |
Rise above the rest … SM 2
Rise above the rest …I have only ever met a few people who, in their chosen fields (astrology, medicine, music, martial arts, technical analysis), rise above all the rest and you are one of them…you have ‘the gift’…and that’s why I’m a Trader’s Gold member. —SM |
Get an upper hand … JC 2
Get an upper hand in trading …Seeing all the different currency pairs and the wave structures and hearing you explain why this has to do that on a nightly bases gives one a upper hand when trading. Elliott Wave applies to all stock and indices and can be applied to any candlestick chart. If someone ask what you want for Christmas – Tell them a membership to Peter’s “Traders Gold!”—JC |
Tops in your field DZ 2
Tops in your field …You are tops in your field. Tried to follow Elliot Wave international for years. They were always behind the market. After discovering you, I perceive that you are an expert in reading the waves, which puts you way ahead of the rest of your peers. And you can read the Waves like you are reading tomorrow’s financial section. I pray you stay healthy. —DZ |
The best of them JL 2
The best of them …Last couple of years, I subscribed to several ‘market traders’. You are by far the best of them and the personal contact is awesome. Daily and daily updates are very well written! Besides your expertise in EW, I also like your cycles analysis. Best investment I ever made! —JL |
A true expert in Elliott Wave FL 2
A true expert in Elliott Wave …You are a true expert in EW analysis. What you provide is not available anywhere and is priceless. Subscription on your services is the best thing I have ever done. Many thanks for your effort to make me a better investor. I now have more trust in my investment decisions. I hope you will continue the excellent work! —FL |
the real deal SM 2
The real deal …‘Educational, insightful and thorough market analysis for all levels of traders. It’s Elliott Wave at its best….Peter Temple is the real deal’ —SM |
Couldn’t be happier … KK 2
Couldn’t be happier …The analysis and insight you provide is simply amazing! I’ve been trading the futures and equity markets for well over thirty years and usually average around 5% monthly. Since joining your Traders Gold Service two months ago, that number has better than doubled. I couldn’t be happier.—KK |
The Market This Week
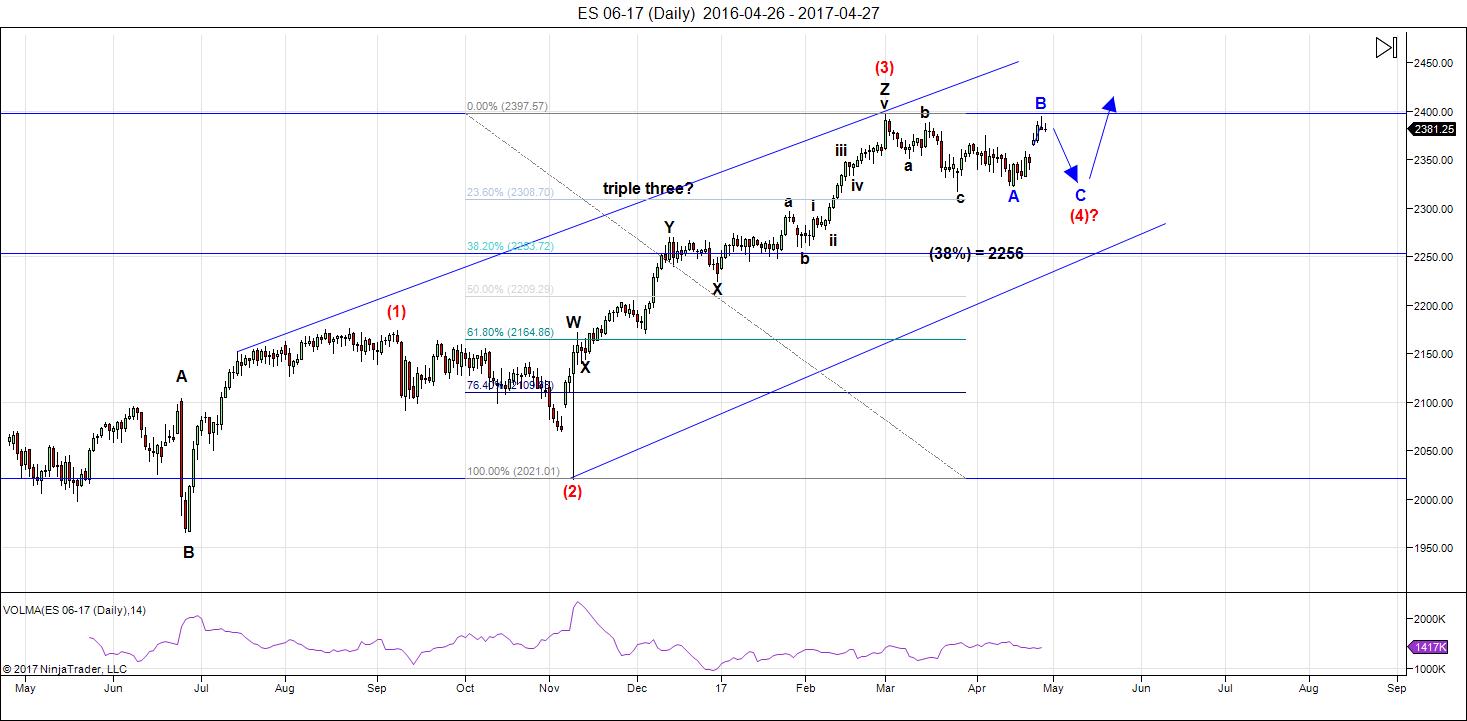
Above is the daily chart of ES (click to enlarge, as with any of my charts). Last week, as soon as I posted a daily chart of ES (on Sunday), the market opened and morphed from triangle to a flat.
We appear to be at the top of a flat. Flats are 3-3-5 configurations. We may take a day to complete this turn, as NQ is finishing a third wave up, but once we do turn, we should head down in 5 waves.
Let's look why a new high is out of the question, imho.
- This fourth wave cannot be the fourth of the third wave, because we don't have a second of the third, and that does not fit any kind of known EW structure. So that leaves us in the larger fourth wave, which is how the chart is labelled.
- If this larger fourth wave was to top, we'd have an ABC wave up, which cannot be an ending wave. In fact, the structure it would leave below it wouldn't make any sense, unless this is the first wave up of an ending diagonal (the first leg of the fifth wave). However, currencies still have a long way up to go, and in fact several of them haven't turned into their final waves yet.
- The only pattern that makes any sense is a final flat of the fourth wave and the most sense going forward would be a new low (as the fourth wave is very shallow for a major fourth wave). We still need to allow, though, for the possibility of a running flat (and C wave that does not seek a new low).
That said (as I explain above), we have two flavours of flat that could materialize. As a result, I don't have a clear target for a bottom. A running flat is very rare, but this is a rather bullish market, so I consider it a possibility A running flat will not drop to a new fourth wave low. An expanding flat, on the other hand, will drop to a new low. This is the higher probability, imho.
After completing the larger fourth wave, we'll have one more wave to go, which could be an ending diagonal as a fifth wave. The long awaited bear market is getting closer.
_____________________________
Sign up for: The Chart Show
Thursday, May 4 at 2:00 pm EST (US market time)

The Chart Show is a one hour webinar in which Peter Temple provides the Elliott Wave analysis in real time for the US market, gold, silver, oil, major USD currency pairs, and more. You won't find a more accurate or comprehensive market prediction anywhere for this price.
Get caught up on the market from an Elliott Wave perspective. You’ll also get Andy Pancholi cycle turn dates for the balance of the current month. There’ll be a Q&A session during and at the end of the webinar and the possibility (depending on time) of taking requests.
All registrants will receive the video playback of the webinar, so even if you miss it, you’ll be sent the full video replay within about an hour of its conclusion. For more information and to sign up, click here.


Thanks Peter……Nick
Peter thanks for educational post
Thanks, Peter!
Much appreciated.
Thanks for the “thanks,” all. I’m trying to kill two birds with one stone by posting info that’s going into my course.
🙂
“Overestimate the effects of technological change in one year, vastly underestimate the effects in ten years”. Silicon Valley Truism.
My hunch is that next year or two will be a choppy upward directed stock market at upper end of historical price earnings. However, within a decade an ubiquitous roll out of labor saving technology will transform all aspects of service and manufacturing economy resulting in steady improvement in corporate earnings and resulting market valuation increases. Dow 100,000, year 2029.
Valley,
I have followed you from john hamspons days..he was one of the best logical thought out bear from 2015 and doesn’t blog anymore. so many bears are dead. it so compelling to belief we will enter bear market only thing that makes me incline little differently is the though how would we meet the liabilities we will have different social schemes/pension/soc security/other benefits..only explanation is your theory.
Bill
The bears have all certainly gone extinct, and no wonder. We no longer have a market. Better than 60% of market volume is machines trading with each other. The banks and hedge funds have all figured out that machines are all programmed to buy futures when VIX and the YEN declines so they relentlessly short both. When the music stops, probably due to some exogenous shock, I suspect we are going to get more than the long thwarted correction.
Thanks, Bill. I am agnostic about short to medium term market performance. However, long term inflation guarantees each generations innovates and works hard/harder than previous generation.
Hi Valley,
In my book I mention the Dow topping at 100,000 in the year 2034/5, the end of my next 17.6 year bull cycle.
ATB,
Kerry
Sounds likely, hello Kerry!
Great insight on the count Peter. Quite a few analysts are seeing an incomplete third wave and your explanation about why that is incorrect makes perfect sense.
Peter
Thank you for your in depth update.
I have 2 questions though
1 ) Shouldn’t an expanded flat make a new high in wave B ?
2 ) If an expanded flat makes a new high in wave B does it seem
reasonable to expect wave C to be 1.618 times wave A ?
I agree we should not expect a new high yet i do see the potential
for it .
Thanks again for your time and energy put into your updates
Joe
1) No, then you’d have a fifth wave.
2) See 1)
From what I can recall, the b wave of an expanded should indeed exceed the start of the a wave (but not exceed 2X the a wave as a guideline) and the C wave should also extend below the low of A. A regular flat should retrace at least 90% of A, and as Peter noted, in a running flat C need not move below the end of A. It seems to me the running flat idea is less likely because how high the current B wave has already advanced. I am not sure why a new high would invalidate an expanded flat for the structure since the b wave is supposed to move past the start of a. Am I missing something?
Clearly, substantially pass the start of A would be another matter entirely.
Quick question Peter. I have seen quite a few counts that concluded that triangle was still valid and that it simply sported an unusually short E wave prior to an upward break. I too was expecting a sharp out of the triangle but not that quickly and had simply concluded the E wave was atypically short. I did a bit of research and it seems as if the triangles will more often than not adhere faithfully to their trend lines. I was wondering what about the structure that made you ultimately discard that possibility. (i.e. a completed fourth wave)
By no stretch of the imagination is that a triangle. It’s an ABC pattern only.
Thanks. I also just noted unlike Joe stated, you did not call the structure an expanded flat but merely a regular flat. Never mind! 🙂
I asked the question based on the last paragraph
I also asked the question because the oex has failed to
get above its march 15-16th high
i also asked the question because if the oex does exceed
its march 15-16th high and yet the nya and dow as well as oex
fail to make new highs , the spx might make a new all time high .
it would be a bearish divergence and therefor could be a B wave
on the spx only ( if all the above actually happened )
as it stands right now a regular flat makes the most sense.
the other side of this ill leave left out to remove any confusion
That said (as I explain above), we have two flavours of flat that could materialize. As a result, I don’t have a clear target for a bottom. A running flat is very rare, but this is a rather bullish market, so I consider it a possibility A running flat will not drop to a new fourth wave low. An expanding flat, on the other hand, will drop to a new low. This is the higher probability, imho.
Quite right Joe. I stand, (again!) corrected.
In a
regular
flat correction, wave B terminates about at the level of the beginning ofwave A, and wave C terminates a slight bit past the end of wave A, as we have shown in Figures 1-29through 1-32. Far more common, however, is the variety called an
expanded
flat, which contains aprice extreme beyond that of the preceding impulse wave. Elliott called this variation an “irregular” flat,although the word is inappropriate as they are actually far more common than “regular” flats.In expanded flats, wave B of the 3-3-5 pattern terminates beyond the starting level of wave A, andwave C ends more substantially beyond the ending level of wave A
Figure 1-42 depicts contracting triangles as taking place within the area of preceding price action, inwhat may be termed
regular
triangles. However, it is extremely common for wave b of a contractingtriangle to exceed the start of wave a in what may be termed a
running
triangle, as shown in Figure 1-43. Despite their sideways appearance,
all
triangles, including running triangles, effect a netretracement of the preceding wave at wave e’s end.
depending on how you wish to count this
ill point out some Fibonacci time relationships
march 1 high to the march 27 low was 18 trade days
18 * 1.618 = 29.124, march 27 plus 29 trade days is may 8th ( next Monday )
if you take the march 1 high to the low on april 19th you
count 34 trade days ( dow ) , a .382 time retracement would be 1`3 trade days
and you get may 8th ( next monday )
This market is full of Fibonacci time sequences . so many i m amazed.
Wave counts , im not fixed on which is correct yet i do see the need
for another decline and yet the strength of late keeps me from being
aggressively bearish .
No doubt the picture will clear soon enough .
Time was created with the big bang when there was no earth and – I assume – no stockexchange. The concept of weekends and trading days is man-made. That is why I prefer calendar days for my analysis.
Garret says that there is a 17 year cycle and also hint of a 34 year cycle. Numerology says that if 34 year is a cycle, then 34 weeks is also a cycle.
European market are closed today due to laborday. In the US labor day was 9/5/16. Difference : 34 weeks. S&P made a high 9/6 and nyse 9/8. 9/9 was a sell off and 9/12 we had a low. Add 34 weeks and we get a high 5/2, a low 5/3, a high 5/4, a sell off 5/5 and a low 5/8. 17 weeks after 9/8 we had 1/5/17; a high.
Ray Tomes says that strong harmonics always have a 1:2 relationship. So if 34 is strong, 17 and 68 are also strong. 1/20/16 was a significant low. Add 68 weeks and we get 5/10. The real low was 2/11/16 68 weeks later we get 6/1.
So is expect a low by the end of may. 5/10 is a strong vibration, but 5/11 will be a high. As 1/20 was not the ‘real’ low we shoud expect an inversion. 5/11 high, 5/31 low. And by the end of this week a sell off, so the job report will disappoint. In 1929 5/4 was a high. I rest my case.
André
I can hear somebody think that if 68 weeks is strong, then 68 days should be strong too. 3/1 was a strong date and the start of a Multi week decline. 3/1 + 68 days is 5/8; Very strong date. Should have been a high but will be a low as the high will come 5/11.
And what about 68 months? 10/4/2011 was a very significant low. Add 68 months and we get 6/3/17. So a low 5/31-6/3 in likely. 68 weeks after the 2/11/16 low is 68 months after the 10/4/11 low, is early june.
Andre,
I appreciate your post but must submit an observation:
The Law of Entropy would exclude this incredible orderly creation as arising from the chaos of a big bang.
Now, it could have arisen from Intelligence providing order and information from outside of the system:
“And Elohim said ‘Light be!’ and it was”….. the initial vibration.
Skip,
Appreciate your remark. The key is that vibrations ar not man-made and that is why I have a lot of confidence in them, Think we can agree on that.
Gives new insight into the proclamation – ‘In the beginning was the Word”.
The Quintessential vibration! 🙂
Hi Andre,
As you know I have my 17.6 year stock market cycle which is actually a 35.2 year complete cycle, the 17.6 years is a bull or bear cycle.
I have been tracking my medium cycle for a number of years, 17.6 weeks. The tops line up pretty well…
http://www.17yearstockmarketcycle.com/2016/09/176-week-stock-market-cycle-update-low.html
ATB,
Kerry
Kerry,
Thanks.
http://www.davemanuel.com/where-did-the-djia-nasdaq-sp500-trade-on.php
May 4, 1929 – “No data for this day. Maybe the markets were closed? Please try again!”
You are right; 5/6 was a high but that was a Monday. 5/4 was a Saturday. So the vibration hit in the weeekend. Coincidence?
jody/alex and gang – we are almost there!! GUNS, BULLETS AND BEANS!! BE WARNED!
rut – close up of final C wave – https://invst.ly/3ux1e
rut – final broadening top – https://invst.ly/3ux1s
Maybe the V for FED shenanigans tomorrow? 🙂
It would appear that if we are in a b wave that it is not yet done. Price action today clearly a consolidation so I would not rule out a higher move for b.
A c wave need to begin with an impulsive move down.
The oex today came within .22 pts of its march 15-16th high .
yet the spx and dow are making lower highs .
id like to see the oex go atleast 1 tick above 1060.47
todays high 1060.25 .
end of day update – rut [close up]. Jody we be “close”!! my call is wed for the break.
https://invst.ly/3uyvk
HOLY CRAP! We have been sideways since last Tuesday! So aggravating!
Something needs to happen!! lol
http://www.hussmanfunds.com/wmc/wmc170501.htm
Excellent post! Thanks for sharing!
Dimitri,
Thanks again for posting that link.
Thx D!
VIX retreated to single digits today, displaying the most stunning divergence with market price action in quite some time. This is the kind of unbridled bullishness one sees on second wave bounces after a top is in so I cannot imagine what it is going to do on the fifth wave up. I seriously doubt that VIX anymore truly reflects an actual SPX put/call ration. Something just does not quite add up.
Dave Dubyne tells me wheat prices are headed through the roof. http://www.zerohedge.com/news/2017-05-01/wheat-soars-most-record-after-freak-snowstorm-blanket-midwest?page=1
OK PEOPLES – “MUST SEE” HOUR LONG VIDEO SHOWING BEST EVIDENCE THAT THERE IS ONLY SOVEREIGN POWER ON THIS PLANET – THE BANKING CARTEL.
BE AWESOME AND SHARE WITH EVERYONE YOU CAN!
https://www.youtube.com/watch?v=2gK3s5j7PgA
What an EXCELLENT video! Thanks for posting this.
Peter
I hope wheat does go through the roof .
I mentioned before , a friend of mine is a wheat farmer
in eastern Oregon . he say the break even is 5.20
Wheat is still priced below the cost of production .
I m long the Jan 2018 calls on DBA . I jumped into those
a bit early in mid Feb yet i have paid for those calls by
trading the Dow futures , the trade is at a loss
but my account is up for the year .
its a lottery ticket
the final leg of final broadening top of the RUT and where goes the RUT – goes risk.
https://invst.ly/3v7dt
https://invst.ly/3v7el
oh yeah i forgot – “BE WARNED!”
Tomorrow is a turn date and there’s the FED helping a knee jerk reaction to sell into. Being in the small camp of “the top is already in”…we should have fun soon.
alex,
look where i have place the yellow 5th wave is – it is well below the 3rd wave…..if 5=1, then we will definitely “T” – “R” – “U” – “C” – “A” – “T” – “E”!!!!!!
BE WARNED BUDDY!!! ……
I’m on vacation on a tropical island. Half drunk. Checking AAPL er right now. That’s when u know u got addicted ? – btw I’m following ur technique – get rich or short small pos. trying
I am not sure what’s is going on with the wave count but it is clearly not an impulsive wave C to the downside. It is starting to look like another sideways triangle of some sort, so its a safe bet that the move out of it is going to be sharp. Another surprising upside move? The FED are feckless and irrelevant. If it seems to me that the move takes place in response to their drivel I intend to trade opposite the initial move. Three rate hikes…..right!!
Verne
My concern began when the market failed to peak on april 21.
also the 10 lag of mercury retrograde gave april 19th as a turn date
and from that i had assumed an april 19-21 high . the 10 lag on mercury
going direct is may 13 . yet mercury goes direct tomorrow may 3rd .
the mars Uranus cycle has a turn date may 11th which i have calculated as a
high.
Price wise im focused on the oex and i would prefer it pokes above its
march 15-16th high which was 1060.47 .
Elliott wave is a great tool yet at times i feel it is best to let the pattern unfold
and be a little late .That said i have been waiting for the pattern to clear.
MSFT i find interesting near 72 as well as 74.74 . software has been beating
tech yet has a similar pattern.MSFT made a new high today at 69.71 and closed the day at 69.30 .
AEIS made a low in jan 2016 at 24.25 and hit 75.73 on april 27 which is a move of
over 300% in about 15 months .
TSM had a low at 17.32 in august 2015 today it hit 33.99
that’s almost 100 % move up in less than 2 years .
Monthly chart on TSM has a pretty clean elliott wave pattern .
34.62 would be a 100 % move from the aug 2015 low yet
wave v of 3 will equal wave i of 3 at 34.51 .( pts )
wave i of 3 rose 30.17 %
wave iii rose 38.9 %
wave v will be up 21 % at 34.29
as peter noted this weekend the NASDAQ should be finishing up
its peak .
That was a quick scan yet i am thinking of looking into the software
sector more in depth to see what i think .
Joe
It is sure starting to look like what we have is a larger triangle developing, with only the A and B waves done so far. If that is the case, we will just keep oscillating between the May highs and lows for C, D and E for many weeks, but in all likelihood not make a new high or a new low. Trying to trade a sideways market is generally a pain, but having rough boundaries for the top and bottom in this case still gives a few opportunites imho.
I meant to say April highs and lows…
Verne,
I believe it was you who said ” you were concerned that to many people were looking for…one more wave up.” If so, does that still concern you? Have you read the “link” that Dimitri posted on Monday? Any comments would be appreciated!
It does. I was expecting that some the bullish sentiment would be dispelled by at least a 5% correction but the banksters simply refuse to let the market experience a normal correction. Since we have not had a real impulsive move down off the highs I suspect we have at least one more push higher after all this sideways consolidation to relieve the overbought condition. I did read that article from Hussman and it was very insightful. While we cannot be sure when, many of us are convinced this thing is going to end badly. My approach to to accumulate put on the indices a year out. That 0.6 GDP print for the first quarter tells me we are probably already in a recession and the banksters, deep pockets or not, are soon going to have to pay the piper. I am also shorting Tesla. It’s going to take a 50% haircut.
Thank You!!
I’ve followed Hussman for years, but mostly to my detriment. He’s been good at justifying why the market is overvalued and how we are close to a recession, and that has led him to a bearish stance in his fund (HSGFX), which is down 40-50% over the past 5-10 years. He will be right one day, and hopefully soon, but I would not recommend trading on what he says.
Peter Ghostine NDX forecast – April 14, 2017
http://tinyurl.com/lelfbsh
Another clue-less so-called analyst…these people must be smoking something…
Oz has a valid point. Analysts who over the past several years failed to properly account for relentless central bank intervention in the markets have really paid the price. It had to be clear to anyone paying attention that one way bearish bets in this market were going to get run over. The perversenes of the bankster mind-set is clearly seen by Draghi”s numbskull recent drivel about even more ECB stimulus. They will not stop until the system implodes. Hussmann I think is right about one thing, and that is that when the thing finally blows up, it is going to be sudden. Rmember those 1000 point DJI futures declines arrested by banksters recently? That kind of tom foolery has put most market participants in a conplacent stupor. Just look at VIX.
Let’s see how the banksters handle a 10,000.00 point DJI plunge!
revised count for RUT final leg – https://invst.ly/3vfwh
run NOW…….. !!!
final leg RUT – ALT COUNT – just in case prices start to drop hard from these levels
https://invst.ly/3vgrr
BE WARNED
Don”t worry folk. No need for alternative counts at this stage imho.
These markets are probably all going to turn down in earnest in unison and with a ferocity that will leave no doubt about what is unfolding. My suspicion is that it will not happen intra day, but we are going to see instead an implosion in the futures market that no amount of bankster liquidity will contain. A person I know just told me he had moved his entire portfolio into FANG stocks as well as Microsoft. Nuff said!
Verne
Fundamentals work great in a bull market yet fail miserably in a bear market.
Your friend is going with the trend, near the end of the trend we will see
fewer and fewer stocks rise yet those few stocks will move the indexes
to new highs. following the leaders ( leading stocks ) will give you the clues.
NVDA topped in December and it was a leader last year.
It is easy to get caught up in the why the market should do this or that
but the when part is always the mystery .
Elliott wave theory is the pattern and until the pattern completes
the market will ebb and flow and throw us off .’
The questions i always ask and people have a hard time answering this is
why is this market rising ??
where is the money coming from ?
where do we put our money ?
Oddball question :
mercury turned direct today, will the stock market rise now
into the may 11-13th time frame ?
Is it fair to say that the may 2-3 date was indeed a low ?
Fibonaccii is still working up to today .
the before and after
first was posted near the high and second posted just now .
until this fails i have to go with a move upwards into next week.
im ok with it being a high , not saying i want a new alll time high
yet with the spx i allow for it and with the oex nya and dow i prefer
they fail to make new all time highs
http://imgur.com/FEQOsfo
http://imgur.com/rdEkxRF
so far
we have a high on
april 26th
this decline has lasted 5 trade days ( another fib )
you can see the 13 trade day low to low and today
is 13 trade days from the last april 13 low . ( another fib )
and the swing high on march 15th was 34 trade days ago
that makes today a triple time line .
id say today’s lows are now key in terms of price.
May 10th is the next fib date .
may 11th is the mars Uranus date
may 13th is 10 days after mercury went retrograde .
this viewed based on mars Uranus
http://imgur.com/t4Ap9vk
From what i am seeing this market is acting as it should
Fibonacci time sequences all showing up everywhere .
my focus will become more and more based on Fibonacci
dove tailed with mars Uranus and don’t forget we began
a Venus bull market on march 27th which is also where we
saw an important low .
The wave count will show up no doubt yet at this point in time
i m trying to keep an open mind
what im saying is im expecting a low into option expiry
which to me kind of stinks .
i don’t trade option expiry weeks yet i might this time.
as a rule though i don’t
Warning :
The mars Uranus chart does not project prices
what it does is project strength of a move .
the projection from may 18th ( and may 25-25 )
into June 30th should be a strong upward move .
there is inherent flaws in this cycle i have not gotten into
and while it shows the next 2 years there is only a few
key time frames that i key off of .( based on years of observations )
May 18th to June 30th is the time frame im focused on .
the rest ill go into from time to time
Joe – Have you got a view on Gold
Stan harley. On tfnn said. High on may 15. Low on june 20
Hi Rose,
I always followed Stan Harley on this site:
https://www.equities.com/user/32115#articles
But there are no updates anymore is he a regular guest on tfnn now?
Thanks.
John.
Stan harley was a guest. At 830 am. Tfnn .com. i think it was last friday . He said low in june 20 rally. Fall _Low. And market strong till i think narch next yr
It should be in archives. Otherwise call them for exact date
Forgot to lention he was guest to larry pesavato show
Can you give me the link and the time of the tfnn video please?
Thanks.
April 28th Trade What You See with Larry Pesavento on TFNN – 2017
https://www.youtube.com/watch?v=q7GWIhO5QD0&index=4&list=PL4904950210BFDEBE
Thanks Rotrot,
Red Dog
I have no opinion on gold
i watch gold as well as the gold stocks yet
no solid point of view .
Are Stocks Markets About To Weaken Into The End Of May To Mid-June?
http://www.safehaven.com/article/44303/are-stocks-markets-about-to-weaken-into-the-end-of-may-to-mid-june
Stock Barometer hasn’t posted at SaveHaven for a couple of years…interesting that they posted again on May 2, 2017…historically, their turn dates have been pretty good…however, the polarity is never a lock…
Comments have been made about the impact of central bankers on market prices. Below is an excerpt from the most recent report by Phoenix Capital Research (paid subscription) that touches on this, with supporting details in the report.
“The market rigging of the last week has been more extreme then usual. It is now clear that “someone” was well aware that the Fed would be hawkish today and has been playing the usual rigging games for the last week to insure stocks entered today as strongly as possible. We’ve covered these schemes before… but by way of review there are currently two market rigs occurring. They are: 1) “Someone” slamming the VIX lower to force risk parity funds to buy stocks 2) “Someone” ramping the $USD/Yen pair to push stocks higher It’s fairly clear that the “someone” is a large bank acting as proxy for the Fed. The fact that these rigs become more pronounced around Fed announcements/ meetings only confirms that it’s someone “in the know” taking orders.”
Yep! I hear people smugly talking about how naive people are for thinking that banksters can manipulate the market and insist that it is just too big for that kind of intervention to have any effect. It is really difficult for me to imagine how any intelligent person for example, can look at what has happened to VIX, in the face of national and global economic realities, to say nothing geo-political risks, and not conclude that we are right there with Alice in Wonderland. Few people are aware of pairs trading and VIX driven algo purchases but that is exactly what has been going on, with the Yen being the bankster whipping boy. They are just about at the limit of the effectiveness of these strategies though. Their efforts are clearly becoming more labored. The average clue-less observer will not have a sense of the enormity of the malfeasance until the whole thing collapses. There will be blood…
I predicted USDJPY was going to 113.00 over a week ago. So “someone” in that large bank must be psychic, or they know Elliott wave analysis.
You were also right on the money about Gold and Silver retreating! 🙂
You came pretty close. The 15 minute chart printed a hanging man candlestick at 113.01, so could you try an be a bit more accurate next time?! 😀
My target was actually 113.124, so I may have missed by .24, as we may have topped … lol. AUD is also sitting right on the target this morning. ES almost there. 🙂
If the Yen indeed is finding a bottom, equities are about to get whacked. They have been driving prices up with the dual short volatility short the Yen tango.
Andre’,
Did you decide not to post about “numerology as numbers are vibrations” or something to that affect? You mentioned that last week! Thanks!
OZ
If the so called banksters can make the market go where ever they desire
then how is it that they all blew themselves up from 2007 into 2009 ?
sure they have more capital today yet i seriously doubt they can
force the market to go any direction .
To assume the bankers are really in control would assume technical analysis
as well as Elliott wave theory is meaningless.
id rather admit i was wrong on the direction then to blame anyone else.
So Joe, do you think markets would be trading where they are today without central bank intervention?
Speaking of which, I am totally amused about all the talk of the FED “unwinding” their multi-trillion dollar balance sheet. Are people forgetting that these guys were the lenders of last resort? I got one question for all the geniuses out there:
Who the hell are they going to sell that stuff to???!!!!
Joe,
do you remember the volatility in Chinese markets two-three years ago ?
It’s calm and stable since.
And this stabilisation has strangely happened after the official meeting between Chinese authorities and Citadel in Pekin.
Quite a few folk were convinced that the next global crisis would start in China because of the incredible debt and mal-investment there, spread to Australia with whom its economy is closely linked and where there is also one the world’s largest real estate bubbles. There is however a crisis quietly developing in another region that also has a spectacular real estate bubble, but where the banks are already showing signs of strain, and that is our neighbours to the North, Canada. There are whispers of bank runs in the offing, and already two well-know non-bank mortgage lenders have had to secure emergency lines of credit to the tune of billions at exorbitant rates of interest, like some 22% for the first billion, and 15% for the second if accessed. Just take a look at the charts of banks up there and you will see what I mean. We are entering the ninth inning folk.
Meanwhile, all the clue-less talking heads believe the FED is going to raise rates next month….better get ready for QE 5….
they be “playin” wit us – almost there!!!
https://invst.ly/3vrsx
Luri, looks like the 50 ma is red and the 100 ma is blue. What is the darker ma/indicator?
The red one is 20, blue – 50, black – 100
thats right, the black is the 100, and this snapshot is on the 30 min time frame.
spiking panic wave “e”…… buy up into NFP tomorrow, and then the ‘bloodbath’ will happen….
update https://invst.ly/3vs-o
Oh thanks. It’s always interesting when price action respects the MA.
Bought US market before healthcare vote on Thursday. Guessing we see irrational exuberance in markets until next Tuesday.
The short vol and the Yen and pump equities trade is blowing up. If the Yen keeps going up that particular little subterfuge is out the window. What next?
Uvxy making slightly higher hi’s and higher lows.. SPX has now broken below the trend line from Tuesday of last week. We should start to see some downwards pressure.
But it does seem anytime we start to head down someone steps in and buys the market.. We shall see…
We have been in this trading range for 56 hrs..
The SPX trend I actually misread – it goes back 2 Tuesdays :/
This website is for educational purposes relating to Elliott Wave, natural cycles, and the Quantum Revolution (Great Awakening). I welcome questions or comments about any of these subjects. Due to a heavy schedule, I may not have the time to answer questions that relate to my area of expertise.
I reserve the right to remove any comment that is deemed negative, is unhelpful, or off-topic. Such comments may be removed.
Want to comment? You need to be logged in to comment. You can register here.