
 Charles-Marie Gustave Le Bon (1841-1931) was a French polymath, who is best known for his 1895 work,”The Crowd: A Study of the Popular Mind,” considered one of the seminal works of crowd psychology. He’s attributed with the quote,
“The memorable events of history are the viable effects of the invisible changes in human thought.”
Robert Prechter writes in “The Wave Principle of Human Social Behavior” that
“Major historic events that are often considered important to the future (i.e., economic activity, lawmaking, war) are not causes of change; they are the result of social mood changes that have already occurred.”
“Brexit” was a one day event—a vote by the citizens of the United Kingdom to leave the European Union. The recording of the referendum vote in June, 2016 was merely a “marker” of a social mood change that had already taken place. The point is that collective action is a lagging indicator of aggregate mood change. While an individual can initiate action immediately upon a change in mood (by casting a vote), society requires a good deal more time for an extensive swing in mood to be registered as action; before laws are written and actually put into effect, for example.
These latter activities will show up in accepted social customs well after the mood of the crowd has changed solidly in that direction.
But people continually mix up these “marker events” with an immediate shift in mood and expect, as a result, an immediate turn in the stock market. But the cause and effect is not that immediate. This is why I’ve adopted the mantra: “Events don’t move the market.”
Back to that vote on Brexit. I remember it well, because while I expected a turn down in the market (we were at an obvious top), I was on a plane from New York to Calgary (out of touch for about 8 hours). I was not able to take advantage of the event. When I landed late on a Thursday night, the damage had already been done. The market continued down to a bottom by the following Monday.
It was at that time that I assured people that the market was going to go straight back up; the waves had obviously dropped in a 3 wave (abc) configuration and it was, after all, an “event.” I can remember at the time being in a crowd of one in terms of my opinion, but sure enough on Tuesday, the market headed back up.
The Brexit vote was simply a marker of mood. Mood had already changed, but the effects of that mood change had not been put fully realized. No laws had been passed—there was no visible change in behavior. In fact, some five months later (November, 2016), not much has changed in the U.K.; they’re still discussing the vote.
The Economic Consequences of Social Mood Trends
Bob Prechter (author of “The Elliott Wave Principle”) continues,
“Social mood trends have economic consequences. Men make decisions that lead to the production of more goods and services when the dominant social mood is positive rather than negative; and vice versa. The reason for the lag between mood (as tracked by the stock market) and economic result is that it takes time for people to turn their decisions into policies, and eventually into actions.
As a result, economic trends lag stock market trends. This is an established fact, as the National Bureau of Economic Research in Cambridge has found that, year after year, the S&P Composite index of 500 stocks of major corporations is the single best indicator among the dozen that the Commerce Department uses to foreshadow broad economic trends.”
However, it is the trend (the change in social mood over time) that creates the change in action. Events themselves may have a short term effect of a day or two, but the trend will eventually continue on its original path.
If you understand this phenomenon, you’ll be both a better short term and long term trader.
The American Election
The most recent event that’s reverberating around the globe in the Clinton/Trump rivalry which has culminated in Donald Trump being elected as the next US President.
In the same vein as the Brexit vote, I’ve been hearing people’s predictions for the changes in the stock market for the day after the vote. Again, I suggested we might have some short term volatility, but I wasn’t expecting anything that would last past a day or two. This is exactly what happened, for the same reasons I cited above.
What was the more interesting part of the exercise to me, was to see (as a result of the vote), how far along in the revolution the American people had come. That’s what I was expecting the vote to tell me and I believe I received a fairly accurate answer.
I say this because Elliott Wave Theory tells me we’re weeks away from a market top. At the same time, the results of the elective were so close, it’s transmitting a similar story. The revolution has not turned negative yet … but it’s very close.
I’ve written here before that I believe we’re in the midst of a major financial and economic revolution, an age-old struggle between the rich and poor; the common man and the moneylenders. It goes right back to the days of Jesus in the Temple. That was two thousand years ago, a conflict that continues to play out again and again every 500 or so years.
However, one event doesn’t change the social mood. We’re in for a very long process in thinking and institutions. The the markets will soon start to be a very much more “vocal” marker of the immense changes society is going to experience—changes of epic proportions.
 The Color Purple
The newest phenomenon that seems to be playing out this weekend is the “flag” to the use of the color purple by the Clintons. What concerns me is that this might be a conscious effort to have a greater effect on public mood. I hope I’m wrong in imagining that there’s a more sinister double narrative to the more positive attempt at healing the nation by bringing the blue and red parties together in process of healing.
Perhaps I’ve become a little too cynical, should relax a bit more, and accept this gesture for what it might seem on the surface.
In the meantime, let me draw your attention to this article on Zerohedge. com: The Concession Speech by Senator Clinton.
With enough financial backing and the ability to mobilize groups to create a movement, a series of ongoing events could gradually take social mood down a very dark path, I fear. There are already rumblings of civil war. I hope as mood generally turns negative, we can keep our travel to the higher road.
It’s not events that you have to watch out for; it’s the mood of the crowd that has changed history.
____________________________
Ending Diagonals
Ending diagonals suggest a market that is extremely weak and barely able to trace out a new high. Although it falls under the banner of a motive wave, it has properties more aligned with corrective waves. Ralph Elliott described an ending diagonal as occupying the fifth wave position of a motive wave when the preceding move has gone “too far too fast.” He maintained that it indicates “exhaustion of the larger movement.”
Projection for a Top
Based on the ending diagonal we’re currently in (which is the pattern playing out in all the major US indices), I’m now projecting a final top to our five hundred year set of Supercycle waves at the end of the 2016 year or into early January.
TruNews Interview
Here’s my interview on TruNews from Friday, November 11, 2016: http://www.trunews.com/listen/11-11-16-peter-temple-america-under-new-management
______________________________
Here’s the latest daily chart of ES (emini futures):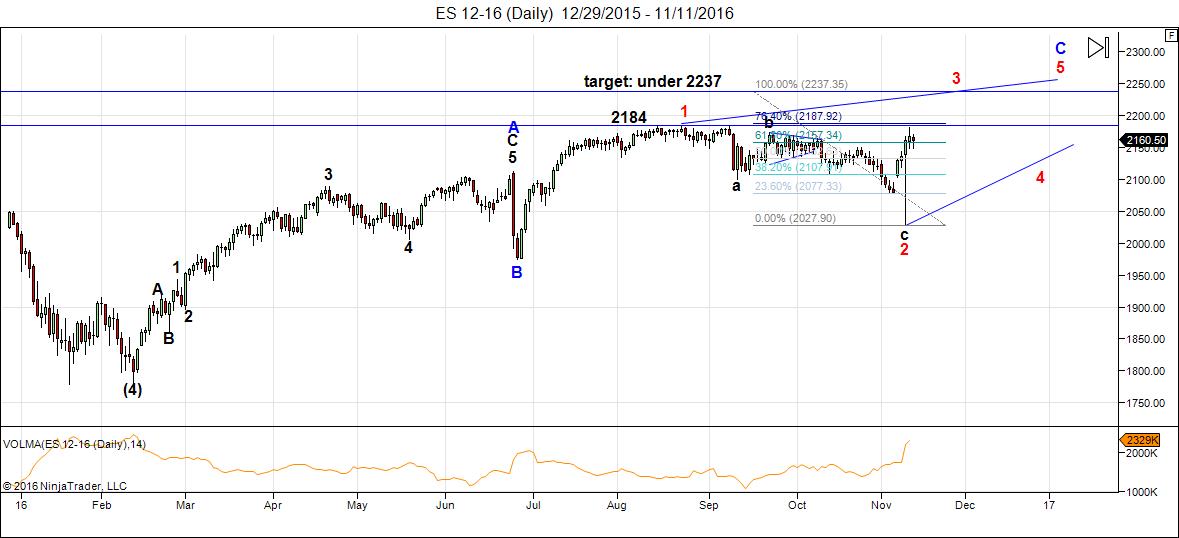
I’ve re-measured the potential targets for wave 3 of this ending diagonal, trying to make them as specific as I can. The top end for the 3rd wave is 2237 (where wave 1=3). The previous wave 1 high is 2184, so wave 3 has to exceed that level. If we project wave C of 3 to be equal to wave A (starting at the low of our current wave B), then our upper-end target would be ~2232. In zigzags, wave A usually equals wave C in length.
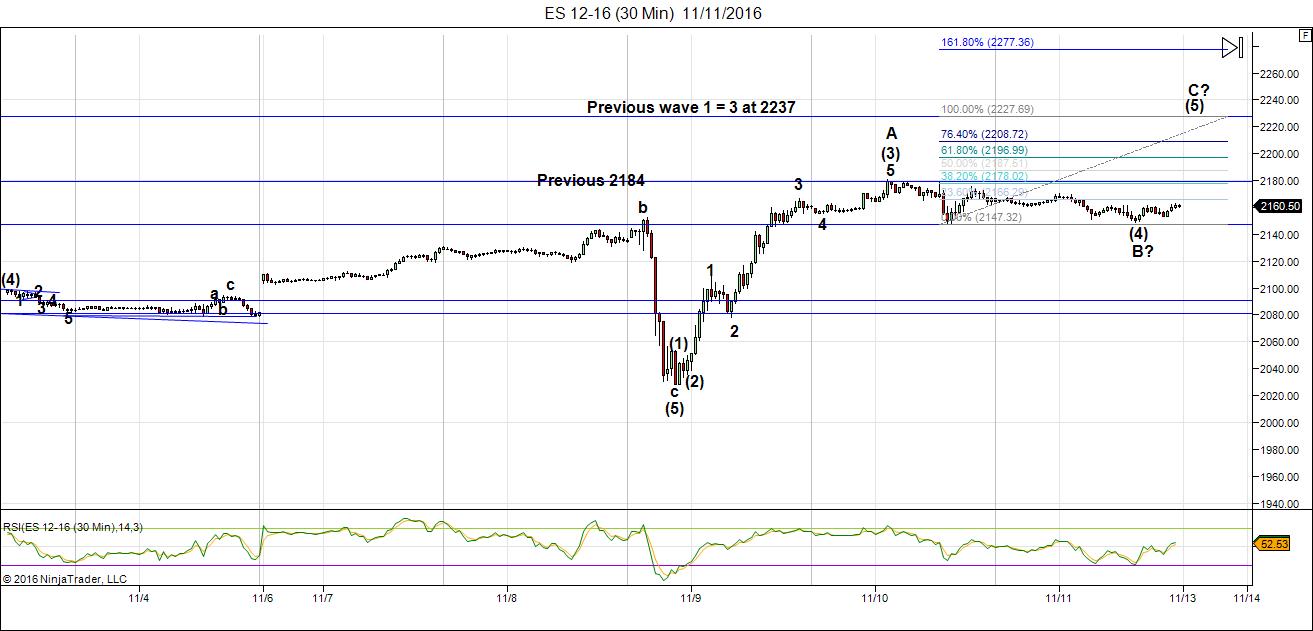
Above is the 30 minute chart of ES showing the third wave of the ending diagonal in a bit more detail. We’ve likely seen all of wave B of this third wave up for ES. That’s because NQ (Nasdaq futures) retraced 62%, which is typically a full B wave. Since these indices move more or less together, the B wave for ES is also likely complete.
There’s also support for this prognosis in the USD currencies seem to have bottomed and now have to head back up, keeping with my ongoing theme of “all the same market.” USD currency pairs are more or less in sync with the US indices.
Summary: We are completing the third wave of the ending diagonal before zigzagging to the top of the largest bubble in history. The long awaited bear market is getting closer.
Let’s look at a recent projection from the Trader’s Gold service.
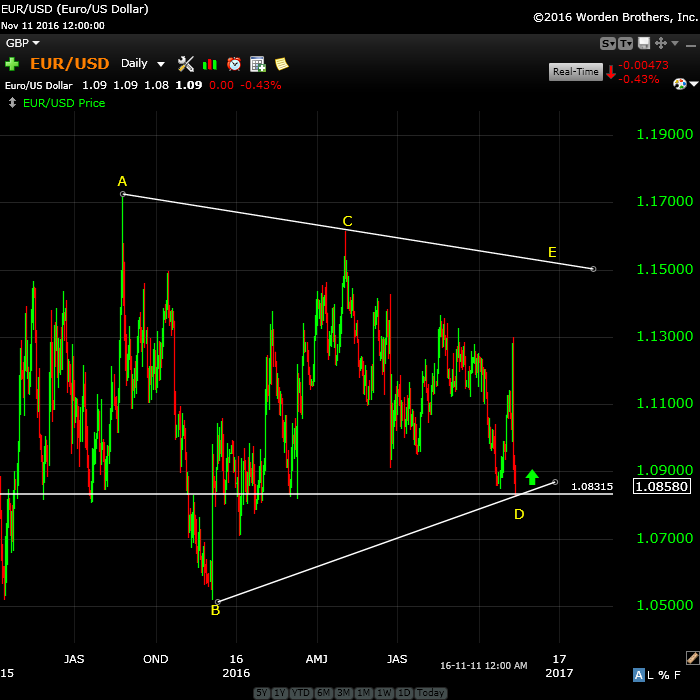
Above is the daily chart of EURUSD. I had predicted a turn up in the euro was imminent on October 24. We indeed turned up, but with the American election, have retraced back down to the lower trendline. That retrace was due to an event. However, the one area in which an event can have a longer-term affect on the market is at an inflection point.
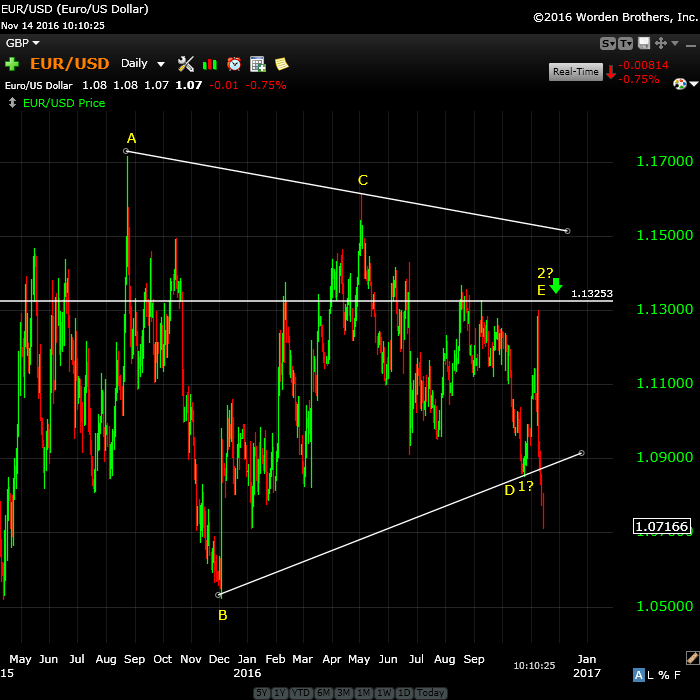
Above is the daily chart of the EURUSD showing the breech of the lower trendline of the triangle.
From the Elliott Wave Principle: “On the basis with our experience with triangles, we propose that often at the time at which the boundary lines of a contracting triangle reach an apex coincides with a turning point in the market. Perhaps the frequency of this occurrance would justify the inclusion among the guidelines associated with the Wave Principle.”
Last night, EUR completed the E wave and is now in a first/second wave combination. Expect a retrace back up to the top of what I’ve marked as the top of the yellow 2 wave and then a third wave down after a major turn.
___________________________
Sign up for: The Chart Show
Thursday, November 17 at Noon EST (US market time)
 The Chart Show is a one hour webinar in which Peter Temple provides the Elliott Wave analysis in real time for the US market, gold, silver, oil, and major USD currency pairs.
Get caught up on the market from an Elliott Wave perspective. You’ll also get Andy Pancholi turn dates for the balance of the current month. There’ll be a Q&A session during and at the end of the webinar and the possibility (depending on time) of taking requests.
All registrants will receive the video playback of the webinar, so even if you miss it, you’ll be sent the full video replay within about an hour of its conclusion. For more information and to sign up, click here.


Thank you, Peter, for continuing this site and sharing your thoughts with the world.
Thanks Peter …….n
Thanks Peter!
I also hope everyone got chance for a clear sky and peak at the moon last evening. Didn’t need street lights last night.
“The memorable events of history are the viable effects of the invisible changes in human thought.”
VISIBLE.
I’ve re-posted my chart of the EURUSD in the post this morning as there was a major change in the status of the triangle overnight. The triangle has been breeched and this puts us at the beginning of a larger fifth wave to the downside.
peter,
Bernankes “QE Forever” was an event. he placed a “put” under the market and told participants – “we have your back” there will be no loses so BTFD. am i supposed to infer that without this blatant ‘strong arm’ manipulation of all markets by all central banks – that the spx would have gone to 2200 and beyond without their financial asset pumping agenda, gone to the levels based only on multiple expansion?
An “event” being a happening at a single point in time … that was more like the action following the event where he woke up one morning and declared, “Let’s save the banks, the hell with anyone else!”
Peter, It appears that when you were doing the calculations to project the end of W3 you were using W1 and extending just beyond that point which would make W3 longer than wave 1.
Am I reading that correctly?
Your comment copied from above…
“The previous wave 1 high is 2184, so wave 3 has to exceed that level.”
In an ED wave 1 is always the longest and wave 4 must over lap wave 1 (As per the Elliott Wave Principal Book by Prechter and Frost) so I am a little confused by your comment.
Please advise.. Thank You…
Jody,
I’m confused as to what the question is. Wave 3 must go to a new high; it also cannot be longer than wave 1. So I used wave 1 for the distance for wave 3, which means wave 3 cannot exceed 2237. It must also go to a higher level than 2184 (the top of wave 1), as that was the previous high.
I’m dealing with a fair bit of tooth pain at the moment, so you’ll have to help me with what I’m missing, which might be a lot …. 🙂
Peter,
I hate tooth pain, sorry to hear..
We are saying the same thing then.. I was a little confused when I read it.. Thanks for the clarification.
Hope you get to feeling better!
Implants. I hate them. One went really well, the second one is wreaking all kinds of havoc. So it’s a toss up (contrasted wtih this market) as to which one is the worst to suffer through … the pain is making this market pleasant …. not a good thing … 🙂
Yeah, hope that changes … I’ll live. At least I didn’t win a big election and am forced to wear purple … much worse.
peter,
what you need is some good old fashioned flowers [of the cannabis indica variety] in order to sooth that pain away.
I agree. Colorado is more than a days’ trip away.
I’ll warn you, I was at the original Woodstock … so don’t get me started … 🙂
Peter, I recommend Brandy soaked in cotton wool…..or is that the other way round. Any way it does work…eventually. I remember using more Brandy than cotton wool. I think the ideal ratio is 1 wool to 10,000 Brandy. I may be a bit light on the ratio here.
Thanks, Purvez. And if I’m short on wool, perhaps I can substitute a little of the cannabis (although I may need a road trip for that …and then there are those pesky border guards to contend with …). Although if your remedy works, I suspect I’ll just be fine sitting here … for a long while …
Oh it works all right. You don’t remember ANYTHING, never mind the pain.
haha.
Couple of ideas. Concrete is usually the best.
https://www.disabled-world.com/medical/alternative/homeremedies/toothache-remedy.php
energy chart for Nov. 14th to Dec. 14th
https://s22.postimg.org/5ete02tdt/Nov_14_to_Dec_14_energy_stream.gif
There’s an Italian referendum on Sunday Dec. 4th
that might explain the big drop off starting Dec. 5 into Dec. 9th
I follow the streams not the events but the two seem to dovetail
https://twitter.com/SaraEisen/status/797847345568182272
I can see a 4th wave perhaps around 24 and then there’ll be a B wave of the final wave (Dec?) but I don’t think we’ll see the top until after Xmas. Pure speculation.
Tom,
How do I interpret your chart for next week? It looks like there’s a swift vertical drop from the 21st to the 22nd, a bounce then a retest of the 22nd low.
yes it looks like a lot of whipsaw that week
not for the faint of heart
Tom….I write with some hesitation here. Clearly you have something that MANY here are interested in (including ME) and I don’t want you to stop posting because of what I’m about to ask you.
Please can you tell us ‘WHAT’ energy waves these represent? I also dearly hope you don’t say ….’the helpful’ kind.
Of course if what you are providing is ‘proprietary’ then please do say so and we’ll back off.
Looking forward to understanding your charts that much better.
No soup for you!
Valley,
Are you planning to short here and wait for 2/3 weeks.
Bill
Hi Bill,
I am long tech right now. PALS is mixed with seasonals and declination positive, and phase and distance negative for balance of the weak. Next week is mixed also. I am sticking with tech into the beginning of the year mostly on seasonal patterns.
OK, this is exciting! I think there are many bright and good analysts on this site and that’s why I follow it and contribute from time to time. I specialize in cycles, but use all forms of technical analysis and right now I see a compelling formation. On Thursday of last week as the Dow closed at a new all-time high, the Ratio Adjusted McClellan Oscillator was at -1.5 and the Ratio-Adjusted Summation Index was at a stunning -305.1. A new high in the Dow had NEVER in history been registered with such poor accompanying McClellan breadth readings. When that occurs, it is difficult to draw conclusions except for the obvious one just stated because there is nothing to compare it with, it is so bad! So let’s look at the following two days, Friday of last week and Monday of this week. They both registered two new continuing all-time highs. By yesterday, the new Dow high occurred with RA Oscillator at +7.2 and RA Summation Index at -293.4, not as bad as Thursday, but horrible breadth considering Dow’s all-time high, and here’s where it gets exciting. There have been all-time highs registered on the DJIA before with similarly horrible McClellan readings, so now we have something to compare it with. There have now been 3 consecutive readings as bad or worse than yesterday’s as the Dow made new all-time highs. Where has that happened before? Glad you asked! Last time it happened was May 19, 2015, a day that remains within 2 days of the all-time high of the NY Composite Index. It happened Sep 18 and 19, 2014. It happened on July 16, 17, and 19, 2007. With one other exception, those are the only occurrences in the new millennium. But how about these previous dates: Feb 9, 1966, and Jan 5, 8, and 11, 1973. Those are stunningly accurate dates of two of the most important market tops of the past 50 years. No warranties or guarantees, of course, but the suggestion is that, even if there is to be a final, final top another month or two out, this market qualifies as a top right now which, as said, may or may not be exceeded for a decade or more. There are other negative technical readings like Arms Index (TRIN) and Fosback’s High-Low Logic Index (the precursor to Hindenburg Omen signals), but those breadth figures have chosen some stunningly accurate tops in the past. Let’s see what happens here…
I agree, of course, that we’re very near a top. We still have these final EW patterns to play out, but with the EURUSD dropping through the triangle bottom, the patterns endings came a little bit closer …
Thanks for all the work you put into this comment … I’ll let others have a gander …
With the ending diagonal configuration, we should have a relatively obvious topping process.
peter,
there is something that seems intuitively “off” as per timing. the euro/usd had a short wave ‘e’ and prices turned down and broke the triangle. this indicates a fifth wave down for the euro [5th wave up for dollar] . so the currencies have ‘turned’ but the equity markets – not so much….
the equity market should be ‘turning’ with the turning of the currencies – NO?? why is there such a discrepancy in ‘timing’? what happened to ‘all one market’ behavior??
Just when I thought it was safe to get back in the water again … lol.
Try and put the intuitive on a shelf for a minute. These markets have been moving almost in lock step for over a year and getting closer and closer aligned. However, they’re not going to make it THAT easy! At tops and bottoms, major markets tend to turn at different times. The euro is way weaker, it’s likely not to exist in a couple of years (or sooner).
So it’s topped one wave earlier than the US indices. Money-wise, that’s 0.02 euros early. That’s tiny. I’m expecting the eurusd to get back to 1.13 at the US market hits its high. So that’s still going to be 0.02 euros off where it otherwise would have been if they had topped together.
I’m also looking at at USDJPY having topped and may be in a first wave (more freebies!) and I’m watching it rather intently.
We’re REALLY near a top and I would expect some assets to start peeling away (the weaker ones) as the greatest nation on Earth EVER … keeps up the charade just a little longer … but I think for all intents and purposes, we’re just about done there, too. Except that the pattern we’re in has to play out and it’s stuck in an ending diagonal.
So, that’s my take on the quasi fundamentals, because I’d much rather stick to technicals. Technical tells me the euro is done (I can see a big fork stuck in it), and in the batter’s box is ES, SPX and the like. They should start piling on strikes here shortly …. (miss baseball) 🙂
peter
so last question of the ‘serious’ inquiring kind then back to humor – why must the ending triangle be of the contracting variety?
is there no analysis of this seemingly evident ending triangle on the ES that looks very much like an ‘expanding’ one?
http://invst.ly/2rz1t
OK … that question you’re going to have to pose to Mr. Elliott when he comes back round again. It’s more important that it happens usually at very large degree levels (super cycle or cycle) which his what we’re at.
I other part of the question, I suspect because converging triangles are so balanced – they’re horizontal. Ending diagonals don’t count cause they’re in motive waves (bullish or bearish). In other words, they’re not corrective. All the other triangle are corrective, but they’re on angles, either up or down (barrier, running, etc.).
A slight correction on my data. Although the numbers on the Oscillator and Summation Index are correct for yesterday, when I tested for prior occurrences I mistakenly wrote the formula as looking for prior all time highs accompanied by Oscillator readings lower than 7.3 and Summation Index lower than PLUS 290. I inadvertently entered two consecutive minus signs in the Excel formula which were interpreted as a plus by Excel. Other than that, the spectacular resulting dates are exactly as stated. Exciting stuff, I think…
Peter (non Temple variety), many thanks for sharing that. Interesting and exciting times.
Hindenburg Omen – StockCharts, November 16, 2015
https://twitter.com/stockchartscom/status/798874054371393536
Andre’,
I hope we have not lost your input! Read that “Friday was the worst combined accompanying breadth figures at a new all time high in Peter Eliades’ data that goes back 90 years.” I imagine that November 18th will possibly be an important high just as you predicted!
The fat lady has done another verse this morning. She’s hinted at a rate hike on Dec 13/14 so let’s keep that date in mind.
The content of her speech was published ahead of time this morning here :http://www.zerohedge.com/news/2016-11-16/will-donald-trump-end-american-unipolar-moment
If we get a rate hike, that’s not an event, it’s an action and I’d expect a not very nice result and it’s in line with my prognosis for how much this market has left in it, which is not much …
I am Bullish to S&P 2196.
The top of the Market will be between 2196 and 2025.
I will then look for S&P 1800..
Jody,
You most likely meant a top between “2196 and 2225”, right?
Ed,
Correct, 2025 should have been 2225.. Thanks for pointing that out..
I believe broad international stock market will double within three years.
Reasons:
1. new high tech unfoldment
2. new nests being formed by millenials
3. rise of mega middle class in Chindia and beyond
Brünnhilde has just left the stage after a 20 minute aria and Wagner’s Ring CYCLE ends with that. The fat lady has sung, perhaps ending an equally arduous topping cycle. Do you know anyone who thinks the top is here and now. Oh yes, there are many who think we are close or very close, but do you know any who think it has just occurred over the past few days? Neither do I! I don’t like the fact that this is happening in mid-November. Thanksgiving to Christmas very seldom sees declines of significance, but be aware that one of the most important tops of the past century occurred on December 2, 1968, just after that presidential election. The Dow all-time high accompanied by the worst McClellan breadth readings EVER should not be ignored. Be aware the post describing those conditions was made 11-14 and the opening that day has not since been surpassed despite many new hourly highs on the S&P and other indexes the remainder of the week into now.
Higher interest rates will shock the system.. Its effects will be broad reaching.
In case you have not been paying attention the 10yr T-Note (which is loosely tied to home loans, car loans and your credit cards) has blasted off.. Last week it was 1.75% this week “today” its 2.29%. That is a major move my friends.. Feel free to look at http://www.marketwatch.com and click on the Rates tab then the 10yr Treasury Note then click the 3 month view and you will see how fast this thing has shot up. A close above 2.30 and 2.50 is in the cards. Home loans have went from 3.75% to 4.29% in a week.
The reason Yellen has to raise is because they know this thing is going to be a run away freight train and if they do not the FED will have to tighten at a faster pace then they want to in order to keep up.
Everything is fixing to get more expensive – Way more expensive! The kick in the ass is wages have not risen to keep up. People will simply not be able to afford new cars, new homes or their credit card bill..
It will be multi years before the stock market is back to this level when the turn happens and we are on the doors steps now. The larger rising wedge on the monthly chart says all we need to know.
Credit will be the next crisis.. Protect yourself..
Just the opposite, actually. This is a deflationary environment. The dollar at a new high confirms it. Everything will get cheaper, but debt will balloon in value. Either way, it’s not a good situation. The Fed has no understanding of what’s going on. There’s a good article today here: http://www.zerohedge.com/news/2016-11-16/dollar-illiquidity-getting-critical-10-trillion-short-which-fed-does-not-understand
This is also good about the future: http://www.zerohedge.com/news/2016-11-16/will-donald-trump-end-american-unipolar-moment
Peter,
I had eluded in a prior post that the dollar was in a bull flag and looking to break-out but I did not watch currencies that closely. Not sure where the count was a week or so back when I stated that – but it has moved up.
Deflationary in the sense of goods and services correct – not in a sense of rates. Rates are already starting their move and at last check the 10 T-Note was .001 off of its 52 week high. This move is very disturbing for us in the housing market. It is not normal.
Yes goods and services contract because no one is buying anything which directly rebuts the “Expansion” theory as some have suggested.
When rates go up and housing is at peak pricing something has to give in order to sell. It usually takes 6 months or so for builders to start to adjust.
I believe that the stock market will suffer – not double in the next 36 months.
Just my opinion..
Rates rise dramatically during economic expansions resulting in greater cost to borrowers who are compensated by the higher wages that occur during expansions. The banks are incentived to lend at the new higher rates and so they reduce standards increasing the ability of the now higher paid workers to borrow to buy real estate, furnish the real estate, and buy consumer products to enjoy.
I have been selling real estate since 1999. My Grand Father owned a construction business and my father was a builder. My mother has been doing finance since 1970 so this is an area I have been exposed to my entire life and directly everyday for almost 2 decades. Higher interest rates will choke this market and I am in one of the hottest markets in the United States. I see what people can afford that have good jobs, Tech jobs. Just with the last weeks rise in rates on a $350,000 home the payment has went up almost $200 a month and when rates hit 6% in May possible sooner that will be an increase of almost $656 a month. That is not sustainable. People will stay put and not spend guaranteed.
There are no higher wages..
I would implore that you understand Dodd/Frank before assuming it will be like it was and that banks will loosen up.
Our good buddy Obama signed it into law in 2010 and it severally restricts the banks and their lending standards..
Good info. Jody! I have a picture of next three years if proven wrong will quickly adjust. Thanks.
a gift for the esteemed Peter Temple…?
https://t.co/IIHSE6wfPw
haha. Funny.
Jody
I think in the bigger picture you are correct in regards to real-estate
yet i don’t think interest rates are the reason .
Those that can afford to buy a home will buy a house in an attempt
to buy a lower rate and will do so because they will assume rates are
going to rise . people buy when prices rise and sell when prices fall.
so the initial effect of housing costs going up because of rates will bring
in buyers .
the strength of the us dollar will ultimately create a problem for corporate
profits overseas .
Low interest rates are killing pension funds
more people will buy things as rates rise as long as they feel they can profit
from it .
for the average person higher rates are meaningless
for the us government higher rates are a big problem .
the math i think we should consider is , if the us 10 year hits 4-6%
how would that effect our governments ability to pay its bills .
just as everyone had opinions about the elections here in the states
we are now seeing opinions being played out in the market about
the direction of interest rates and assumptions that trump and co
will do this or that yet these are assumptions at this point .
im not sure which area your in yet there are several cities that have had
huge runs in home prices . the rate of interest wont effect an owner
if his rate is fixed and he certainly wont feel the need to refi .
so the refi business may suffer more so then home prices themselves.
those looking to buy will most like jump in to beat the rate rise .
it is after all of these resets that the market will stall .
it takes time for any market to turn and not every market moves in tandem
if you look around the individual stocks versus the indexes there have been
several stocks that have simply beat the spx nasdaq and dow this year
bank stocks will probably hold up or rise with higher rates . companies with strong sales growth and earnings growth will continue to rise as long as the cycles are pointing up .
interest rates are a non event for the most part at the moment ( they are way to low to matter )
home prices nationwide have retraced just over .618 %
individual areas have gone to new highs in some places and failed to really
get moving in others . the real future trend will be the movement of the masses
i would expect a movement out of California as an example which would be a sign
of a peak in home prices . its to soon to call it at this point .
home prices tend to peak in august then stall or fall into feb.
so it would be next years august figures that will matter in ragards to the long term trend
Joe
Joe,
Do you happen to have either a chart or an article showing or mentioning that 61.8% retracement in nationwide home prices?
Peter or anyone do you think we have reached a bottom for gold? I think it went to @ 1201/oz today. Thanks so much
Not quite yet.
Thank you Peter!
In Jim Hurst’s book, the Profit Magic of Stock Transaction Timing, several fundamental characteristics of the stock market are listed. One of them was that Major International Events have little or no effect on the market.
I think Monday will be a major turn date and then we will be down into December with 25/29 in between. Will give you some arguments tomorrow.
11/17 was a major date and should have been a high. Instead the market reversed and made it a low. 11/20-21 again very strong. so a 4 day jump from 17 into 21 is likely. Allmost all crashes come after a lunar square. This is not the same as saying every square will cause a crash.
But if you are waiting for a big decline it is wise to wake up just before a lunar square. Monday we have last quarter. 11/30 the sun will form a hard aspect with the node so we are about to enter a moon wobble period. This could cause some instability.
Thanks andré. Have a great weekend!
http://stockboardasset.com/insights-and-research/double-prepping-collapse-likely-going-occur-2017james-wesley-rawles/
the interview is scary and matches the view of lot here
Thanks Andre’! It is great to see you back with an update!
Peter – will you next chart show be on Wednesday instead of Thursday (Thursday is Thanksgiving)?
Oh, good question. Hadn’t thought of that. I could either do it then or move it to perhaps Sunday. I suspect Wednesday is better. We just has a major turn in currencies yesterday and I don’t expect much to happen otherwise, so I don’t think I’ll have a lot of news.
Let me open it up. I’ll mention it in the video I’m going to do today and see if I can get some feedback.
This weekend will be significant.
The period from 11/17 til 11/21 Is strong. 11/18 was delta timing in the 1966 high and should have been a high. It was a high but the decline was not spectacular. 11/21 is the strongest and that is what Mr Market is waiting for. 11/21 will be delta timing on the 1982 low. This should be a low, unless inverted. Friday Mars entered a new mansion and Venus will do so on Monday. On Tuesday Mercury and on Wednesday the Sun.
11/22 is also strong in daycounting systems. Wednesday we will have a tidal inversion.
As next week will be the first week of a 17 day decline the start will be calm. So I exepect a high on Monday, a low on Tuesday caused by delta and a high again on Wednesday caused by the tidal inversion.
11/25 will be a low. 11/29 will be a high and 12/8 a low. These dates are very strong. Think the 11/29-12/8 swing will be volatile.
Astrologically this weekend is the strongest we will see for a long time. Numerogical cycles point to a low in april 2017. So chances are next weekend will be the start of a multimonth decline.
Cheers,
André
PALS next week:
Phase: increasingly good as week progresses into New Moon (11/29)
Distance: increasingly weak as week progresses into Apogee (11/27)
Declination: weak all week post North Declination
Seasonals: very strong until early December
Summary: mixed PALS. Guessing market sells off this week a bit and moves sideways into end of month.
A new post is live: https://worldcyclesinstitute.com/cromwell-in-the-house-of-the-tudors/
This website is for educational purposes relating to Elliott Wave, natural cycles, and the Quantum Revolution (Great Awakening). I welcome questions or comments about any of these subjects. Due to a heavy schedule, I may not have the time to answer questions that relate to my area of expertise.
I reserve the right to remove any comment that is deemed negative, is unhelpful, or off-topic. Such comments may be removed.
Want to comment? You need to be logged in to comment. You can register here.