
Interview with Dale Pinkert (F.A.C.E.)
Here’s the playback of an interview I did with Dale Pinkert on Thursday, Dec. 6, 2018 at 9:30 am EST. Here’s a page of video playbacks over the past month or so. Here’s the sign-up page.
FACE Interview 6.12.18 Peter says that all recent $DXY waves look corrective in nature.  |
 |
Make sure you zoom the video to full size with frame expander (arrows) in the bottom right hand corner and also set the quality to as high as your web connection allows. This is a high definition (HD) quality video so the best viewing is at that level. |
_______________________________
The Importance of Paying Attention to Sub Waves
Often the market will send subtle signals to tell you what it’s going to do next. If you’re not paying attention to the subwaves (may don’t), you’ll miss big opportunities and run the risk of being incorrect in your analysis. Here’s a good example:
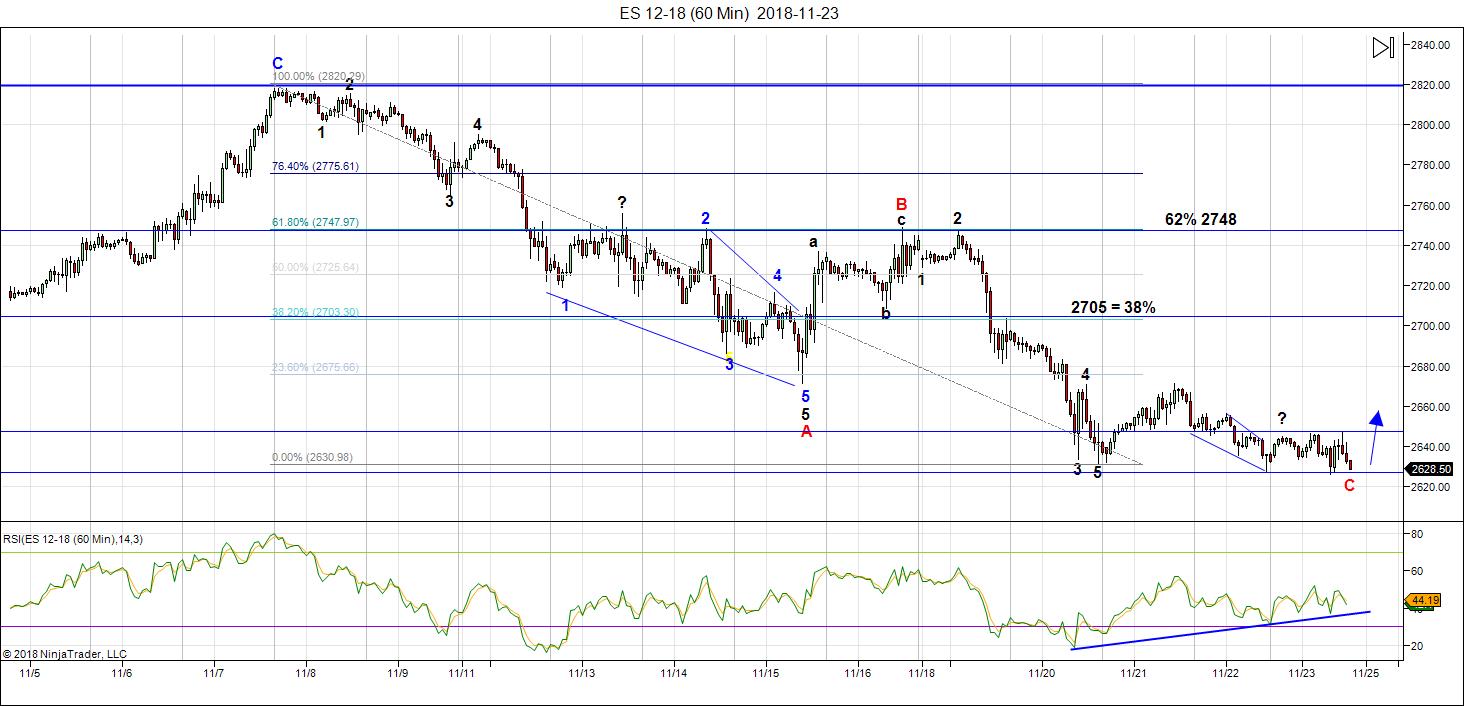 Above is the 60 minute chart of ES from Friday, November 23. 2081, which was the Friday right after US Thanksgiving.
Earlier in the week, we’d traced out what appeared to be a zigzag (a 5-3-5 pattern. ie – five waves down (there was an ending diagonal as part of the first wave), a three wave retrace to the upside, and then another five waves down).
A zigzag suggests a partial retrace will be next up, followed by another pattern (another zigzag or a triangle are the most common corrective patterns in this case).
However, on that Friday, the market dropped to a further new low, creating an additional wave, negating the zigzag pattern and making the entire pattern count as a “three.” I remarked at the time that I wasn’t sure how that was going to affect the overall market, but that we needed to pay attention to it. The SP500 also traced out an additional wave to the downside at the same time.
This pattern was foreshadowing a flat, although we could not have known that at the time. The subtle signals for the flat were as follows:
- The corrective wave down from 2818 was a 3 count.
- It was followed by a wave up, which did not make a new high. That wave was also a 3 count.
- What followed that wave was a 5 waver down to a new low. The entire pattern is a regular flat.
Now, the problem we have is that the wave down from 2818 is in three waves. As such. It needs to be completely retraced in order to “set up” for another pattern to the downside. However, it hasn’t been so far. Even though we’ve had a wave up after this wave, it did not fully retrace. Then we had a wave down in five waves. However, that original wave with the 3-count still needs a retrace back up to the top.
This is the importance of paying attention to subwaves and the count.
The market does the most predicable thing in the most unpredictable manner.
The other red flag in all this is that we have a contracting triangle tracing out in the NQ daily chart. This triangle is obvious and requires one more wave up to complete it (the E wave). Since NQ and ES more more or less together, than means we can expect a large wave up in ES and the SP500.
To summarize, if you’re going to use Elliott Wave to tell you where the market is going you need to:
- pay particular attention to the subwaves, because that’s where the subtle hints are that will affect the market in big way, and
- pay attention to sister indices (in this case, a check of NQ/NDX shows a triangle in progress, which supports the projected rally in ES.
This is where many analysts and EW novices make mistakes. You also need to pay attention to tops and bottoms. Missing a double top by a couple of points usually means you’ll eventually come back to test it.
Attention to detail can mean the difference between a great trade and a frustrating (and surprising) loss.
_________________________
Elliott Wave Basics
There are two types of Elliott wave patterns:
- Motive (or impulsive waves) which are “trend” waves.
- Corrective waves, which are “counter trend” waves.
Motive waves contain five distinct waves that move the market forward in a trend. Counter trend waves are in 3 waves and simply correct the trend.
All these patterns move at what we call multiple degrees of trend (in other words, the market is fractal, meaning there are smaller series of waves that move in the same patterns within the larger patterns). The keys to analyzing Elliott waves is being able to recognize the patterns and the “degree” of trend (or countertrend) that you’re working within.
Impulsive (motive) waves move in very distinct and reliable patterns of five waves. Subwaves of motive waves measure out to specific lengths (fibonacci ratios) very accurately. Motive waves are the easiest waves to trade. You find them in a trending market.
Waves 1, 3, and 5 of a motive wave pattern each contain 5 impulsive subwaves. Waves 2 and 4 are countertrend waves and move in 3 waves.
Countertrend waves move in 3 waves and always retrace to their start eventually. Counrtertrend (corrective waves) are typically in patterns — for example, a triangle, flat, or zigzag. Waves within those patterns can be difficult to predict, but the patterns themselves are very predictable.
Fibonacci ratios run all through the market. They determine the lengths of waves and provide entry and exit points. These measurements are really accurate in trending markets, but more difficult to identify in corrective markets (we’ve been in a corrective market in all the asset classes I cover since 2009).
To use Elliott wave analysis accurately, you must be able to recognize the difference between a trend wave (motive) and a countertrend wave (corrective). There’s very much more to proper Elliott wave analysis, but this gives you the basics.
____________________________
Registration for Commenting
Want to comment? You need to be logged in to comment. You can register here.
If you register, it protects your information. It also allows you to comment without filling in your information each time. Once you’re registered, simply go to the home page and click on the login link top right in order to log yourself in. Usually, you’ll be logged in for several days before needing to be logged in again.
______________________________
Problem receiving blog comment emails? Try whitelisting the address. More info.
______________________________
Rise above the rest … SM 2
Rise above the rest …I have only ever met a few people who, in their chosen fields (astrology, medicine, music, martial arts, technical analysis), rise above all the rest and you are one of them…you have ‘the gift’…and that’s why I’m a Trader’s Gold member. —SM |
Tops in your field DZ 2
Tops in your field …You are tops in your field. Tried to follow Elliot Wave international for years. They were always behind the market. After discovering you, I perceive that you are an expert in reading the waves, which puts you way ahead of the rest of your peers. And you can read the Waves like you are reading tomorrow’s financial section. I pray you stay healthy. —DZ |
the real deal SM 2
The real deal …‘Educational, insightful and thorough market analysis for all levels of traders. It’s Elliott Wave at its best….Peter Temple is the real deal’ —SM |
Couldn’t be happier … KK 2
Couldn’t be happier …The analysis and insight you provide is simply amazing! I’ve been trading the futures and equity markets for well over thirty years and usually average around 5% monthly. Since joining your Traders Gold Service two months ago, that number has better than doubled. I couldn’t be happier.—KK |
Have not had a losing week RW 2
Have not had a losing week …I have been with Peter almost a year. The only thing that matters is have I made money with his service. I think I have finally turned the corner using Peter’s EW. I have not had a losing week in the last 5 months. Thanks Peter, for your amazing amount of hard work. —RW |
A true expert in Elliott Wave FL 2
A true expert in Elliott Wave …You are a true expert in EW analysis. What you provide is not available anywhere and is priceless. Subscription on your services is the best thing I have ever done. Many thanks for your effort to make me a better investor. I now have more trust in my investment decisions. I hope you will continue the excellent work! —FL |
Get an upper hand … JC 2
Get an upper hand in trading …Seeing all the different currency pairs and the wave structures and hearing you explain why this has to do that on a nightly bases gives one a upper hand when trading. Elliott Wave applies to all stock and indices and can be applied to any candlestick chart. If someone ask what you want for Christmas – Tell them a membership to Peter’s “Traders Gold!”—JC |
The best of them JL 2
The best of them …Last couple of years, I subscribed to several ‘market traders’. You are by far the best of them and the personal contact is awesome. Daily and daily updates are very well written! Besides your expertise in EW, I also like your cycles analysis. Best investment I ever made! —JL |
The Market This Week
Here's the latest daily chart of ES (emini futures)
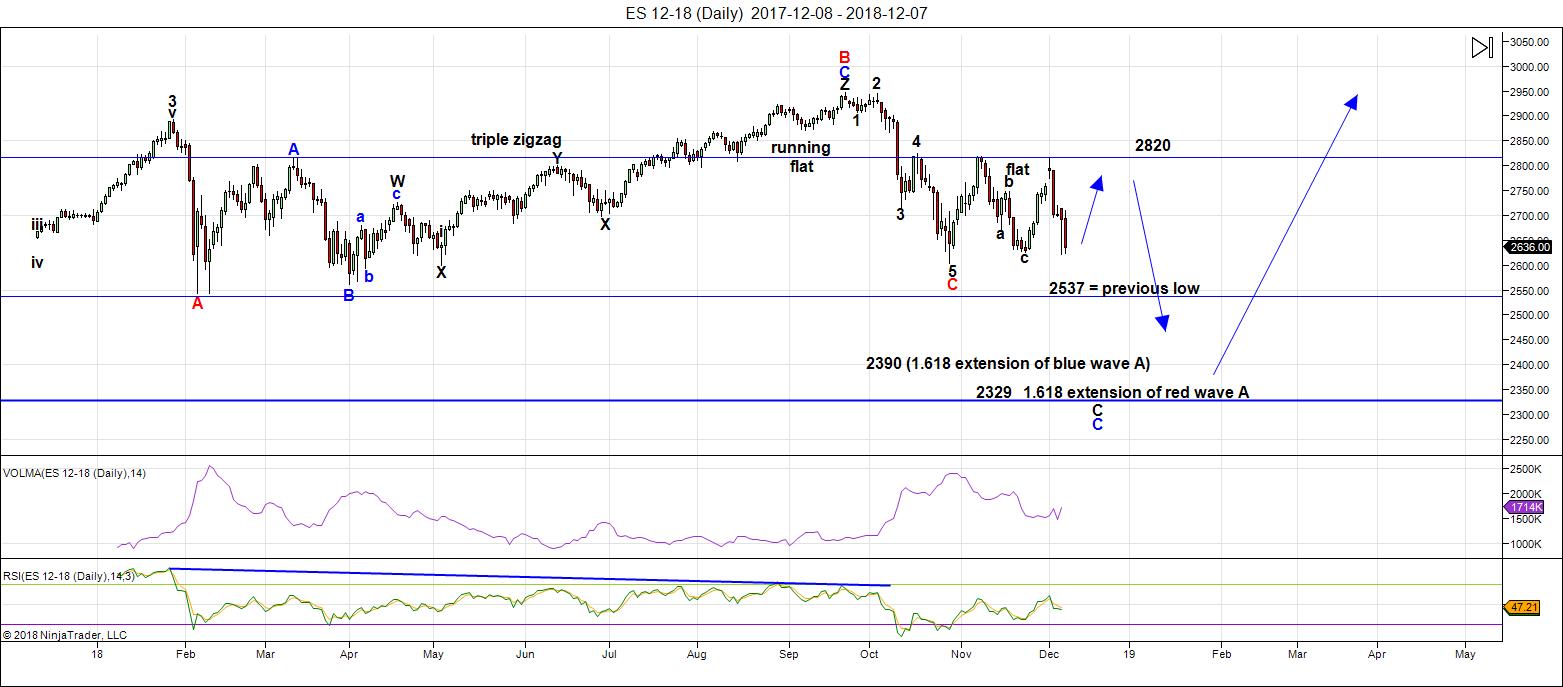
Above is the daily chart of ES (click to enlarge, as with any of my charts).
Last weekend, I was expecting a continuing rally to the previous high at ~ 2818. However, we didn't quite get there, which was a bit of a surprise; we turned down without making a new high, or double top.
That wave down ended up as a five waver, dropping from 2814 to 2620 (a slight new low). It's now obvious that the three wave up-and-down pattern from the high on November 8 is a flat (a 3-3-5 pattern).
On Friday, we experienced a deep drop in ES, although not to a new low (while NQ did drop to a slight new low). These two indices are now out-of-sync, which is rare these days.
The wave down in ES on Friday was corrective, a B wave. I know that because, although it looks like five waves, the third wave is the shortest wave, and that's not allowed in a 5-waver. So, corrective it is.
Up and down and out of control is how the market seemed. It was time to take a step back and figure out what was going on from a big picture perspective. One look at the daily chart of NQ and the situation became obvious. NQ is tracing out a contracting triangle and needs one more wave up (the E wave) to the upper triangle trendline somewhere around 7046).
Meanwhile, since the emini futures are generally moving in lock-step, I expect ES to retrace up to at least the 2710 area and possibly higher. Then we should get a turn down, which should lead to a dramatic new low below 2400.
As I've been saying, these large fourth waves consist of multiple patterns (what we call combination waves). Both ES and NQ developed a large running flat from the drop in January of this year. That was the first pattern.
The second pattern differs in ES and NQ. ES has traced out a flat and NQ has traced out a contracting triangle. Triangles, as part of a combination, are always the final pattern. So, I'd expect a fairly deep fifth wave out of the triangle to a new low in NQ.
In ES, once we test the top of the flat, it's most likely we'll get a zigzag down for a final pattern. This should be a dramatic drop and deliver the fear I've been expecting.
Summary: I'm looking for a rally this weekend to test the 2710 area at least, after a three wave drop on Friday.
Once we have a new high, we're looking for a dramatic drop to an area under 2400 ... at least.
Once we bottom in this large fourth wave, we'll be looking for one more final wave up to a new high. That fifth wave up to a new high will be the end of the 500 year bull market.
___________________________
Trader's Gold Subscribers get a comprehensive view of the market, including hourly (and even smaller timeframes, when appropriate) on a daily basis. They also receive updates through the comments area. I provide only the daily timeframe for the free blog, as a "snapshot" of where the market currently trades and the next move on a weekly basis.
______________________________________
Sign up for: The Chart Show
Next Date: Wednesday, December 12 at 5:00 pm EST (US market time)

The Chart Show is a one hour webinar in which Peter Temple provides the Elliott Wave analysis in real time for the US market, gold, silver, oil, major USD currency pairs, and more. You won't find a more accurate or comprehensive market prediction anywhere for this price.
Get caught up on the market from an Elliott Wave perspective. You’ll also get Andy Pancholi cycle turn dates for the SP500 for the balance of the current month. There’ll be a Q&A session during and at the end of the webinar and the possibility (depending on time) of taking requests.
| "I think you are the only Elliot Wave technician on the planet who knows what he's doing.” |
| m.d. (professional trader) |
All registrants will receive the video playback of the webinar, so even if you miss it, you’ll be sent the full video replay within about an hour of its conclusion.


So SIR PETER..you are expecting a nearly 200 point rise..almost 10% increase..followed by a 400 point drop..almost 20% decline? That doesnt make sense to me..looks like that whole process could take many months. That would be the end of the bull market if that unfolds..
It took 10 market days for ES to drop over 300 points in January. On Friday, we dropped one hundred points in less than a day. All of a sudden, you think it’s going to take months for a drop under 2400, something I’ve been projecting for well over 6 months?
btw, I’m not expecting a full retrace – I hadn’t updated some of the copy from my more in-depth analysis.
No no..I thought i saw it getting back to 2820 which i was thinking with this weak market would take a long time..and it’s so close to a new low..I agree it can hit 2400 soon..that was my preference not a trip back up to 2800 first.
I’ve been fighting the flu all weekend and have been doing my analysis is “spurts.” I just updated the new blog post to reflect some changes I made to my Trader’s Gold post. The target of 2818 in ES has changed to above 2710.
It should be complete now.
Absolutely spot on with all my own indicators. The move back up to test the 2700 pivot area will probably be sharp and overshoot it by a bit, which will also briefly retake some important moving averages. The overshoot will come from what remains remarkably bullish sentiment. Then you have bearish traders like me wating in the wings and licking their chops.
The next wave down is going to be a hummer. I agree it will be completing a big “C” (or three) down, following a small “c” up.
Lock and Load!
Bravo Mr Verne. You nailed it..imma gonna load up on some spy and qqq puts and vix calls once it gets back to 2700.
Charles/Verne,
If you are loading up on options how far are you going are you guys buying dec 21 or jan 18 expiry. I am planning put spread as puts are very expensive.
Also there is a gap at 2720, i think we reach there by friday and then move down.
My indicators were almost perfect last week http://www.prognoseus500.nl/
Fore this week Monday UP untill open EU markets or US markets, then a decline into Thursday. Then up into the weekend
Futures suggesting we may not get a better short entry after all.
I was still holding about a 10% short position and will be adding to positions and adding to long vol at the open. Already in ES on the gap down and so far so good.
Santa just might be delayed this year it would appear!
The who ( 1971 )
Won’t get fooled again
We’ll be fightin’ in the streets with our children at our feet
And the morals that they worship will be gone
And the men who spurred us on, sit in judgment of all wrong
They decide and the shotgun sings the song
I’ll tip my hat to the new constitution, take a bow for the new revolution
Smile and grin at the change all around, pick up my guitar and play
Just like yesterday then I’ll get on my knees and pray
We don’t get fooled again, don’t get fooled again
The change, it had to come, we knew it all along
We were liberated from the fold, that’s all
And the world looks just the same and history ain’t changed
‘Cause the banners, they are flown in the next war
I’ll tip my hat to the new constitution, take a bow for the new revolution
Smile and grin at the change all around, pick up my guitar and play
Just like yesterday then I’ll get on my knees and pray
We don’t get fooled again, don’t get fooled again, no, no, no
I’ll move myself and my family aside
If we happen to be left half alive
Get all my papers and smile at the sky
Though I know that the hypnotized never lie, do ya?
There’s nothin’ in the streets, looks any different to me
And the slogans are replaced by the bye
And the partin’ on the left is now partin’ on the right
And the beards have all grown longer overnight
I’ll tip my hat to the new constitution, take a bow for the new revolution
Smile and grin at the change all around, pick up my guitar and play
Just like yesterday then I’ll get on my knees and pray
We don’t get fooled again, don’t get fooled again, no, no, no, no, no
Don’t get fooled again
Yeah, meet the new boss, same as the old boss
RI.P., “The Ox”, Mr. John Entwhistle!
10 and 50 ema officially crossed weekly…with stock rsi..below .2…
only 2001,2008,2015,2016 did we see that..
Covered 1/2 of the 1/4
Down to just 1/8 or 1contract short .
Will hold till year end .
No other market comments till mid Dec
on spx
Rooting for Peter T 2700 call…. Sir let us know if changed
Price action today right on schedule. We should move up smartly to tap the 2700 pivot area and then, THE BIG KAHUNA…!!!!
ALL ABOARD!!!! lol!
My move today was a gut move in my part.
Glad I left myself less short .
To be honest I was lucky
Educated lucky but lucky
I’ll be happy when today is over with not to mention
This month.
Not a fun morning !
2 empty barges in tow.
TUE
S to SW wind 20 to 25 kt, with gusts to 40 kt. Combined
seas near 14 ft, with a dominant period of 11 seconds.210-111215-
Columbia River Bar-
721 PM PST Mon Dec 10 2018
…SMALL CRAFT ADVISORY FOR ROUGH COLUMBIA RIVER BAR IN EFFECT
THROUGH TUESDAY AFTERNOON…
IN THE MAIN CHANNEL
– GENERAL SEAS…9 to 10 feet Monday night and Tuesday.
– FIRST EBB…Around 630 PM Monday. Seas building to 13 feet
with breakers possible.
– SECOND EBB…Around 715 AM Tuesday. Seas building to 12 feet.
Wow. Wouldn’t want to be out in that!…
Yikes..does not sound like fun at all ..
looking for some help, anyone else here work with Harmonic Patterns?
The one that is bothering me..is NDX
Starting in 2000 as your X.., A2003, B2007,C2009 and D2018,
You get a crazy long bear crab..with exactly 1.618 from X to D,!!!!
the only problem with it is B to D leg is 5x…which is way more than it should be
it just looks so menacing and if true…we could end up back at 1500.. I am not a pro at those..but didn’t know if someone else could look at it too.would be much appreciated
and a new higher high on uup today
again..1500 over many years
Yikes!! Batten down the hatches!
Exhaustion gap….
Boy are the banksters busy! Looks like they want to tag that 2700 pivot after all!
Marie
Not sure this will answer your question yet when I look at the nasdaq
Composite , 1974 to 2000 was 26 years , year 2002 to 2018 is 16 years
16/26= .615 not a perfect fib yet time wise it’s interesting .
Also the nasdaq comp looks Luke a fairly large head and shoulder top .
I’d assume ( a dangerous thing to do ) it’s now forming its neck line .
if that holds true then I’d expect it to stall near The 7505-7637 range once
We get the bounce . To soon to call that yet …. The measured move down should be equal
To the same point move from the left side neck to the top once the neck breaks
You measure from the neck that same point move down.
Nasdaq comp 6630-8133=Or about 2200 points , that targets the low 4,000’s
So I’d say a 50% drop from the highs is do able . That of course is a ways off
And many times head and shoulders top formations fail and send prices about the same
Amount to the upside . The key to me 7505-7637 on nasdaq comp .
I am bullish for next year yet bearish into January . I’m not sold on direction but
Next year is coming so just throwing it out there .
Out of the ocean and glad to be .
Hope it helps even if I didn’t address your question .
Tough to get detailed using my phone
Bad math , 1500)points down from neck equals 5130 ish as an initial target
Below there it’s the 1.618 times 1500 or 2427 points down which targets
4203.
A 50% drop not a bad initial target on any market .if it’s a true top
I hedged my short trades today with some near term calls. Also took some downside profits at today’s lows.
Not seeing the kind of downside relentless decline I would have expected for a C wave under way so we could be looking at a big ABC upward move for a 2 of C.
If we break today’s low tomorrow I will add to short trades. If we head towards 2700 over night I will trade ES up and cash in hedges at the the cash session if we get a reversal with VIX confirmation. Market at a very dicey juncture and I think we are going to see a big move one way or the other.
Never a dull moment.
Britain’s Prime Minister Theresa May will face a vote in Parliament later Wednesday that could determine whether she will be ousted from power.
——
Unhedged and unaffraid
My main requirement was this week must be a down week
Or I would exit my shorts . With 1 contract remaining and several 1000
Dow points banked I can handle pain yet at this point I’m not at a loss.
A reversal to the upside this week forces me out .
That was my condition .
enjoy your weekend everyone ( I know it’s Wednesday )
Thursday and Friday is more Britain and European flatter lather .
Joe your nasdaq comment was appreciated thank you
nail biting ending diagonal….spx get ready
https://www.armstrongeconomics.com/world-news/banking-crisis/deutsche-bank-to-merge-with-commerce-bank/
Deutsche Bank is in crisis and everyone has known that. It derivative book is hard to quantify what is the real net bottom line. The only bank it could have been merged with was BNP but that was French and they cannot allow cross-border capital flows in bailouts. That left Commerce Bank, but they too have a lot of the same problems.
The two will be merged WITH government assistance covered up. As I have warned, Deutsche Bank is the biggest bank in Europe. I failed to see how Germany could allow it to collapse, Hence, this merger has to be accomplished with government aid – the very thing they tell Italy they cannot do. This is showing what we pointed out – Merkel had to blink.
Thank you for the show..Peter
Marie … you’re welcome, of course.
I went to his conference..Deutsche is the one to watch…then everything will fall like dominos
ES and NQ waves are now “muddy.” If we reach a new high then we should continue up. The waves up on a 5 minute chart still look corrective to me but there’s an argument for the other side, as well. If we only retrace 62%, that would be a good signal that we’ve bottomed.
62% ES is 2655 NQ is 6790 (of the current small wave up from 6764. We’re looking a small moves here. The bigger picture is a rise to our upside targets still.
No amount of mergers is going to forestall the derivatives cataclysm. The banks holding them on their books (or off ) are ALL technically insolvent and no one can bail them out this time. Governments are broke as well!
Fill gap up and strong up at the end?
Awesome trades this week!
Great big SPY bear call spreads, DIA puts, SPY puts, VXX bull put spreads, VIX bull put spreads, VXX calls, UVXY calls, IWM puts, TZA calls. Out of most trades today except for a few remaining bull call spreads expiring Monday. Wave pattern looks to me like the first of a third down almost complete with a 62% small 2 up of 3 down on deck for the start of next week, and then the sweet spot of the move down to Peter’s targets. I think this move will be done the next ten days, just in time for the long-expected Santa Rally. Have a great week-end all!
Just brainstorming.
The new moon on dec 6 ties to the puetz cycle .
My view of this ( observations ) are you must see
a decline from the new moon 1 month prior to the solar eclipse
into that solar eclipse ( its the little things ) . using a weekly chart we had a low of sorts which to me is an important weekly close .
Adding to this we had mercury go direct last week yet the 10 day lag runs into dec 16 which can be but not always a panicky type low even on a short term time frame. dding again to this was the mars Uranus cycle which is very common to see panicky type market action . This mars Uranus cycle points to an important low on jan 4th which is 2 days before the solar eclipse . This places the market set up for a panic decline . Think Paris, the EU , Britain etc……. That’s the news yet
these 3 cycles are all into there final panicky phase at the same time .
The Puetz cycle would call for a low near the solar eclipse and a rally into the lunar eclipse followed by a crash low surrounding the 6 wk period following the solar eclipse , 6 days before to 3 days after the full moon surrounding that date .
The question that will come later : the feb 15th-18th time frame . Will that be a higher low suggested by the mars Uranus cycle turning up beginning Jan 4 ?
Or do we just see bullish divergences develop which begins jan 4 ? and the real Buy point Being the feb 15th time frame ( bottom of the panic or bottom of the secondary higher low ? )
That’s my thesis .
what follows is research.
simple math in a panic :
Cash Dow :
23679.62 must not be broken on a closing basis . Even going below
there by ticks is a signal that a panic phase has begun . This is based
on the studies done on these cycles and in these phases of their respective patterns .
There is more room to the downside based on the weekly and monthly not to mention the daily oscillators. add to this the 10 trin is not into an over sold reading . The 5 day trin has shown buying action so maybe that will prove to be a bit of noise .
The NYA should be watched as it closed the week just above where waves A and C are equal . 11755.38 close and C equals A at 11732.47 . This level was broken
this past month .
from every panic I have studied there is one common mathematical calculation
that always seems to show up .
Based on all of the above we must conclude that if we see more declines then based on timing and the ” news ” we are in the perfect time frame for a panic to happen .
The proof is in the pudding , An extreme move can happen and there is room left for more downside based on the indicators I use .
This week closing down on the week gives a slight confirmation that a panicky move down is in its early phase and will get stronger as we head into jan 4-6th .
The 1.00 extension of price is the key as is the 1.618 but what if those levels break ? look at any panic and see what you see . those levels getting broken are a
REQUIREMENT !
Nest week is important , part of this cycle includes a full moon high but its more of a sluggish pause , it aint that bullish despite what you think. so far the market has been doing what it is expected to do if we are going into a panic phase .
No Bounce , No Christmas rally , Just down down down in what ever fashion it chooses .
The 10 day lag on mercury would argue for a bounce up on Monday yet it hits on Sunday so not expecting much of an effect , yet it is a change .
Now ill do my research on dig into the indicators I use .
Enjoy your weekend and that wraps up my mid dec market thoughts .
Timing can be helpful : ))
I am still really bewildered by the absence of any kind of capitulation selling, accompanied by the typical volatility spike. In fact, we are now seeing positive divergences at these lows. I have learned the hard way to never trade what I expect, but rather what I see. It could be any upward bounce will be countertrend ahead of a steeper decline.
A new weekend blog post is live at: https://worldcyclesinstitute.com/caution-to-bears/
This website is for educational purposes relating to Elliott Wave, natural cycles, and the Quantum Revolution (Great Awakening). I welcome questions or comments about any of these subjects. Due to a heavy schedule, I may not have the time to answer questions that relate to my area of expertise.
I reserve the right to remove any comment that is deemed negative, is unhelpful, or off-topic. Such comments may be removed.
Want to comment? You need to be logged in to comment. You can register here.