
 A Pending Top is Waves Away
We’re now into the relatively small moves of a final topping process. The US indices have continued to be difficult to predict with any certainty, although it’s been obvious a triangle pattern of some sort is in the works.
I’ve warned that I’ve been early in predicting the ending diagonal, but even so, there were only two options left — a triangle of some sort, or diagonal.
Mid-week, it became clear that even though SPY had reached a new high (suggesting the ending diagonal was in play), the major US sub-indices had failed to do so. On Wednesday, (after a few days of uncertainty) a larger drop became more probable, and Wednesday night, predicted a final drop after a “terminal” fourth wave barrier triangle set up overnight. The ending diagonal had failed.
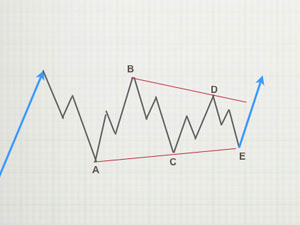
As a result, we’re now in the confirmation stage of a fourth wave contracting triangle. These patterns aren’t typically confirmed until the D leg is in place; however, we’re out of other options. I suspect we’ll have that wave in place by the end of the next week (Sunday, October 13th is a full moon and might be the turning point for the top of the D leg).
In any event, the waves are small enough now that we can consider this market a day trader’s market. I’d caution against staying long overnight in rallies; however, turn downs are more likely to be safer overnight. Any surprises are likely to be to the downside (as there’s an underlying weakness in the US indices).
Virtually all asset classes and their components are in their final wave patterns. It’s only USDCAD that needs to turn in currency pairs … and we may be waiting for a final bottom in oil (and also in the Russell 2000). As I’ve been saying for over three years now, all major asset classes will get more closely aligned and eventually move as one as they work themselves to a final top.
The Hunt for Red October
The end of October is rife with major events.
- Wednesday, October 30 is the next Federal Reserve announcement.
- Thursday, October 31 is the current Brexit deadline, although the UK government may ask for yet another delay to the beginning of January.
- November 1 is the next US Labor Report.
We’re looking ahead for a possible “trigger event.” The market will turn on schedule when the final pattern (a contracting triangle is complete). However, it’s usually accompanied by a major event sometime around that top.
Based upon the projection of a very large fourth wave drop in the SP500 to an area below 2100 suggests to me we’re going to see the demise of an European bank, perhaps Deutsche Bank. (there are other possible contenders out there, but this would be the biggest financially destructive potential catalyst).
_________________________________
Elliott Wave Basics
Here is a page dedicated to a relatively basic description of the Elliott Wave Principle. You’ll also find a link to the book by Bob Prechter and A. J. Frost.
______________________________
Couldn’t be happier … KK 2
Couldn’t be happier …The analysis and insight you provide is simply amazing! I’ve been trading the futures and equity markets for well over thirty years and usually average around 5% monthly. Since joining your Traders Gold Service two months ago, that number has better than doubled. I couldn’t be happier.—KK |
Tops in your field DZ 2
Tops in your field …You are tops in your field. Tried to follow Elliot Wave international for years. They were always behind the market. After discovering you, I perceive that you are an expert in reading the waves, which puts you way ahead of the rest of your peers. And you can read the Waves like you are reading tomorrow’s financial section. I pray you stay healthy. —DZ |
Get an upper hand … JC 2
Get an upper hand in trading …Seeing all the different currency pairs and the wave structures and hearing you explain why this has to do that on a nightly bases gives one a upper hand when trading. Elliott Wave applies to all stock and indices and can be applied to any candlestick chart. If someone ask what you want for Christmas – Tell them a membership to Peter’s “Traders Gold!”—JC |
The best of them JL 2
The best of them …Last couple of years, I subscribed to several ‘market traders’. You are by far the best of them and the personal contact is awesome. Daily and daily updates are very well written! Besides your expertise in EW, I also like your cycles analysis. Best investment I ever made! —JL |
Have not had a losing week RW 2
Have not had a losing week …I have been with Peter almost a year. The only thing that matters is have I made money with his service. I think I have finally turned the corner using Peter’s EW. I have not had a losing week in the last 5 months. Thanks Peter, for your amazing amount of hard work. —RW |
A true expert in Elliott Wave FL 2
A true expert in Elliott Wave …You are a true expert in EW analysis. What you provide is not available anywhere and is priceless. Subscription on your services is the best thing I have ever done. Many thanks for your effort to make me a better investor. I now have more trust in my investment decisions. I hope you will continue the excellent work! —FL |
Rise above the rest … SM 2
Rise above the rest …I have only ever met a few people who, in their chosen fields (astrology, medicine, music, martial arts, technical analysis), rise above all the rest and you are one of them…you have ‘the gift’…and that’s why I’m a Trader’s Gold member. —SM |
the real deal SM 2
The real deal …‘Educational, insightful and thorough market analysis for all levels of traders. It’s Elliott Wave at its best….Peter Temple is the real deal’ —SM |
US Market Snapshot (based on end-of-week wave structure)
This chart is posted to provide a prediction of future market direction. DO NOT trade based upon the information presented here (certainly NOT from a daily chart).
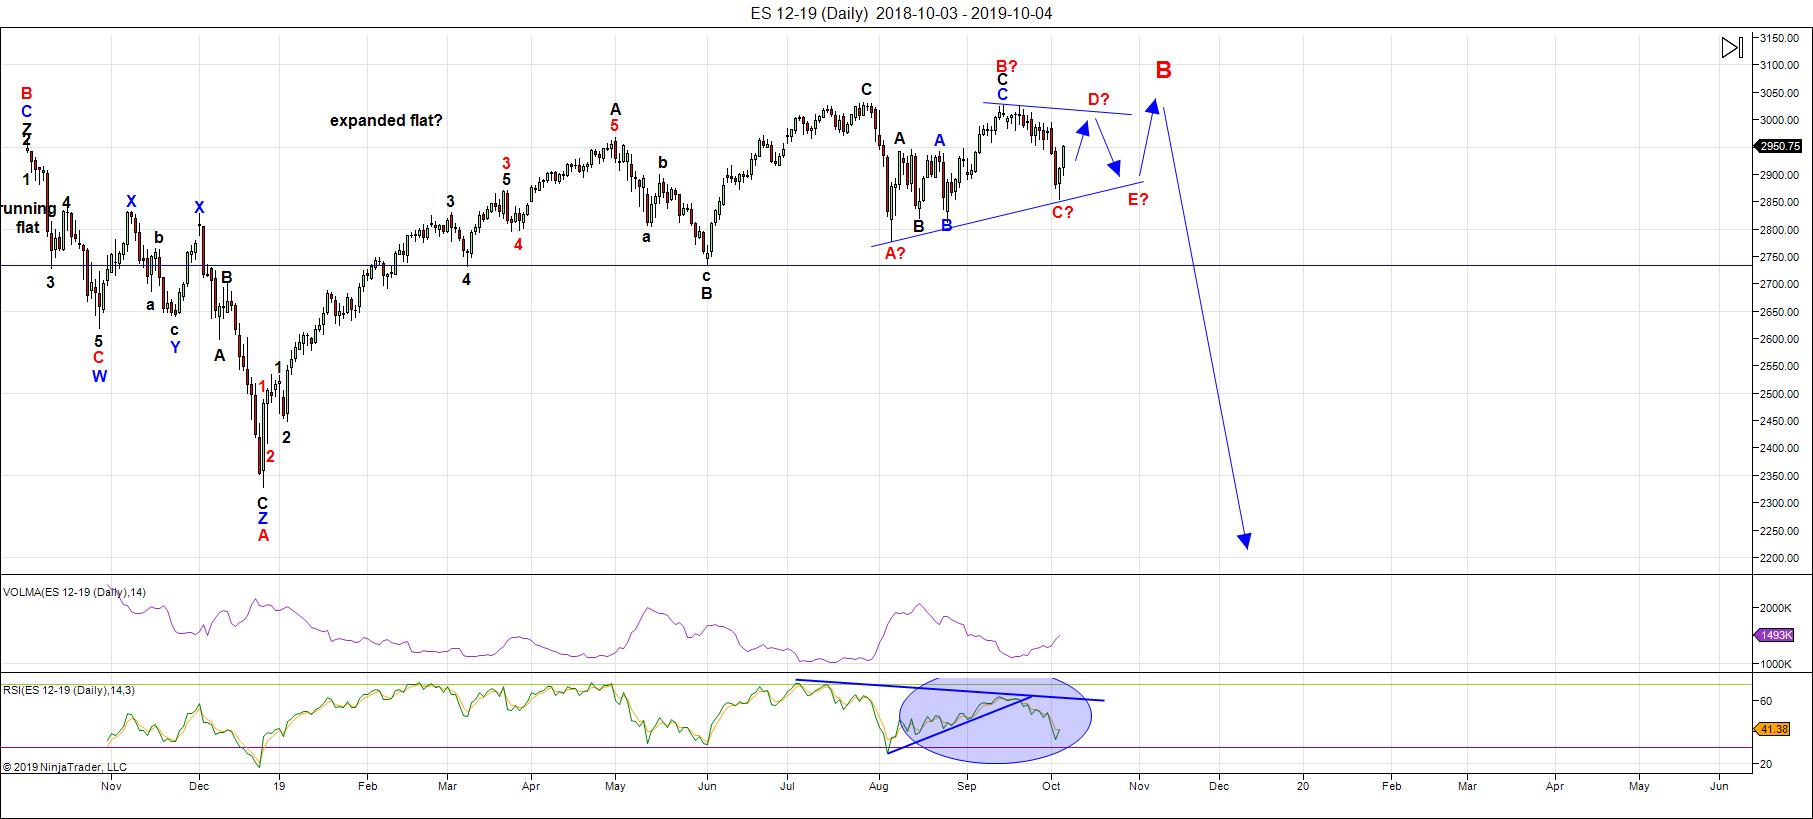
Above is the daily chart of ES (click to enlarge, as with any of my charts).
About mid-week this week, it became obvious that the pattern we've been following was morphing from an ending diagonal to a contracting triangle. That isn't a big change, but on hourly charts, for trading, it changes expectations for entries and exits.
It also prolongs the up and down action, providing in effect, two additional up and down legs. I put us currently in the D leg rally of this triangle, looking forward to an E leg down to follow, and then a final fifth wave up to a new high to end the pattern and the entire corrective rally up from December 26, 2018.
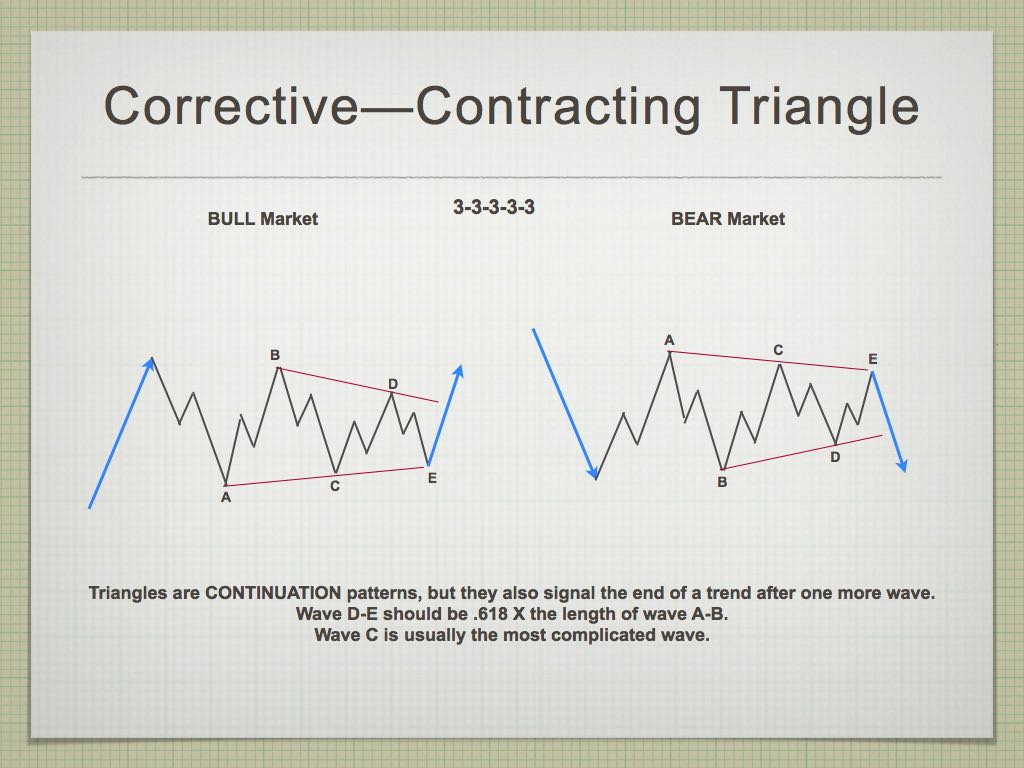
The differences between an ending diagonal and a fourth wave triangle could be considered subtle, but are important for trading:
- EDs don't respect fibonacci measurements, yet triangles do.
- EDs contain 5 waves in ABC patterns throughout; triangles have a final fifth wave (in this case) to a new high that will be in 5 subwaves.
- EDs have a maximum allowable length for the 5th wave, triangles don't (the final wave up could travel up above the 2040 level that I was considering a maximum level for the ending diagonal fifth wave.
Fourth wave triangles signal that there is one more operative wave (the fifth wave) before a trend change. Ending diagonals are themselves the final pattern before a trend change.
This weekend, the 14 day RSI indicator continues to deteriorate, as it should for the final pattern.
The slope of the lower trendline is set now; the slope of the upper trendline will be determined by the top of the D leg now in progress.
After the fifth wave up to new all time high is complete. ES will head down to a new low below 2100.
Longer term in ES, I'm expecting the C wave of a an expanded flat to the downside. In that case, a first wave should drop to the 2725-30 area (previous fourth of one lesser degree) and then bounce in a second wave to the 2875 area (62% retrace), before a third wave down to about 2250. After that, a fourth and fifth wave down to under 2100 will round out the drop.
There is an option of a set of zigzags down to the same level, but it's less probable because there are so many flats set up across multiple stocks and indices. If a zigzag is the pattern that traces out, the retraces up will not be as strong as they would be with the C wave of a flat. We'll get a lot of information about the probable path from the first wave down.
The coming drop will be a world-wide phenomenon across all most all sectors. It will last the balance of the summer months and most likely culminate in a low and final round of QE.
As I've said since the low on Dec. 26, the waves up are corrective in the NYSE-related indices, and as a result, will completely retrace. Expect an imminent top and a major move to a new low under 2100.
Summary: The most probable pattern tracing out at the top of this large corrective wave up from Jan. 26, 2018 is a contracting triangle. If so, after a final 5th wave high, the trend up will end, setting up for a devastating drop.
The larger degree pattern appears to be a flat (3-3-5 wave structures), which predicts a five wave dramatic drop to a new low below the A wave bottom at about 2300. The larger pattern in ES is a record-breaking broadening top (not an EW pattern).
I expect the ultimate bottom will be somewhere under 2100.
Once we've completed the fourth wave down, we'll have a long climb to a final slight new high in a fifth wave of this 500 year cycle top.
___________________________
Trader's Gold Subscribers get a comprehensive view of the market, including hourly (and even smaller timeframes, when appropriate) on a daily basis. They also receive updates through the comments area. I provide only the daily timeframe for the free blog, as a "snapshot" of where the market currently trades and the next move on a weekly basis.
I do a nightly video on the US indices, USD Index (and related currency pairs), gold, silver, and oil).
______________________________________
Sign up for: The Chart Show
Next Date: Wednesday, October 9 at 5:00 pm EST (US market time)

The Chart Show is a one hour webinar in which Peter Temple provides the Elliott Wave analysis in real time for the US market, gold, silver, oil, major USD currency pairs, and more. You won't find a more accurate or comprehensive market prediction anywhere for this price.
Get caught up on the market from an Elliott Wave perspective. There’ll be a Q&A session during and at the end of the webinar and the possibility (depending on time) of taking requests.
For more information and to sign up, click here.
| "I think you are the only Elliot Wave technician on the planet who knows what he's doing.” |
| m.d. (professional trader) |
All registrants will receive the video playback of the webinar, so even if you miss it, you’ll be sent the full video replay within about an hour of its conclusion.


