

Time is marching on, and so is the market, but we still have a top to get in place. It’s a tedious topping process, but nothing much has changed this week. The turn up on Friday afternoon should take us to a new high.
Meanwhile ….
Mood is Turning Negative
I cringe these days at the hysteria of the herd (and main stream media, who are fueling the fire) with the marches and strikes and emotional tyrades. So much ignorance!
But, that’s typical of major cycle tops, and we’re certainly at one. In fact, with US indices, we’re at the top of the strongest wave, the third wave, and I expect that the current level of mania may be nearing a climax. That’s because the eventual fifth wave (projected for the end of 2020) is not as strong and, in terms of the stock market, that’s because not as many stocks participate in the final march to the top. That may say something about the level of emotion that will be exhibited by the climate “cult.” It may start to subside.
 Meanwhile, we have a 16 year-old girl with aspergers syndrome leading the charge! What she could possible know about the history or science of climate is certainly beyond the scope of my imagination.
In any event, it should be obvious now that the mood of the herd is turning quite negative. As I said, we’re nearing a major market top and that’s to be expected. The warm-wet phase of the 500 year cycle is coming to an end and we’re transitioning into the cold-dry phase. This is the reason for the extreme weather we’ve been experiencing over the past decade. I’ve just published an article that provides an “Introduction to Climate Cycles.”

Dr. Wheeler and “The Big Book”
Here’s how Dr. Wheeler, who headed up the largest climate study in history, summed it up:
“As the warm-wet phaze terminates, climate becomes drier and hotter. As it does, other phenomena manifest themselves: creativity declines; reaction and decadence set in; governments become despotic; minorities are persecuted; general health declines along with the birthrate; economic systems collapse; socialistic and communistic regimes rise under an epidemic of dictators; individual freedoms vanish; and the moral tone of society reaches a low level. Toward the end of this comes another series of wars we call nation-falling wars, because many of the governments initiating them during this period are either tottering or about to collapse internally. These particularly savage conflicts occur on a falling temperature and a rising rainfall curve.” — Dr. Raymond H. Wheeler, Ph.d, Climate — The Key to Understanding Business Cycles.
The nation-falling wars are typically just skirmishes; the trend is starting to turn towards civil wars and we’re starting to see the civil unrest take hold in countries around the world.
As I mentioned, this third wave top that we’re currently experiencing is the strongest of the waves. Therefore, it tends to persist for what seems forever. However, when it reaches the top (very soon), we’ll start to see dramatic market drops, culminating in at least a 1,000 point drop in the SP500 (the fourth wave we’re expecting). We’re getting very close and the herd is becoming more and more emotional and aggressive, as they always have throughout history at similar cycle tops.
_________________________________
Elliott Wave Basics
Here is a page dedicated to a relatively basic description of the Elliott Wave Principle. You’ll also find a link to the book by Bob Prechter and A. J. Frost.
______________________________
Get an upper hand … JC 2
Get an upper hand in trading …Seeing all the different currency pairs and the wave structures and hearing you explain why this has to do that on a nightly bases gives one a upper hand when trading. Elliott Wave applies to all stock and indices and can be applied to any candlestick chart. If someone ask what you want for Christmas – Tell them a membership to Peter’s “Traders Gold!”—JC |
Rise above the rest … SM 2
Rise above the rest …I have only ever met a few people who, in their chosen fields (astrology, medicine, music, martial arts, technical analysis), rise above all the rest and you are one of them…you have ‘the gift’…and that’s why I’m a Trader’s Gold member. —SM |
Couldn’t be happier … KK 2
Couldn’t be happier …The analysis and insight you provide is simply amazing! I’ve been trading the futures and equity markets for well over thirty years and usually average around 5% monthly. Since joining your Traders Gold Service two months ago, that number has better than doubled. I couldn’t be happier.—KK |
Have not had a losing week RW 2
Have not had a losing week …I have been with Peter almost a year. The only thing that matters is have I made money with his service. I think I have finally turned the corner using Peter’s EW. I have not had a losing week in the last 5 months. Thanks Peter, for your amazing amount of hard work. —RW |
Tops in your field DZ 2
Tops in your field …You are tops in your field. Tried to follow Elliot Wave international for years. They were always behind the market. After discovering you, I perceive that you are an expert in reading the waves, which puts you way ahead of the rest of your peers. And you can read the Waves like you are reading tomorrow’s financial section. I pray you stay healthy. —DZ |
The best of them JL 2
The best of them …Last couple of years, I subscribed to several ‘market traders’. You are by far the best of them and the personal contact is awesome. Daily and daily updates are very well written! Besides your expertise in EW, I also like your cycles analysis. Best investment I ever made! —JL |
A true expert in Elliott Wave FL 2
A true expert in Elliott Wave …You are a true expert in EW analysis. What you provide is not available anywhere and is priceless. Subscription on your services is the best thing I have ever done. Many thanks for your effort to make me a better investor. I now have more trust in my investment decisions. I hope you will continue the excellent work! —FL |
the real deal SM 2
The real deal …‘Educational, insightful and thorough market analysis for all levels of traders. It’s Elliott Wave at its best….Peter Temple is the real deal’ —SM |
US Market Snapshot (based on end-of-week wave structure)
This chart is posted to provide a prediction of future market direction. DO NOT trade based upon the information presented here (certainly NOT from a daily chart).
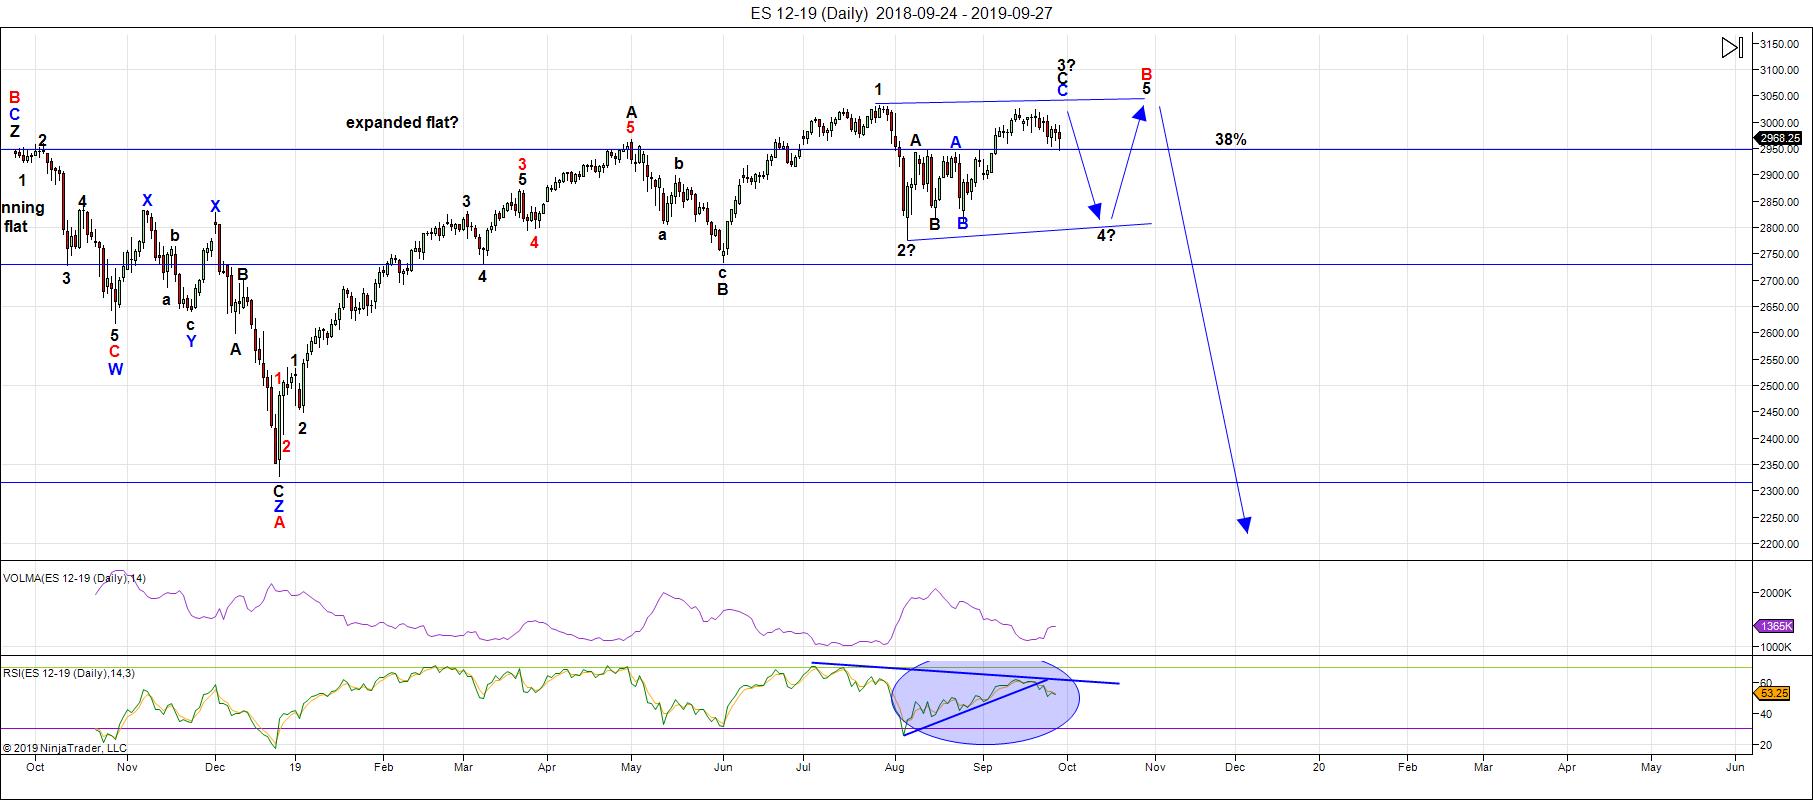
Above is the daily chart of ES (click to enlarge, as with any of my charts).
Friday marked the eleventh day of weakness, with continued failed attempts to mount a final rally to a new high. Near the end of the day, we'd reached the 38% retrace level of the zigzags up from 2812. This level is a typical level for a fourth wave bounce and late in the day, we got one. The direction now should be up to a new high in a final of three zigzags.
Third waves of ending diagonals have a habit of hanging around near the top before finally topping and dropping into a large, fourth wave. That said, this particular third wave topping procedure is more frustrating than usual. It's a weak market, with extremely low volume, and news tends to have a greater than normal affect on it.
Last weekend, RSI was showing good support for a continuing rally. This weekend, it's not, and in fact, I'd expect RSI divergence to continue during what I expect will be a final zigzag to a new high. RSI divergence typically accompanies final, fifth waves.
I put us near the top of the third wave of an ending diagonal. We need to get to a new high before turning back down in the fourth wave, which I expect to descend about 200 points to the lower trendline.
The slope of the lower trendline is determined by the bottom of the fourth wave. There's a restriction here, as well, in that the upper and lower trendlines cannot diverge. They usually get close to being parallel, but if they diverge, then the ending diagonal breaks and I would expect us to descend further in that case.
After the fourth wave is complete, there is one more wave up to a new high to complete the ending diagonal.
Longer term in ES, I'm expecting the C wave of a an expanded flat to the downside. In that case, a first wave should drop to the 2725-30 area (previous fourth of one lesser degree) and then bounce in a second wave to the 2875 area (62% retrace), before a third wave down to about 2250. After that, a fourth and fifth wave down to under 2100 will round out the drop.
There is an option of a set of zigzags down to the same level, but it's less probable because there are so many flats set up across multiple stocks and indices. If a zigzag is the pattern that traces out, the retraces up will not be as strong as they would be with the C wave of a flat. We'll get a lot of information about the probable path from the first wave down.
The coming drop will be a world-wide phenomenon across all most all sectors. It will last the balance of the summer months and most likely culminate in a low and final round of QE.
As I've said since the low on Dec. 26, the waves up are corrective in the NYSE-related indices, and as a result, will completely retrace. Expect an imminent top and a major move to a new low under 2100.
Summary: The most probable pattern tracing out at the top of this large corrective wave up from Jan. 26 is an ending diagonal. if so, after 5 mostly sideways waves, it will culminate in a minimal new high, setting up for a devastating drop.
The larger degree pattern appears to be a flat (3-3-5 wave structures), which predicts a five wave dramatic drop to a new low below the A wave bottom at about 2300. The larger pattern in ES is a record-breaking broadening top (not an EW pattern).
I expect the ultimate bottom will be somewhere under 2100.
Once we've completed the fourth wave down, we'll have a long climb to a final slight new high in a fifth wave of this 500 year cycle top.
___________________________
Trader's Gold Subscribers get a comprehensive view of the market, including hourly (and even smaller timeframes, when appropriate) on a daily basis. They also receive updates through the comments area. I provide only the daily timeframe for the free blog, as a "snapshot" of where the market currently trades and the next move on a weekly basis.
I do a nightly video on the US indices, USD Index (and related currency pairs), gold, silver, and oil).
______________________________________
Sign up for: The Chart Show
Next Date: Wednesday, October 16 at 5:00 pm EST (US market time)

The Chart Show is a one hour webinar in which Peter Temple provides the Elliott Wave analysis in real time for the US market, gold, silver, oil, major USD currency pairs, and more. You won't find a more accurate or comprehensive market prediction anywhere for this price.
Get caught up on the market from an Elliott Wave perspective. There’ll be a Q&A session during and at the end of the webinar and the possibility (depending on time) of taking requests.
For more information and to sign up, click here.
| "I think you are the only Elliot Wave technician on the planet who knows what he's doing.” |
| m.d. (professional trader) |
All registrants will receive the video playback of the webinar, so even if you miss it, you’ll be sent the full video replay within about an hour of its conclusion.


