
Update: Friday, April 1, 2:40PM EST
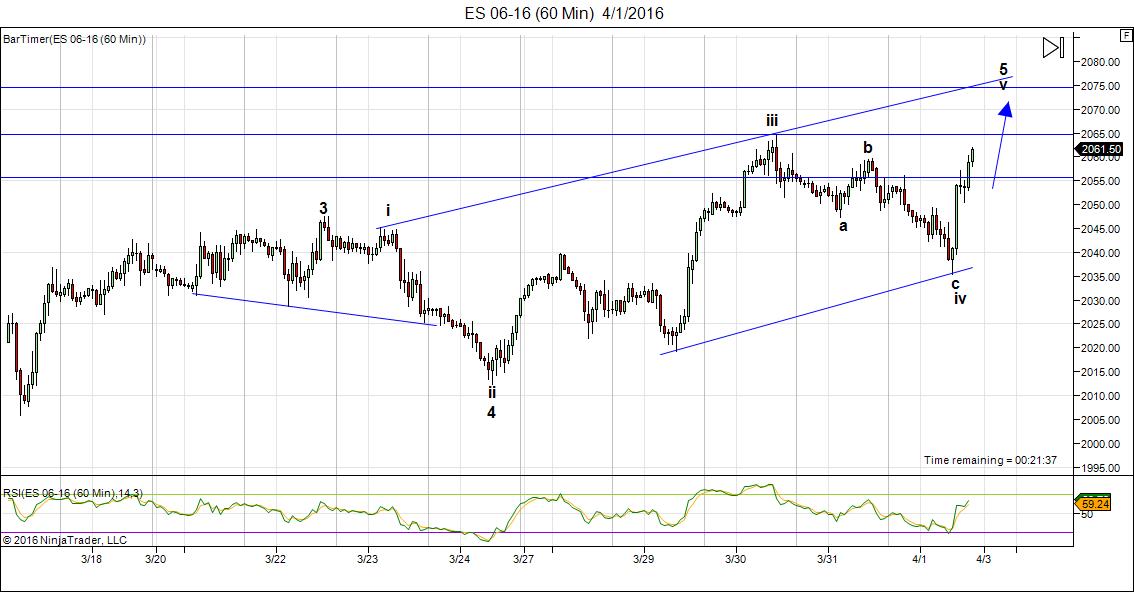
Above is the 60 minute chart of ES showing the progression of the ending diagonal. We’re in the final wave. Ending diagonals typically have a throw-over (they exceed the top of the upper trendline) but don’t have any way of reliably identifying a final target.
In this case, we can break down the final wave up into A, B, and C waves and project the end based upon the length of the A wave. A C wave of 1 X the A wave would give an ES target of 2086.
_______________________
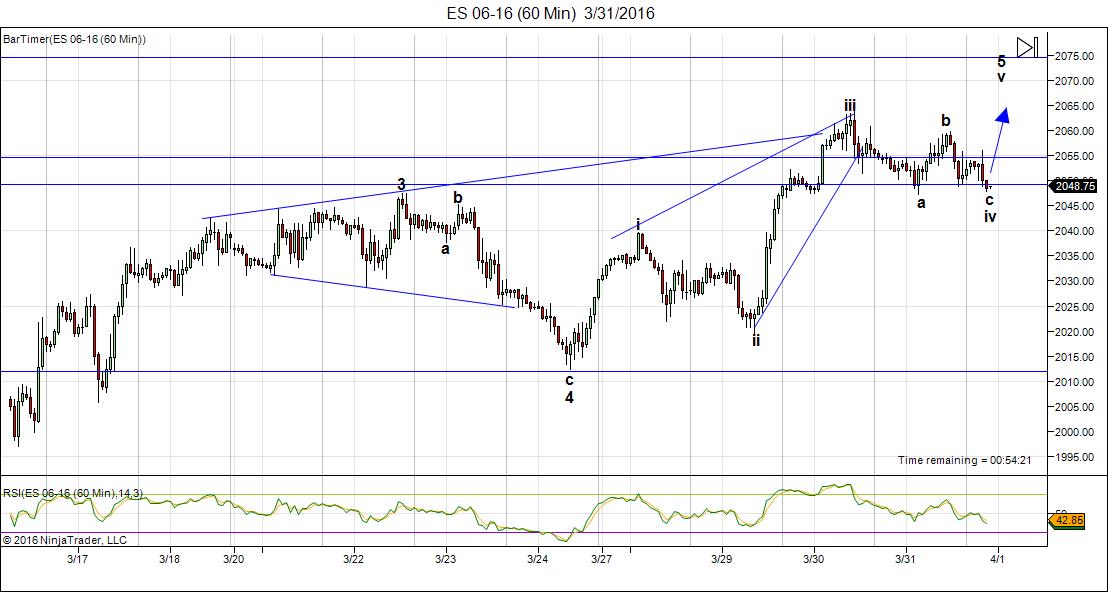
Update: Thursday, March 31, 11:30PM EST
I am back to fight another day! The kidney stone: she has ceased to exist!
Meanwhile, back at the ranch: Above is the 60 minute chart of ES. We’ve dropped to confirm the 4th wave (in three waves). One final wave up to go. I can’t provide a stopping point, although I doubt it’s very far. The waves are getting shorter as the pattern progresses.
Nothing has changed. This is the final wave. All we need to do it get there.
________________________
Update: Wednesday, March 30, After the Open—Watch for the Turn
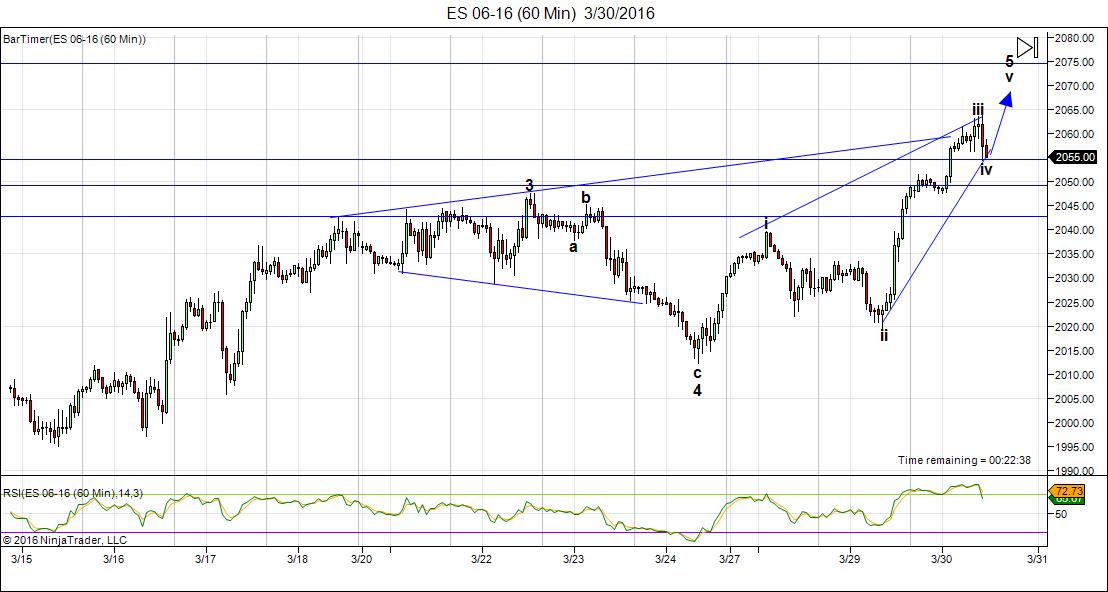
Updated Chart (12:30PM EST) Above is the one hour chart of the ES (SPX futures). We’ve traced out a larger fourth wave and are getting ready for the fifth. This pattern has morphed into a full-fledged ending diagonal. It looks to me like we may not see the end of it today … hard to say.
Ending diagonals have no end target. They stop when they stop. However, they’re in 3 waves (they actually have 5 but in a three wave configuration). We’re waiting on the very last wave to burn itself out. Ending diagonals end dramatically with a retrace to the start of the pattern (in this case, around 2012, or so).
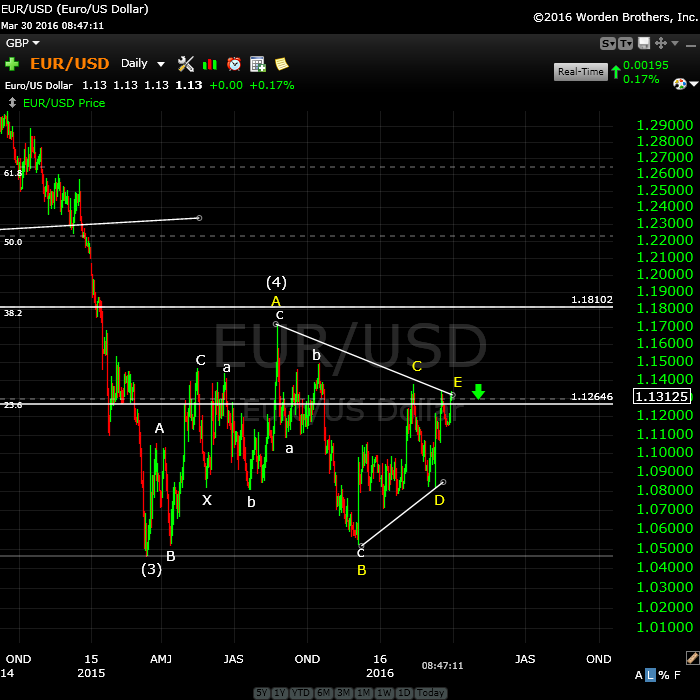
Above is the daily chart of the EURUSD. You can see that the final E upleg I was expecting (see chart of EURUSD further below). The target has been hit and I expect an immediate turn down. US equities should do the same.
USDCAD has also met its target, as well, but looks like it may need a little more time to get there. So I’m not sure if we’ll turn immediately or a bit later after the open. In any event, this is the set up for the turn I’ve been expecting.
__________________________
Update: Tuesday, March 29, After the Close
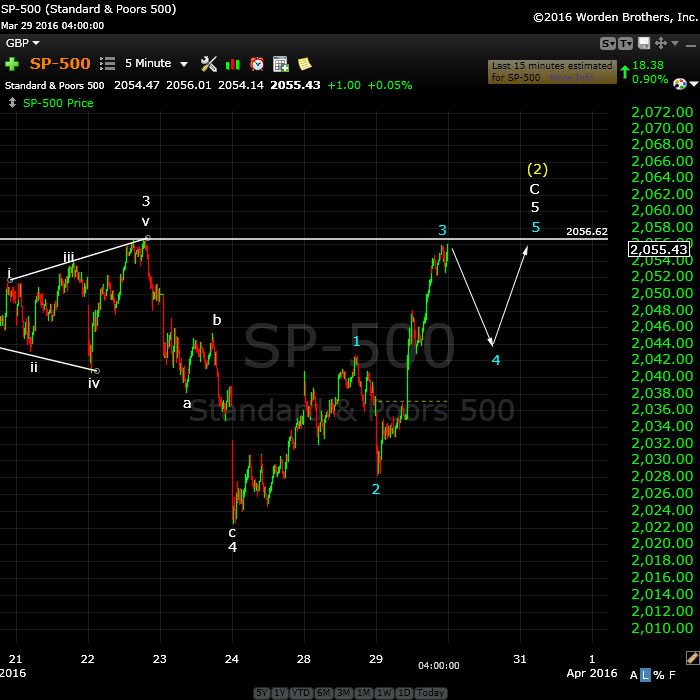
Above is the SP500 (5 minute chart) showing a projection of the current and final set of waves up. Wave 3 is complete and we’re now working on wave 4 (likely overnight). I don’t have a number projection for the top, but the waves are getting shorter. Wave 3 did not make it to 1.618 X wave 1 (but it is longer), and subsequently wave 5 will likely not be full length. I wouldn’t be surprised to see it simply do a double top, but it also could go a little ways above the previous top. Same projections on time as the ES below, of course.
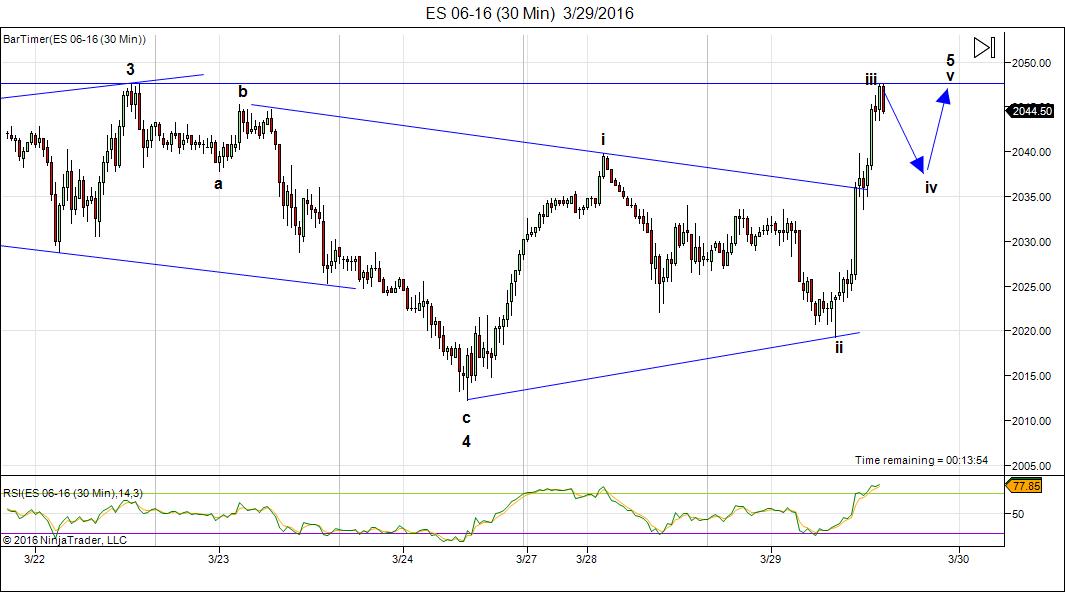
Above is the 60 minute chart of ES (SPX futures). As per the forecast, ES has worked its way up to a new high in three waves (so far). We’re missing a fourth and fifth of this final wave.
I’m expecting a fourth wave tonight and fifth tomorrow. Tomorrow is a turn date for the dollar, and as equities and currencies are moving in tandem, I will be looking for a turn in US equities tomorrow.
USDCAD and EURUSD are performing as I’d suggested. Watch for them both to meet their targets (below before rolling over together with the US markets).
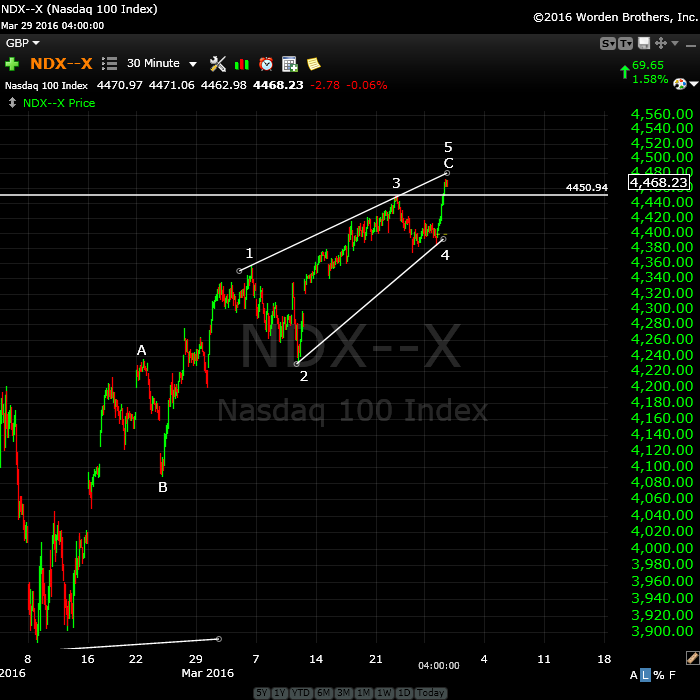
Above is a 30 minute chart of NDX showing the ending diagonal that’s formed. Ending diagonals are in 5 waves and the final wave usually “throws-over” the upper trendline (in this case). It will end in a dramatic reversal and revert to the beginning of the pattern (around 4230) relatively quickly.
The Nasdaq COMP has the same pattern forming.
_____________________________
Original Post (Sunday, March 27): How many times have we expected a rollover and it just hasn’t happened? This 5th wave has been a “plodder.” It should be. It’s a counter-trend push that’s just about out of oxygen. Large second waves at the top of the market are like that. Bullish sentiment is at its height (so close to a previous high—last week, it rose to 81%) and yet this is what we want to see (being contrarians).
But the Elliott wave count is telling us we’re almost done and if you look at some of the goings on under the economic hood:

The Republican party in the US seems just about to implode with Anonymous and the National Enquirer chiming in the “spill the beans” on Ted Cruz. Nobody could write a movie to equal the entertainment value of this particular political campaign. See the background story in Zerohedge.
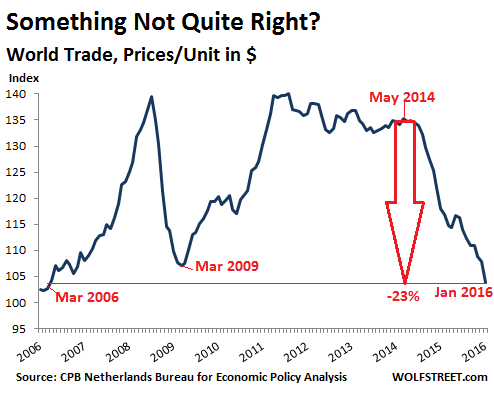
Zerohedge also reports that world trade has collapsed. The chart above shows that in January, we exceeded ten year lows. You can find that story here.
The chart above is a dramatic look at investor credit and each of the major peaks over the past 20 years. These “red dips” show the extent of investor leverage in the market. In short, it’s the greatest it’s ever been. This means when the market comes down, we’re going to have scores of investors dashing for the exits. In order words, we’ll likely have a crash.
The site this comes from is dshort.com, which is site with fabulous articles and charts, primarily for financial advisors, but you’d do well to spend some time there and learn as much as you can about the dire straights the worldwide economy is in.
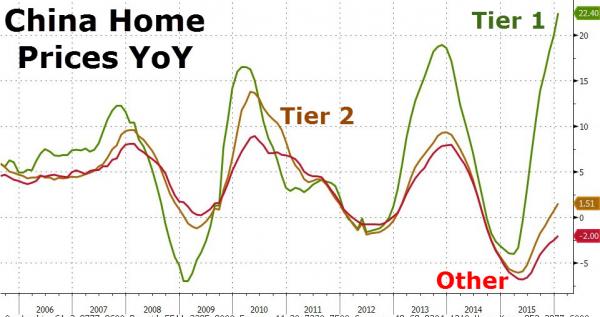
From Zerohedge, the chart above shows the state of the Chinese housing bubble.
China has entered the stage of attempting to end the bubble with new harsh economic regulations. All through history, the crashing real estate bubbles are the final step in a total financial collapse. Look out below. The entire article is here.
Elliott Wave International has stated that the VIX has flashed a sell signal at long last. Tonight (Sunday, March 27), Zerohedge also has a story about the VIX changes.
____________________________
![]() Here’s a link to my interview today on trunews.com, for anyone interested. We focused mainly on Global Cooling, but also covered a fairly wide range of cycle-related areas in a short amount of time.
Here’s a link to my interview today on trunews.com, for anyone interested. We focused mainly on Global Cooling, but also covered a fairly wide range of cycle-related areas in a short amount of time.
______________________________
Here’s a video overview of the market for Monday, March 28:
Market Report for March 28  |
 |
Make sure you zoom the video to full size with frame expander (arrows) in the bottom right hand corner and also set the quality to as high as your web connection allows. This is an HD quality video so the best viewing is at that level. |
_______________________________
The Charts Going into Monday.
The vigil continues ….
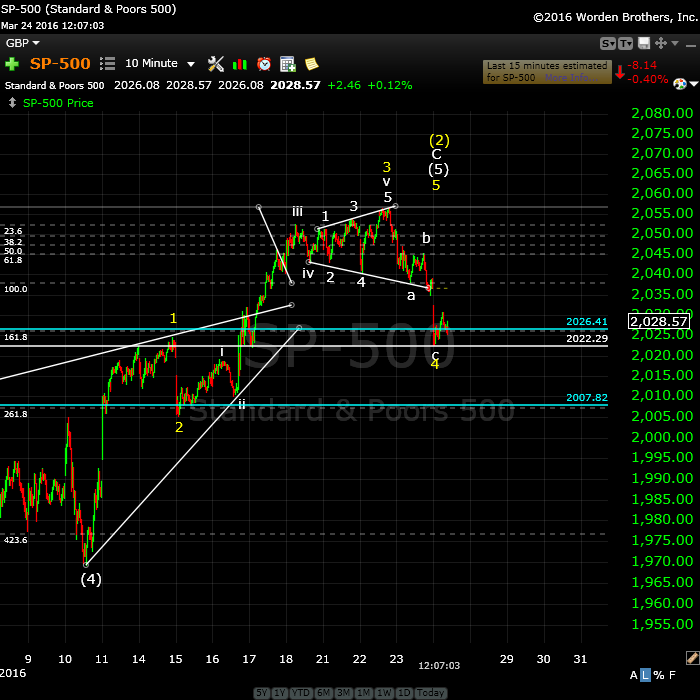
I know this is making us all crazy, but we’re really, really close. Above is a 10 minute chart of SPX. The wave down on Friday NEVER looked motive because it’s first wave was missing a proper second wave. We ended up getting an abc corrective wave—what’s ended up as a final, much deeper fourth wave. I expect one more wave up and would not be surprised to see a triangle, however, at this point, it’s up to the market to tell us what the shape of the final move up.
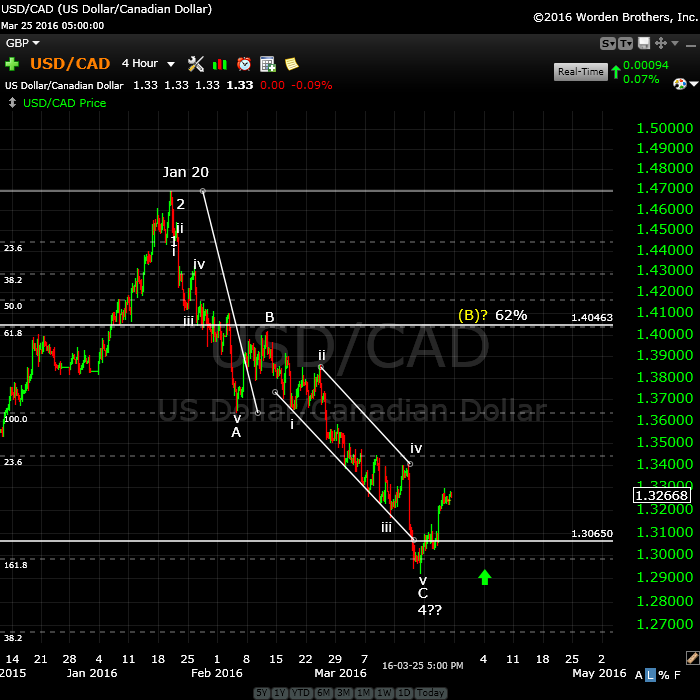
A Major Inflection Point: Above is a 4 hour chart of USDCAD. I have been watching this first wave down unfold and it’s met the target. The wave measures and numbers as a first wave or a complete ABC corrective wave. It has retraced right to the area of the previous fourth. This may be the extent of the correction before a large 5th wave up to a new high, which is now my preference.
The latest move up last week appears to be in 3 waves so I’m expecting a full retrace to 1.29236 or so before turning up. If this is a first wave of a series of corrective waves it will retrace to the 62% level, but it makes sense that it will seek a new low as the equities head into a third wave. They’re been moving in tandem for months now.
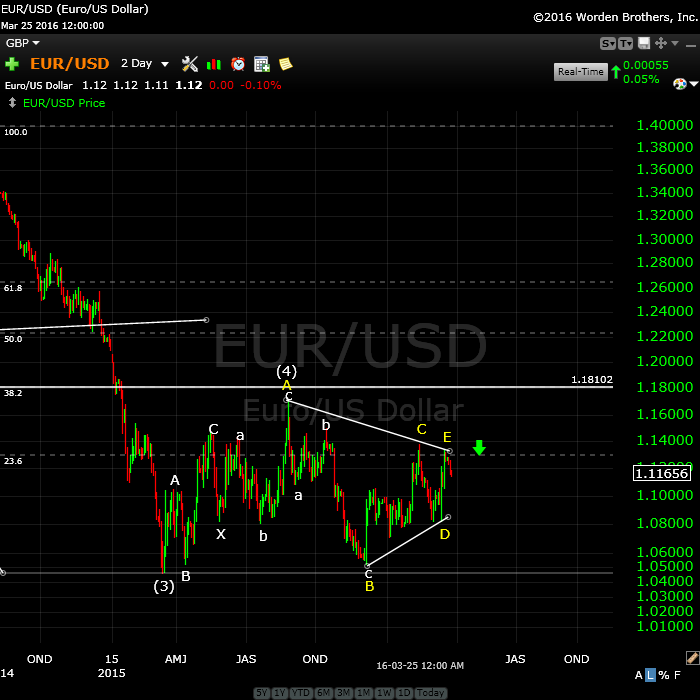
A Major Inflection Point: Here’s the 2 day chart of EURUSD showing the waves up over the past few days that suddenly turned corrective. I was expecting the motive waves to continue, but this flashes a warning.
We now have a corrective triangle, a major inflection point that is destined to head down into a euro fifth wave as the US equities implode lower. We’re waiting …
Shorter term, I expect the downturn of the past week to be fully retraced, and to move in tandem with the US equities. The eur/usd should top at the same time to finish the E wave with a double top.
The US dollar should do the same thing but in the opposite direction (up).
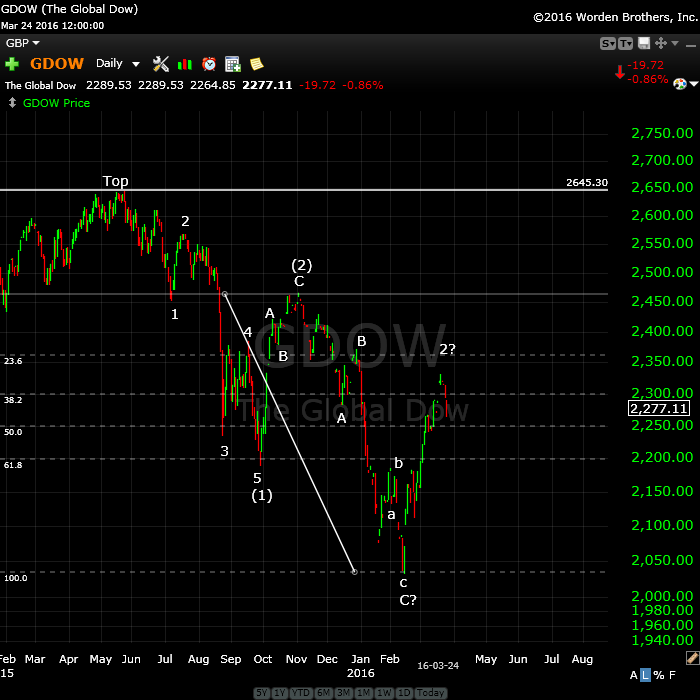
Above is the daily chart of GDOW (Global DOW) showing the current count. It looks to me like we’re tracing out a second wave after an ABC lower part of the wave. This wave will likely stop very close to the 23.6% retrace level (or 76.4%) from the bottom of the wave. This should lead to a very large and strong third wave down.
I do not see a path to a new high for GDOW and, in my opinion, this strongly lowers the probability of a new high for the main US indices.
________________________
First Wave Down – What to Watch For
This weekend we’re dangerously close to a top of a second wave (again).
Let’s look at the SP500. When we turn over, we should drop like a stone.
The first wave down will be in 5 waves and will likely drop to at least 1968 SPX (previous 4th wave). After that, we should get a second wave that will retrace in 3 waves about 62%. That’s the preferred EW entry point. So don’t feel you have to rush in. There’ll be a much better opportunity at the second wave level than at the top and the risk is substantially reduced.
__________________________
The Alternative Count
Here’s a somewhat updated, edited segment of a longer video I’ve posted previously. This video only deals with the likelihood that the market is going to go to a new high.
 |
|
Make sure you zoom the video to full size with frame expander (arrows) in the bottom right hand corner and also set the quality to as high as your web connection allows. This is an HD quality video so the best viewing is at that level. |
_______________________________


Happy Easter, Peter. Good luck this week, especially if this is THE week.
Thanks, Mike … and to you. It’s been the 5th wave seemingly forever, and currencies are ready to turn, so I can’t see how it won’t be this week. Maybe April Fool’s Day. That would be appropriate!
Happy Easter Peter,
Thanks for the update:
This week we should go down but next week we will see a rebound that is what I see in the cards..
Cheers..
https://worldcyclesinstitute.com/the-bear-awakens/#comment-5837
John, Previously noted that you follow ZigZag’s Twitter posts…is your forecast based on or influenced by ZigZag’s recent Tweets? As you may know, I hold ZigZag in the highest regard and have dubbed him ‘the master of stock market symmetry’. rotrot
Rotrot,
I have got my own system but it is inline with his charts (symmetry)
My prediction is down till Thursday/Friday after that up again till April 15/18 after that the big drop especially when mercurius is in retograde (April 28).
I’ve added a chart of ES this morning. Expect a much higher opening this morning in cash indices. ES is telling us we’re very close to the top. We may have a resolution today or tomorrow. It doesn’t look like we’ll get a triangle.
Peter,
If I am reading my charts correctly , then I can see that the TOP was in on March 22nd !
I am not sure how to translate that into EW count !
SPX now @ 2032
AZ
Well, AZ.
I’ve given you the count on ES and I’ve just updated the ES chart at the top of the post. The top is clearly not in, so afraid I can’t help you.
The futures have the cleanest waves. Cash indices are not as clear at the moment.
Yes , I did see the charts and thank you for them.
I could be wrong , so I just need to wait and see
Regards
AZ
Happy Easter Peter! The top for the past few days not in? I’m dead Peter. I just bought weekly 201 puts for $0.36. 🙂
Hi LizH,
Well, Happy Easter … but let’s not get too depressed yet. This is the final wave. Europe is closed today, so I don’t expect a top today. But I don’t really expect this to last the remainder of the week (it could, but this is the 5th of the 5th). I just don’t have a cycle date in front of me, and EW isn’t good at projecting dates. I certainly haven’t called a top yet, but there will be one at the end of this fifth wave.
The tough thing is to wait until we see 5 waves down and another 3 up. That’s the ultimate proof. We still haven’t had those 5 waves down. But maybe we’ll get lucky before the week is out.
This is shaping up to be the prequel the big wave 3 down (if it is, there’ll time to get in once we’ve had actual confirmation of a top). But I’m not going to give downside projections until I have a top confirmed, ’cause they’ll change.
I’ve added a chart of the SP500 with some commentary. The count here is getting clearer, however, there are options moving forward.
More scary news:
What I find interesting are the dates on the Georgia Guidestones wich points to a date in August this year (August 14)
https://www.youtube.com/watch?v=R0sOp60ZqYI
I’m watching this development in a sudden Yellen rally intently. Currencies and cash have hit 62% levels, NQ to a double top, etc. Don’t know if this can trigger a rollover, but the possibility is there ….
Another short term top at 17622 ?
if so then we go back to just below 17500
Joe
guess its going to not work out as i was thinking .
june 2nd-june 10th becomes the next high point
end of april shorter term and april 7-11th also
important .
Joe
We can tick off the third wave of the fifth of the fifth. All we have left to go is the fourth and fifth. We should finish this third wave by end of session, I put the ES target at ~2047.
There was the possibility of a triangle in ES but we’ve gone well beyond the top trendline, so I’m expecting a new high (not much at all above the previous high). All the cash indices should reach new highs.
Nasdaq Comp and NDX are in very obvious ending diagonals. I’ll post a chart of one or the other at the end of the day.
Yeah I also thought that the top was in nice work Peter,I hope My April puts will hold value and we will turn quickly from here
So I m curious If you you can show us a time frame what we can expect next?
You’ll find my ES chart updated at the top of the post. I’m in the midst of updating the SPX chart …. in a few minutes.
Peter ,
Well done on your excellent work .
I thought the top was in on 22nd , but you have proved I was wrong .
Regards
AZ
Well, the market proved you wrong … I’m just a messenger 🙂
EW is never wrong (in my experience). You just need to know how to read it.
I was having a discussion with Gary offline about the ridiculous counts some people have (not to mention any well-known names). Again, calling tops already, or expecting this is part of a much larger 5th wave up (it’s up in 3 waves, and will never be a 5). It doesn’t do me any good, or the EW principle itself (sigh).
However, I don’t have a number for the top. I don’t think we’ll go much above the previous top. I’ll also post a chart of NDX as it’s sporting an ending diagonal, as is the Nasdaq Comp.
Peter,
Perhaps ES will try to target 2055 to close Dec. 30 gap? BTW, thank goodness for the gap down allowing me to close my spy puts.
Good. I’m glad that worked out.
Both SPX and ES charts are updated at the top of the post.
Thanks again Peter,
I hope the dollar will make a lot of head winds for the european markets tommorow..
Peter,
Great work.
About SPX I have a really stupid question that I have been wanting to ask.
Is there any count that allows for a drop all the way to 1750 or 1570 and yet being able to retrace and
produce an ATH say in August?
I understand your alternate count but that is allowed at max drop to ~1900 .
Thank you in advance
Vince
Not that I know of at the moment.
Thank you for your quick respond.
Any chance we are in wave (D) of wave 4 before plunging into w5?
Pardon my ignorance.
Vince
No idea what index you’re referring to or what Wave (D) is.
Peter ,
Apologies, it is SPX .
Any chance it being wave D of 4 targeting 2055-2070 before coming down as W5 to 17xx or 15xx?
Thank you.
“Wave D” implies a triangle. SPX is not in a triangle. W5 would be going up, not down, so I don’t understand what you’re asking.
Like I told the market is pushing to close the quarter as high as possible.
Yen or oil don’t matter any more
This is the configuration I’ve been talking about this morning. Watch for a turn. I’ve placed a couple of charts and commentary at the top of the post.
This is the setup with CAD and EUR at their targets that I’ve been talking about.
Looks like we may have had the turn! We shall see.
SPX sell on 15 minute chart
I don’t see any waves in 5 yet anywhere, except arguably in EURUSD. So I’m expecting a full retrace. This looks like a small wave 4 to me. Most waves down are missing a second wave, or if they have one, it’s too large.
Hi Peter
For what its worth , the puetz cycle has worked out again
to the bullish side .
the cycle began feb 8th ( + – )
the momentum high should come april 7-11th ( new moon )
the cycle ends at the end of April which is coincident with the
beginning of mercury going retrograde .
mercury retrograde cycles are not always bearish yet it will be
worth watching .
the mars uran cycle has a peak aug 4th and sept 23rd
the low of that cycle is jan 20 2017 .
the cycle peaks in my work are:
April 11
may 9
june 6 < —-
July 5
Aug 4th <——-
considering the sell of from the march 4-7th high
we should at the least see a decent sell off from the april 7-11th high
i look forward to your update from this weekend after this week
has done what ever its going to do .
Joe
Thanks Joe,
Always nice to read your comments.
I had May 9 for a big bottom but the way we had up now it could be a big top..
You mention the cycle peaks do you also have the lows?
Thanks
John.
Now ES @ 2057
High ES today was @ 2064 ( until writing this message )
My target for the TOP will be @ 2088 ( + / – 2 )
I posted a revised chart of ES at the top of the post. The ending diagonal actually looks much better now that we’ve traced out a larger fourth wave. One more tiny wave is left to go. I don’t know whether we’ll see the end of it today.
I think you are right Peet, a higher top is yet to come, SOON! 🙂
Cheers,
W
But I now don’t think it’s going to happen today. More likely end of month. Down Friday.
The monkey and fools day are a great team together..
Monday the 4th we have a bradley turn
I’m going to be out of commission for the next 24 hours by the looks of it. I have no access to market information at the moment, and this will likely continue through the session tomorrow (Thursday). I hope to be back online on Thursday evening.
I also don’t have access to email.
VIX chart-
it appears that the tiny residual gap from Nov 9, has closed and that the VIX is very close to approaching a double bottom.
http://invst.ly/1f78-
We still have this one little wave up to go. I would watch for a turn tomorrow perhaps. amb-I’m in getting that stone dragged out of me today, so I’ll be bright and bushy-tailed for tomorrow morning 🙂
Peter
Hope all goes well for you today
Take care
AZ
Take care and get well soon Peter!
GL with the stone Peet! I hope that it will crumble just as fast as the indices will in the coming year. 🙂
Cheers,
W
I added a new chart of ES tonight. Not much has changed. Still that final wave to go.
Bayer rule 36 gives 4/1. So the fun should begin… soon.
André
I did not mention that if the last pattern up is an ending diagonal, we’re done. There will be no fifth wave.
However, this wave down is not looking “right” to me. It’s close, but not motive. I think we need at least a double top. However, if we were to retrace 62% and turn, it would be all over.
If we’re getting a fifth wave up, which is my preference, then it should be in 5 waves.
Thanks…..Are you back to normal? Hope so…..
The mkt gods are sure not making it easy…..
Whit
🙂 I’m back home. It’s now day surgery—no big deal.
This shouldn’t be too difficult now … I see currencies starting to turn.
As I look around the US indices, it still looks like a small fourth, so I would expect this last wave up. I’ll let you know if I see anything out of the ordinary. Waves are so tiny now, it’s a little bit difficult to pick them apart.
Glad for you, Peter,
what level do you mean for 62% or full retracement
Dimitri,
I don’t understand the question. But if we look at the SPX, a regular top (1.618 X wave 1 would put us at 1077). For ES, I make it 2080. I’m pretty sure this is a fifth wave.
Looks like the second wave. I put the bottom at 2043 ES. 🙂
Dimitri,
In ES, since the fourth is in the area of the first, we may be tracing out a triangle.
And, of course, we could be in an ending diagonal. So this may mess up that 2nd wave target I just gave you.
You told that overlapping is not so important in case of corrective wave
Correct. In a corrective wave, it doesn’t much matter. However, you still want to figure out the pattern. There are about a dozen of them. And because this an end wave, we could also be looking at an ending diagonal, so it adds to the options. Once you know the pattern, you know how to trade it. This is not going to be five waves up, something else is happening, since it didn’t go into a second wave and the wave up has too many waves in it to be a simple first wave.
Also the third wave up from the 19th looks to be in 3 waves, so I think we’re looking at an ending diagonal.
The only sure thing is that we need to get to a new high because none of the waves down are motive.
One other thing. Cash indices are not overlapping waves (except for the DOW), so they may have a different pattern unfolding than futures, which do overlap (YM and ES do). It’s a bit of a mess at the moment.
?
I don’t know what this market is doing at the moment. We could be in the last leg of an ending diagonal. There are other options … we’ll wait and see.
Update (about 1:30PM EST-US market time):
I’m seeing a wave up in 3, which supports the ending diagonal scenario and, when I look at all the indices as a whole, seems the likeliest pattern. As such, I don’t have a specific end target … a new high most likely above 2078 is about all I can offer.
The wave should end abruptly and then head straight down in a motive pattern. Either we get there by 3PM EST and see a first wave down today, or we’ll extend this wave up over Sunday and be looking for a turn on Monday (April 4).
This is the final wave, so as we get higher here, the options start to diminish. I’ll post an updated chart of the SPX now and do a video on the weekend. We’ll start looking at downside targets on the weekend.
We’ve been at a fairly consistent reading of 83% bulls, which is extremely high, and supports a turn. The VIX flashed a turn signal earlier this week (or last)—I’m a little disoriented on time due to my “medical ordeal” this past couple of weeks (which included two days shut off from the market), so the weekend will give me some time to get re-oriented.
Not to worry, I’m well—it just takes a bit of time to recover. As usual with me, it’s always an “interesting” path to a solution … haha. The past two weeks has kept to that “rule of thumb” quite well, with lots of laughs along the way …
My number of 2078 in the previous comment referred to the SPX.
Now that I’ve measured the actual SPX waves, 2080 would give as a C wave of this final wave up from 2059 of 1X the A wave. That’s likely the minimum. It could go to 1.6X the A wave.
I’ve updated the ES chart at the top of the post.
Keep in mind that there’s also the possibility of a double top here. However, with ES having an overlap, I’ve gone with an ending diagonal. I’ve also figured in the fact that the third wave looks like a “3” rather than a “5.” If we exceed the previous high,then I would expect we’ll see the continuation of the ending diagonal through Sunday.
Well, we’re obviously going into the weekend. We certainly don’t have much farther to go … 🙂
Everything I see points down. The only short term positive forces are :
1) moon at quarter 3/31
2) Mercury at perihelion 4/6
3) lunar velocity rate of change (4/4)
A Squared number on the 2000 high gave a midpoint 4/1. This midpoint indicates a high.
So time is running out – fast. Monday may still be up But Tuesday at the latest we should be down. Europe set the high 3/30 and seems to be down already. Once Us markets join volatility should go up.
Just my 2 cents for now.
Cheers,
André
Lunar inversions on Monday will be the tropical moon entering Pisces and sun-moon elongation at 315.
So one scenario could be High on Monday, down into Tuesday and one last test on Wednesday.
Anyway; it’s a matter of days now before we see a sharp decline.
When time and price square out change is inevitable said Gann.
The 2134 priceangle is 168 degrees. So the sun at 12 (4/1-2) brings 180. So this weekend is major one.
André
Hi Peter
As i focus on the cash dow weekly bar chart i keep seeing 18011
back in nov-dec last year i noted that it could have been an X
wave because of the failure to get above 18137 and change .
I think the next week will define the wave pattern .
my bias is we are in a long term triangle but exactly where in that triangle
is no debatable . Im starting to question another pattern which is
that the rally from the august 2015 lows to today is a larger A B C rally
that count though will only be confirmed with a poke above the nov
2015 high in the cash dow at 17977.85 . i realize there is differences between
indexs yet here is my argument with the dow weekly chart only .
An A B C move should have 5 waves up in wave C regardless of what A looks like .
wave A from august to nov on the weekly chart is a clean 3 wave move .
the drop from nov to jan 2016 was a 3 wave decline , this rally back up
is now 5 waves up which makes the count clean with one caveat .
wave C has not yet broken above the wave A high which was in nov 2015
at 17977.85 .
So if this is really just an A B C rally from the aug 2015 lows the the 18011 price
level should be hit ( the minimum being just a poke above 17977.85 )
the momentum high which is due april 7-11th is next week and a weekly
bar count makes the case that this week ( into last Friday april 1 ) is probably
the closing high for this cycle despite my call for higher prices short term .
Joe
One last note
looking at the cash dow daily close only chart .
it is best labeled an expanded flat .
in this case the feb 11 closing low ( which is also a print low in other index’s)
Feb 11 was the important low in terms of time
Nov 3 close = 17918.2 should be taken out on a closing basis
Jan 20 close =15766.7 ( my charts at times give me rounded numbers)
Feb 1 close = 16449.20
Feb 11 close =15660.20 ( closing low )
16449.2-15766.7=682.50 points
682.50 * 3.618 =2469.28
15660.2=2469.28=18129.48 <———Ideal wave C close
Ill work with this thought over the weekend
Joe
Thanks Joe,
For now you are spot on again ,we have seen a strong upmove from the low Feb 23.
My next turning point is April 13/ 15..
Nice weekend
Excuse Feb 24..
Hi Peter,
Thanks for your post. I am long Vix calls with expiration next few Fridays. I am of two ideas regarding near term market thru 2017. One cycle 29.5 year points to mania in financial assets next two years (1928, 1958, 1987), another the 12 year cycle points to a useless choppy year (2004, 1992, 1980, 1968). My guess is that we get useless chop until end of 2016, and then mania in 2017 (even tho’ years of 7 are lean). Look forward to reading your posts in future.
New post up: https://worldcyclesinstitute.com/it-aint-over-til-its-over/
This website is for educational purposes relating to Elliott Wave, natural cycles, and the Quantum Revolution (Great Awakening). I welcome questions or comments about any of these subjects. Due to a heavy schedule, I may not have the time to answer questions that relate to my area of expertise.
I reserve the right to remove any comment that is deemed negative, is unhelpful, or off-topic. Such comments may be removed.
Want to comment? You need to be logged in to comment. You can register here.