
Update: Jan. 2, 3PM EST
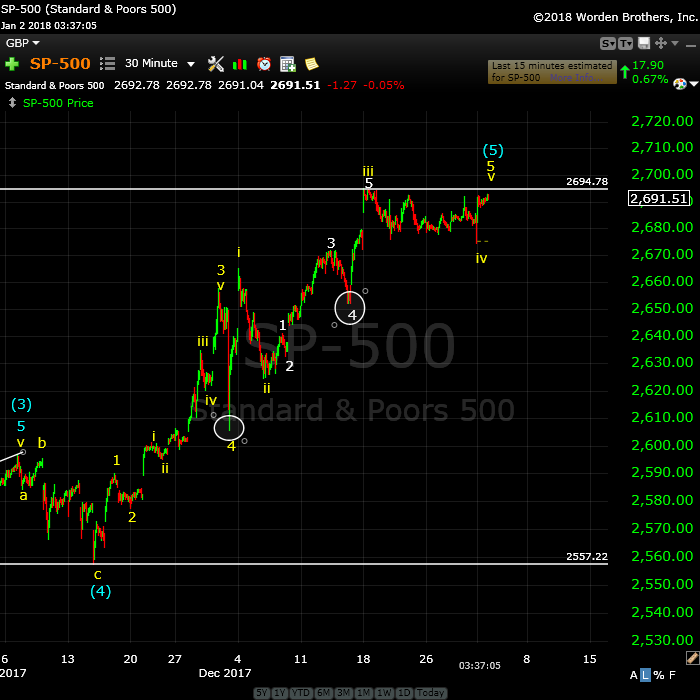
Above is the 30 minute chart of the SP500 showing the entire wave up from the final blue fourth (circle). I’ve put circles around the large fourth waves that have been causing me to label this entire wave as corrective (which meant a triangle was likely). It does not look like a motive wave, but when you get to a situation with such low volume, wave structures tend to get a little bit wonky.
If this count is correct, (I actually have only changed the upper part of the wave in terms of the count), then we’re looking at an imminent top … perhaps even tomorrow.
Currencies don’t support a top other than the fact that they’re trying to go up in a corrective wave, but aren’t moving. Otherwise, currencies still have a major wave to go, but it may finish up after the US market tops (which has been an alternate scenario, and why I’ve been suggesting more time for a top).
________________________
 The Most Important Trading Tool: Patience
The final waiting game begins in earnest.
The resolution to this “never-ending” rally will obviously be in the New Year, but when?
Based upon the current position of the asset classes I cover, we’re looking at the first quarter. We’re in the final Elliott Wave pattern – a contracting triangle, although not technically confirmed.
The potential ending diagonal has failed and so all that’s left is a traditional triangle of some sort, the “contracting” variety being the most common.
The US equities market is, for the most part, “done.” The over-arching wave structure is complete. We’re in a final fourth wave pattern that will resolve and change the direction of the trend with one more slight rise to a new high.
However, the US Dollar and related currencies all have one more slightly larger wave to complete. As the dollar is the reserve currency, it defines the ultimate market direction; All other asset classes have a relationship with the dollar, so they’re all affected by its movement. Once it completes the topping process, everything else will turn. I think we have another couple of months left while the US equities triangle unfolds to a slight new high, and the dollar seeks a slight new low.
Once demand for the US dollar increases (as debts demand payment in the reserve currency), deflation will start to engulf the financial system worldwide, as it always has in each depression we’ve suffered throughout history.
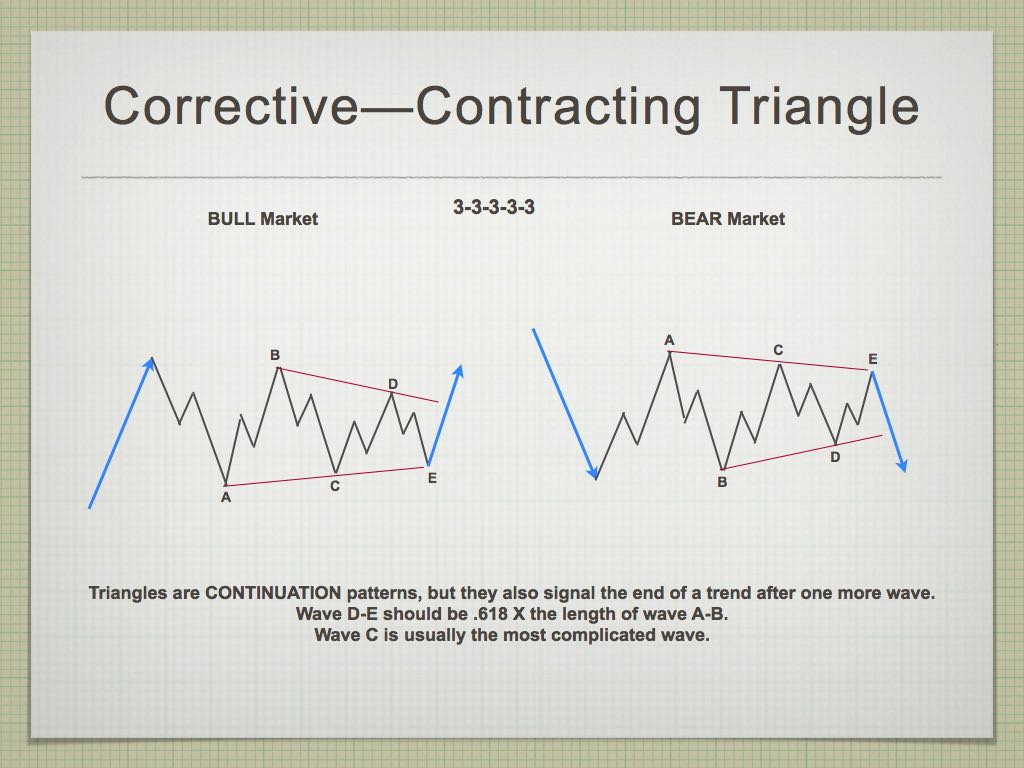
Contracting triangles move sideways and burn up a lot of time with their up and down five waves. They end up with a final wave to a new high. The final wave up is typically the same length as the widest part of the triangle, but not always. So, while we can’t count on it, it’s a good guideline.
Once we have the contracting triangle confirmed (with a larger drop in a C wave), there’ll be some high probability trades that set up. But we need confirmation first.
As I wrote last week, it’s the dollar that will have the last word on the top, but they’ll all join the parade to a final top (each perhaps in its own way. A little more patience is warranted.
____________________
Problem receiving blog comment emails? Try whitelisting the address. More info.
______________________________
the real deal SM 2
The real deal …‘Educational, insightful and thorough market analysis for all levels of traders. It’s Elliott Wave at its best….Peter Temple is the real deal’ —SM |
Couldn’t be happier … KK 2
Couldn’t be happier …The analysis and insight you provide is simply amazing! I’ve been trading the futures and equity markets for well over thirty years and usually average around 5% monthly. Since joining your Traders Gold Service two months ago, that number has better than doubled. I couldn’t be happier.—KK |
A true expert in Elliott Wave FL 2
A true expert in Elliott Wave …You are a true expert in EW analysis. What you provide is not available anywhere and is priceless. Subscription on your services is the best thing I have ever done. Many thanks for your effort to make me a better investor. I now have more trust in my investment decisions. I hope you will continue the excellent work! —FL |
Tops in your field DZ 2
Tops in your field …You are tops in your field. Tried to follow Elliot Wave international for years. They were always behind the market. After discovering you, I perceive that you are an expert in reading the waves, which puts you way ahead of the rest of your peers. And you can read the Waves like you are reading tomorrow’s financial section. I pray you stay healthy. —DZ |
Have not had a losing week RW 2
Have not had a losing week …I have been with Peter almost a year. The only thing that matters is have I made money with his service. I think I have finally turned the corner using Peter’s EW. I have not had a losing week in the last 5 months. Thanks Peter, for your amazing amount of hard work. —RW |
The best of them JL 2
The best of them …Last couple of years, I subscribed to several ‘market traders’. You are by far the best of them and the personal contact is awesome. Daily and daily updates are very well written! Besides your expertise in EW, I also like your cycles analysis. Best investment I ever made! —JL |
Get an upper hand … JC 2
Get an upper hand in trading …Seeing all the different currency pairs and the wave structures and hearing you explain why this has to do that on a nightly bases gives one a upper hand when trading. Elliott Wave applies to all stock and indices and can be applied to any candlestick chart. If someone ask what you want for Christmas – Tell them a membership to Peter’s “Traders Gold!”—JC |
Rise above the rest … SM 2
Rise above the rest …I have only ever met a few people who, in their chosen fields (astrology, medicine, music, martial arts, technical analysis), rise above all the rest and you are one of them…you have ‘the gift’…and that’s why I’m a Trader’s Gold member. —SM |
The Market This Week
Here's the latest daily chart of ES (emini futures)
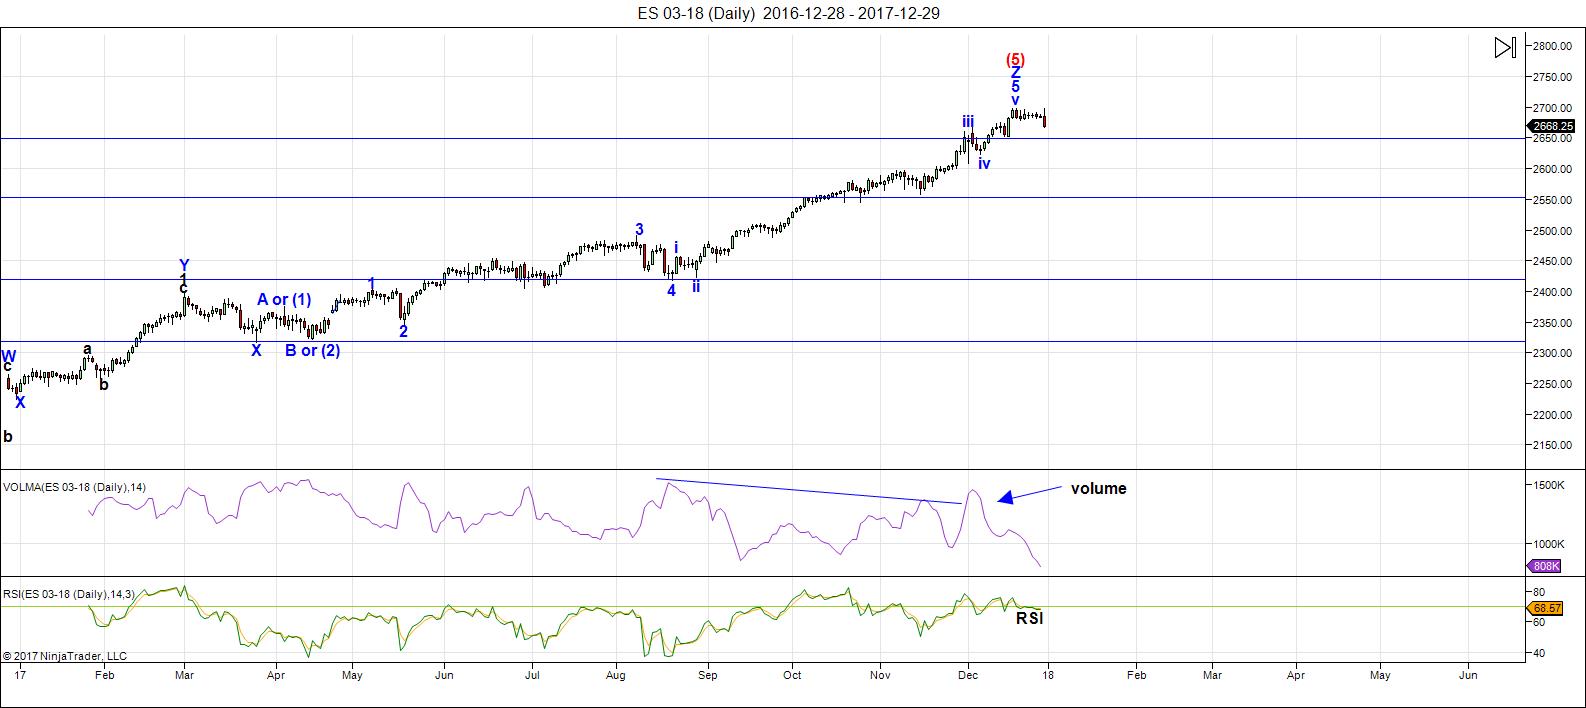
Above is the daily chart of ES (click to enlarge, as with any of my charts).
There have been no material changes to my prognosis. We are at the high. I expect this final wave to breach the previous high for the final time.
Although a bit early to call, based on what the rest of the market is doing, the highest probability pattern unfolding is a contracting triangle.
Volume: It's dismal. The only thing apparently holding this market up is the action of the US Dollar, which still has to bottom.
Summary: The count is full for the US market in general, except for small subwaves that form the balance of a motive set of waves in SPX and some other major US indices. I'm leaning towards a contracting triangle as the final pattern, although confirmation is needed, with the completion of a C wave to the downside being the first step.
_______________________
Here's the latest 60 MIN chart of ES (emini futures):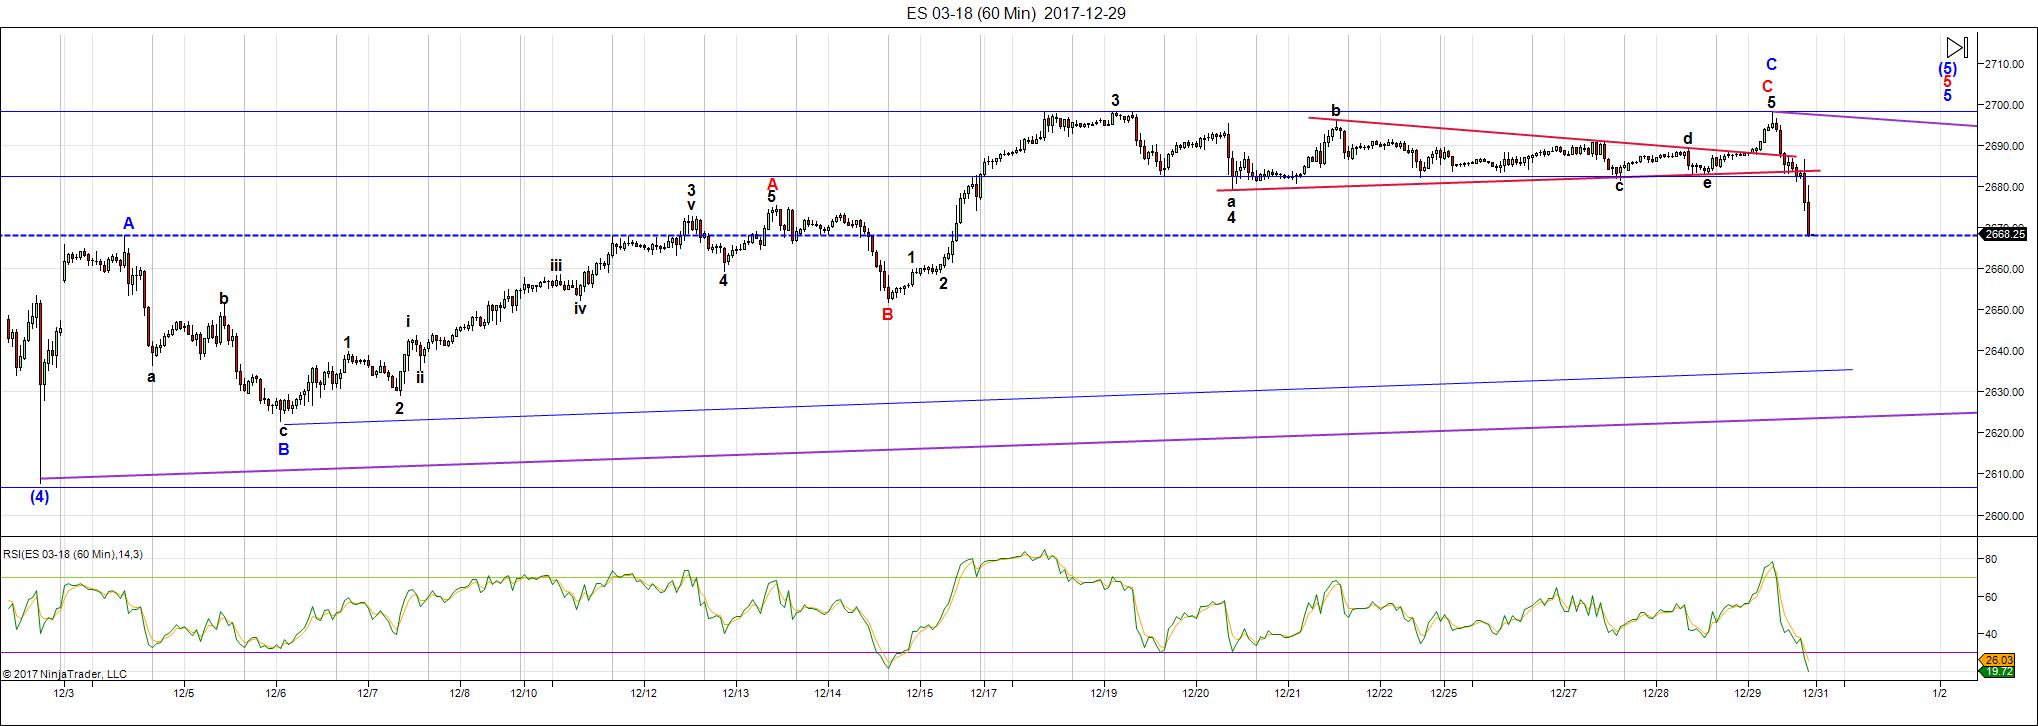
Above is the 60 minute chart of ES (click to enlarge). Please watch the video to get the full story on what's happening short term.
Last weekend, we knew we were dealing with a triangle of some type. Although I wasn't expecting it, we completed a tiny one with a double top. I've traced it out on the screen above. Other than the NYSE, it appears to be the only index that went to a new high. As a result, I have to label the double top as the completion of a complex zigzag (perhaps a "triple"). There's more than one way to label this chart, so we'll have to see what waves trace out this week.
The key here is that the wave up is corrective, which means a top is not in place. As well, the waves down are in all the indices are also corrective and that means we have one more wave up to a final high.
I expect a low volume week, with a bounce to start it off and a then a continuation down to the lower trendline. I've placed two lower trendlines on the chart—where the wave down stops will determine the width of the triangle, if that's indeed the pattern unfolding.
At this point, I have to leave it to the market to confirm the contracting triangle pattern.
Short term: The wave larger count is now virtually complete. We're tracing out a triangle of some sort. I'm leaning now towards a contracting triangle as being the operative pattern; however, we need confirmation from the market with the completion of the C wave down.
___________________________
Trader's Gold Subscribers get a comprehensive view of the market, including hourly (and even smaller timeframes, when appropriate) on a daily basis. They also receive updates through the comments area. I provide only the daily timeframe for the free blog, as a "snapshot" of where the market currently trades and the next move on a weekly basis.
______________________________________
Sign up for: The Chart Show
Next Date: Thursday, Januaray 11 at 1:00 pm EST (US market time)

The Chart Show is a one hour webinar in which Peter Temple provides the Elliott Wave analysis in real time for the US market, gold, silver, oil, major USD currency pairs, and more. You won't find a more accurate or comprehensive market prediction anywhere for this price.
Get caught up on the market from an Elliott Wave perspective. You’ll also get Andy Pancholi cycle turn dates for the SP500 for the balance of the current month. There’ll be a Q&A session during and at the end of the webinar and the possibility (depending on time) of taking requests.
All registrants will receive the video playback of the webinar, so even if you miss it, you’ll be sent the full video replay within about an hour of its conclusion. For more information and to sign up, click here.


Thank you Peter …Nick
Peter
I took a break over the weekend after having a few computer issues .
I see your contracting triangle in the futures market yet in the cash index’s it
Appears to me that the market failed . The cash Dow possibly a triangle still forming
Yet it does not have the right look to me as a triangle .
There have been several triangle type patterns on this rally yet many of them have
Not been true triangles.
In your diagram above the pattern has what I consider a strict rule that many disregard
And that is the overlap .
Each leg being a b c d e all have individual a b c legs with in them and when looking
At the diagram it shows an overlap of each B wave within each individual leg.
When looking at the futures chart the D wave did not overlap the previous B wave of wave C.
In the cash index’s the pattern has more flaws .
Despite my bearish thinking I find it difficult to label a triangle .
I’ll look at the nq + es + ym and see what that charts shows .
Throwing out timing and just taking the wave count you show on the es then
The apex of the triangle should become the resistance of importance .
In other words if your triangle label on the es is correct then the 2687 ish area
Should be max . Getting back through 2690 argues that new highs are coming
And most likely something else ( cash index’s patterns ) must be considered .
Just my thoughts and I am not looking at a chart as I write this.
I have a few hours of research before making any comments .
Just pointing out what I’m thinking at the moment .
Thanks for the update 🙂
The labels are indeed unconventional. I am not at all sure what exexacty is unfolding. Price action is starting to looki ominous with impulsive declines and tortured retraces in what is quite obviously a desperate attempt to fight the impending significant trend change.
Time cycle from dec 13 to jan 2 was called to be a high to a low .
Obviously this did not work out so well .
from the high on dec 13th the futures dipped went up even higher
and then dropped back down into Friday to test that dec 13 th high .
The cash index’s did not achieve this .
No Proof the top is in is all i can say at this point
Yep. So far call for a Jan 2 low proving incorrect. Of course that could change by the close. We will see…
The dec 14th low is now considered the main support as i see it.
back to my research .
cash dow has a higher support at 24692.70 where wave C would equal
wave A , yet the lower support which is going to matter is the dec 14th low .
Going to stay bearish for now yet i have to admit new highs are possible
US Dollar index .
the monthly chart considers a possible 5th wave down as possible
yet the daily chart considers another more bullish possible .
the bullish consideration for the us dollar gives it a few days to about 10 trading days to bottom .
the low would be 91.590 which is not very far from this mornings low at
91751.
A low this week is possible if this is nothing more than a deep pullback.
The mid January time frame is going to be interesting .
If this pattern is unfolding it would be considered as a Bull Gartley
US Dollar:
https://imgur.com/92mxz6j
Gold futures for a comparison ( possible triangle )
https://imgur.com/2AYfD5M
It sure is starting to look like some sort of larger degree triangle is in the works. It does not look to me like it is contracting or expanding so posibly a running, barrier or symmetrical could be a viable candidate. I am awful at identifying the exact type but I think we have yet another one underway. Incredible!
Almost certainly a fifth wave down to come or already underway in DX. I would not be surprised to see a swift spike down to complete it.
$sox index is worth a look .
2 equal legs up in time gives it 6 trade days to go
and if wave C up equals wave A it would test its all time high.
Looking like the index’s need to fall into sync.
similar relationships i see with the us dollar as well as gold .
looks like another week or so of pain with any short positions.
probably new all times highs in dow or spx or some index.
im not going to excited about this week .
Good luck everyone and have a good week.
Ill try to post something later in the week after im finished catching up
Final post for me .
$ Util
looks like a minor 5 waves down on a 60 minute chart
from the lower high ( wave 4 or wave iv of 3 )
weekly chart has 1 2 3 4 . daily chart has either a leading diagonal
wave 1 then wave 2 3 and 4 .
or the daily chart has ( 1 ) ( 2 ) i ii iii iv with minor iv on dec 29 at
at 727.20 . this leg down into todays low would have to wave
another wave 1 down of wave 5 of which degree is open to debate .
the downside target becomes 703 to 696 if the dec 21 low is taken out .
id say a bounce which fails to get back up to 727 followed by a drop below
today’s low would signal a break below the dec 21 is going to happen
and ill target the 703-696 level which would also target the july 2017 lows .
This minor wave 2 should not last more than a day or so .
This should leave pressure on the market yet there is still going to be a wave 2
bounce once this developing wave completes.
ill imagine ( guess ) the bounce in the utilities will be some sort of decline
in the dow . ( just a guess )
staying short yet this market is all over the place depending on where you look.
Verne
ill go with the 5th wave on the dollar index only if i see it .
the potential for it turning higher based on what i showed above
leaves me open minded.
Everything is falling in place yet we don’t have any confirmations .
The euro though may make a new high and the dollar fails ???
im not going to make any predictions just thinking out loud
I agree no confirmation yet. Looking for a DX break of 91.00 to the downside…
I think there can now be no doubt that ES, SPX, and DJI are all in some kind of larger triangle. Break should be upwards.
verne,
i “BE” looking for this “tri”angle of which you speak – alas,,,,i have eyes – but i am unable to “see”………………
https://invst.ly/68g2-
Whatever kind of triangle it is, it is one ugly specimen and I have no idea how it could be labelled. It seems to be to be at the very least at minute and possibly minor degree.
And just to make thing perfectly cloudy, now it is really starting to look like we had a leading expanding diagonal down in NQ with a deep second wave retrace underway. If that is true, a substantial plunge is just ahead methinks…
Could we also be seeing a leading expanding diagonal developing in ES??!!!
$util may have put in a swing low today
breaking below the dec 21 low while failing to bounce
has left bullish divergences in place .
a move back to 727 is now expected .
( very weak 5th wave and a daily rsi below 30 )
a 5 to 11 trading days is expected.
another line up with the dollar index .
thing are indeed lining up .
no opinion now on the Utilities .
wave 1 2 and i ii iii iv and v 3 are in place.
Weekly chart has waves 1 2 3 4 5 in place.
hence wave 1 down can be considered in place despite
the very weak 5th.
staying open minded yet expecting a tun higher .
the surprise to the downside would be welcome yet
the minimum has been satisfied .
I also have the Dollar squaring out, time & price at 91.43 today.
An abbreviated fifth wave down is in my view a definite possibility. Gold is now extremely stretched to the upside with two daily candles entirely above its upper B band, which is something I have not seen in a very long time, going back several years. The yellow metal is going to see some serious droopage methinks! 🙂
I have Gold now overbalanced in time. My analysis had 1309 and it blew right past. upper limit IMHO is 1325.
Copper squared out last Thursday. now looking to around 12 January low
I am sticking with the ES hitting 2740 by, or on 14/1.
I just noticed something interesting on ES. On Dec 18 and 19 the daily candles had the EXACT same high and low, although the 19 had a slightly lower close. Talk about a precise double top! I have not been able to find another two days of candles with that kind of precise duplication of high and low….
What is going on now is the market is completely nuts. DJI has already filled its gap up open from this morning and that suggests the current sideways triangular movement should see a break to the downside. SPX is in the exact opposite situation with a yet remaining open gap and therefore expectation of an upside break. As I said. totally nuts!!! 🙂
Someone said fractured markets are un-helathy marketets…I think it was Bob P.
I’ve had an alternate for some time which keeps coming back when we get a day like today … and that’s that the US indices might top out before the dollar finishes up. Otherwise, they’re moving together.
Today is more likely leading to a double top in ES and NQ than a triangle, as far as I can see. I’d sure like this scenario a lot better than the triangle, because it means we’ll have a New Year’s resolution really soon.
In any event, we’re at the top of the final wave, so the pattern unfolding is key to knowing how soon this thing is going to properly top.
Fascinating!
It is not often that you and the “Other Guys” see the same thing! 🙂
Yeah, well I used the same pic at the top of the post in both and I screwed up by posting charts on the wrong post.
Anyway, I think we have an impending top here. I’ve changed my count and after my analysis tonight, I’ll very likely update what’s there (or perhaps shortly at day’s end). The action today paints a different picture than last night, but the bigger issue has been that the waves up don’t have “the right look” but if you discount that fact, I can find 5 waves and the appropriate number of subwaves to suggest a top perhaps at day’s end or tomorrow.
I’d rather be a little more sure of what all the other indices are doing before I post and suggest a top is in.
If we get a new spike down in VIX to a new ATL the next day or two that could be MOST interesting…have a great evening all! 🙂
New ATH in SPX….
I reposted the SPX chart here. We have a pending final top – still to be confirmed, of course.
I’ve re-posted a chart of SPX at the top of the post. I think we have a pending top based upon today’s action, most notably in NQ (Nasdaq and futures). It will be important for all the major US indices to show a top before we turn down.
Wow! Thanks Peter!
That break to the downside last Friday was really interesting and a nice head fake ahead of the final move up. VIX bounced at the close so things could be REAL interesting tomorrow. Maybe futures will ramp sky-high with a key reversal day on deck. I grabbed some VIX 10.00 strike calls right at the close on the thesis that VIX under 10.00 the last few months has qualified as “Cheap” for short term trades.
Yeah, this last wave up was an incredibly difficult one to analyze. I’m taking a look at currencies as well tonight. I’m beginning to think the US dollar is almost ready to turn up, as well. Really interesting and devious how everything is coming to a head at the same time.
ok, i am throwing a “little ES spaghetti”…………….. what if………..?
https://invst.ly/68ia4
Yowza! That count envisions a nerve-wracking plunge back to around 2580 in short order…!
Egad!! That’l rattle few cages….!
Verne
i came here to just say i saw your post in an email
and i was going to say in regards to the jan 2 low .
since Friday was the previous trade day to the jan 2 date
that i would not call it a failure .
then i saw peters chart and i have to agree with it .
a spike to new high’s makes total sense .
the jan 9 18th window for a high though i have to stick with.
One thing i will say about today is there was alot of stocks
with decent moves .
apple ( AAPL ) though has 5 waves down on the daily chart
so i am not expecting new highs just a wave 2 high or a B wave.
the cash dow has hit or broken through the 6 times over the since dec 18th.
breaking through that level again will probably bring an extension to new highs.
Cash SPX Tran and Nasdaq comp and Valua all made new all time highs today .
( $ goes before the symbols )
UTIL really should bounce and fall to complete the daily chart wave count
yet the weekly chart does have 5 waves in it .
maybe this is nothing more then a secondary run higher for stocks that have already topped ( aaple as example ) yet the index’s go to new highs
probably across the board .
Fridays lows for me is where the rubber meets the road .
24851 on cash dow gets broken and 25,000 plus probably comes fast.
2717 2760 spx .
Good point Joe. Peter’s updated chart aligns very well with current sentiment…by any imaginable measure at historic and unprecedented extremes. This is the main reason that Bob Prechter, although clearly early, called a market top recently. I can almost smell the Napalm… 🙂
(See what I did there with CL-early early? Ha! Ha!)
Just notes’
copy and paste from peters moon.
Full Moon
The moon is currently in Cancer
The moon is 15 days old
Joe,
For someone who is trying to understand planetary influences…Could you comment on what you said in your post about “Full moon, moon in Cancer,
Moon 15 days old.”
Ed
If you scroll up this web page and look on the right column
you will see a picture of the moon and that is what it says
today it says this :Full Moon
The moon is currently in Leo
The moon is 16 days old
I only do that because i am thinking that the market had a change or trend today . there are times when the moon lines up with the market, it doesn’t always work
every year the same way so i look for clues is all .
i don’t usually pay much attention to the moon in cancer or the moon in leo etc.
yet i do pay attention to new moons and first qtr last qtr and full moons etc and how that relates to other planetary influences.
i have mentioned in prior posts what i call the failed puetz window . one thing i learned from last year though was there was something to it where in the past i have discounted it . In a true puetz window you get the solar eclipse before the lunar eclipse the trend tends to peak the new moon before the solar eclipse and then the market goes down into the solar eclipse and bounces into the lunar eclipse and then collapse. the entire puetz cycle last 51 trading days .
the next new moon in mid January will be the new moon before the solar eclipse
yet there is a total lunar eclipse at the end of January ( lunar eclipses are full moons )
jan 2 was a full moon and we may have seen a low of sorts and while i don’t know what effect the lunar eclipse will have on the market will have it relate to the full moon ? or where it sits ( cancer leo etc…)
so i just make a note of them and look for a relationship is all.
there are times when it works very well and times when it just fails badly.
so that is why the note.
The past few years we have been getting inverted cycles with the puetz window
From mid January into april we should see a strong move in some sector of the market. it could be a gold collapse or a dollar rally or an outright market collapse
the truth is though i do not know where i only know that the moves should be strong and the cycle lasts 51 trade days. i also know the momentum high or low typically comes in trade day 39 to 41 which surrounds a new moon.
So if we are going to see volatility increase it would make sense that the trend change comes surrounding the new moon in mid January .
the trend usually begins in a choppy up down affair and it feels like what we have been going through the past couple weeks yet it becomes more persistent as the cycle runs its course. where it becomes more exciting is the full moon after
the solar eclipse which is late feb early march. ( i dont have that date in my head )
To sum it up we should see a change of trend in the jan 9-18th time frame in some sector of the market and that trend should last 51 trade days and the cycle
ends in april .
Hopefully i didn’t confuse you
ed
lastly
i have not followed up in my research on moons in cancer etc
yet the old adage used to be the moon in virgo is bearish
there are a few others yet i don’t remember them
ED
no promises what so ever
this is just notes and ill watch this yet it
is just a correlation from the past month
and i do not have any stats other than what is on this
page to back this up .
print it and make notes going forward and over the next
few months we might see something to it .
now i have answered your question on where the moon sits
all for now
i borrowed this from this site :
https://www.moontracks.com/lunar_ingress.html
what did the market do around dec 4th -6th ?
This is just a very rough example using only 1 month
of data and just looking at where the moon sits .
It is very very short term in nature yet maybe it will
prove useful over the next month and a half .
Keep in mind i took what happened during a bullish period
and ran it out assuming we get the same thing.
since we are going to be going into a couple more bearish cycles
this should be printed out and set to one side and no matter
whether is works or not you should realize this is hypothetical
and there is no guarantee this will work at all
Date & Time (GMT) Sign
Dec 2, 2017 09:21 PM Moon enters Gemini (up move )
Dec 4, 2017 08:36 PM Moon enters Cancer ( topping )
Dec 6, 2017 08:37 PM Moon enters Leo ( Bottoming )
Dec 8, 2017 11:08 PM Moon enters Virgo (Upwards )
Dec 11, 2017 05:01 AM Moon enters Libra (Continuation up )
Dec 13, 2017 01:58 PM Moon enters Scorpio ( a high for a day )
Dec 16, 2017 01:07 AM Moon enters Sagittarius ( Up continues )
Dec 18, 2017 01:33 PM Moon enters Capricorn ( top or sorts )
Dec 21, 2017 02:29 AM Moon enters Aquarius ( top of sorts )
Dec 23, 2017 02:41 PM Moon enters Pisces ( Bottoming ? )
Dec 26, 2017 12:26 AM Moon enters Aries ( a Low )
Dec 28, 2017 06:23 AM Moon enters Taurus ( topping ? )
Dec 30, 2017 08:31 AM Moon enters Gemini (downward ? )
Jan 1, 2018 08:10 AM Moon enters Cancer ( bottoming ? )
Jan 3, 2018 07:22 AM Moon enters Leo ( see above, bottoming ? )
Jan 5, 2018 08:12 AM Moon enters Virgo ( see above upwards ? )
Jan 7, 2018 12:14 PM Moon enters Libra (Continuation up ) ??
Jan 9, 2018 08:05 PM Moon enters Scorpio ( a high for a day ) ? sun conjuncts venus… start of venus bear cycle
Jan 12, 2018 07:04 AM Moon enters Sagittarius ( Up continues ) ?
Jan 14, 2018 07:42 PM Moon enters Capricorn ( top or sorts )
Jan 17, 2018 08:32 AM Moon enters Aquarius ( top of sorts )
Jan 19, 2018 08:26 PM Moon enters Pisces ( Bottoming ? )
Jan 22, 2018 06:27 AM Moon enters Aries ( a Low )
Jan 24, 2018 01:39 PM Moon enters Taurus ( topping ? )
Jan 26, 2018 05:39 PM Moon enters Gemini (downward ? )
Jan 28, 2018 06:57 PM Moon enters Cancer ( bottoming ? )
Jan 30, 2018 06:53 PM Moon enters Leo ( see above, bottoming ? )
Feb 1, 2018 07:13 PM Moon enters Virgo (Upwards )
Feb 3, 2018 09:47 PM Moon enters Libra (Continuation up ) ??
Feb 6, 2018 03:56 AM Moon enters Scorpio ( a high for a day )
Feb 8, 2018 01:53 PM Moon enters Sagittarius ( Up continues ) ?
Feb 11, 2018 02:21 AM Moon enters Capricorn ( top or sorts )
Feb 13, 2018 03:11 PM Moon enters Aquarius ( top or sorts )
Feb 16, 2018 02:41 AM Moon enters Pisces ( Bottoming ? )
Feb 18, 2018 12:04 PM Moon enters Aries ( a Low )
Feb 20, 2018 07:11 PM Moon enters Taurus ( topping ? )
Feb 23, 2018 12:07 AM Moon enters Gemini (downward ? )
Feb 25, 2018 03:06 AM Moon enters Cancer ( topping )
Feb 27, 2018 04:41 AM Moon enters Leo ( Bottoming )
The times on the post above are in UTC
Note on the above
the date period of jan 9 to the 17th
and just for the record i only just created this tonight
so no doubt in my mind that time period should be important
as a high .
not done with this but in general since i am bearish
i am more interested in high’s of the past then lows .
im done for now
Scorpio ( a high for a day )
Capricorn ( top or sorts )
Aquarius ( top of sorts )
Taurus ( topping ? )
Gemini (downward ? )
Joe,
Wow! Thank You for a very comprehensive answer! This adds to my “base” understanding and is very educational to me. For example I have heard that full moon accompany market turns and sometimes chaos because of the magnetic pull of the moon.
I know doctors who refuse to be “on call” during full moons because according to them the emergency rooms are overrun. You have mentioned Arch Crawford so he is on my radar. Again, thank you for responding!
Joe,
At least now I am not looking for a market turn on every full moon…and not that I have been. I have come to realize that nothing works everyday, every week or every month.
morning ES update……
the ….”what if”……..chart from yesterday – is holding….
https://invst.ly/68omn
Thanxxx Luri, I appreciate your updates and perspective
If you are right, we will know by session’s end. Wave four will have to be shorter than two, and five shorter than three so it would be quite close. A move down today with a trend line throw-over and I’m in…..
the “what if” scenario for the ES………….is taking shape……and has a good look….
https://invst.ly/68rsy
Joe,
In case you missed it Luri posted a monthly bar chart of the S&P going back 30 years. The trend line drawn from theOctober 1987 low thru the October 2002 low is being tested from below.
Peter G was kind enough to precisely calculate thie price level of that trend line for month of January. It was at the 2737 level for this month. That level has my attention. Again, thanks to posters like you, Peter G and Luri.
https://invst.ly/68rye
Interesting note on your “Jaws of Death” megaphone pattern luri.
I had some cocky, and I imagine bear market virgin trader smugly dismiss my contention that mean regression applies to market price. Judging from the level of bullish sentiment we are witnessing today, I have no doubt that most folk would absolutely scoff at that possibility you cite. I finally figured out it is an complete wast of time trying to argue with anyone that rejects the idea of mean regression. There is a verse somewhere in Proverbs that speaks to that particular matter I believe. At any rate, people often forget that there are three ways in which mean regression can unfold, with price and time as the two variables. You can have price remain at current levels for an extended period of time, which would be zero price displacement over an extended time period during regression.
You can have price decline gradually over a less extended time period, again so as to complete mathematically predicted regression.
The third possibility is rapid price decline over a relatively short period, again achieving the same end.
For those of us who believe in EW theory the first option will immediately be eliminated so that leaves the remaining two.
Here is an interesting corollary what should be informative.
The long price deviates from a long term mean, the more likely it is that what you will ultimately get is not merely regression TO the mean, but THROUGH it.
Considering the extreme levels of bullish sentiment we are now witnessing,
what say ye? 🙂
verne,
my esteemed friend……….. i prefer “brazil nuts” to cashews and almonds…
;-)) said otherwise, it is unwise to poke at an active beehive…… let the bees alone, and stay quiet and small – the honey will come to you….
“nuts and honey”………….., and what you write above, i am in full and absolute agreement…….
although, it is unnecessary for me to engage the “type A” personalities that frequent all these financial sites…………… life is well too short.
Verne; Been watching this a longggg time, and yes, I also firmly believe that the longer time-wise we stay this far above the LT mean, the more likely we slice right through the mean on the next decline… Seriously so…
That said, been looking for that next decline for a while now, and been completely wrong…
I hear ya Barry. I also have been wrong in that I never expected the distortion to last nearly as long as it has, few rational people did. I strongly suspect that the many trillions that found its way into this market is above that commonly reported. Who would have ever imagined that an entity like SNB would actually print money to buy stocks??!! It is truly mind boggling. It is also true that none of us have ever witnessed a top of this historic significance and so our consternation is based entirely on past experience, and our being faced with a situation completely unprecedented. In an ironic kind of way, we really ought not to be surprised, but I have to confess the current circumstance never ceases to amaze me. While we don’t know WHEN it will ultimately end, we do have, if we remain rational creatures, high confidence that it WILL, and probably a very good notion of HOW…..”…Nothing New Under the Sun!”, as the great W.D Gann observed via the Book of Ecclesiastes 1:9…
Wave 3’s are a wave you don’t won’t to short, and that’s what we are still in. Period.
Do we have an overthrow underway possibly??!!
Looking for a new 52 week low before session close for exclamation mark….
In VIX, that is….
Peter T,
Whats your latest thought..I think we should have turned below 2700 now its at 2712..let us know your thought…thanks for sharing.
https://worldcyclesinstitute.com/webinars/
BillR, Peter offers a weekly seminar in which he provides detailed analysis on a variety of markets including SPX, and it is well worth the time and resources to get such and in depth perspective on so many markets in one setting.
As Verne stated, I’ll have a comprehensive view of the market in the Chart Show tomorrow.
no ED……its too parallel…..
https://invst.ly/68t54
a magnifying glass to the ES yesterday/today…….
https://invst.ly/68tj1
hmm…….methinks this is a better short term count……
https://invst.ly/68tw6
end of day ES — yet “another” 4 and 5….. will this be it????
https://invst.ly/68unu
Oooh…! Intetesting! Another quite rare trip by VIX below the 9.00 pivot today. It would put me in trader’s Nirvana if the move up in VIX on the next correction continues higher with a final fifth up, and breaks 15 with a close in the process. Both Peter T and Robert McHugh, two of the ablest analysts I know have us in a final fifth up at many degrees. Other very competent ones like Avi Gilburt and Lara Iriarte are convinced it is only a high degree third wave, and primarily because of no monthly A/D line divergence, a view strongly espoused by Lowry’s. The latter remain convinced the bull has at least a year, if not more to run! Of course the legendary Bob Prechter has already sounded the alarm. I seems to me sentiment supports the bearish view…
From and including: Friday, March 24, 2000
To, but not including Friday, March 6, 2009
Result: 3269 days
It is 3269 days from the start date to the end date, but not including the end date
Or 8 years, 11 months, 10 days excluding the end date
Alternative time units
March 6 2006 Plus 3269 days =
From Friday, March 6, 2009
Added 3269 days
Result: Friday, February 16, 2018
Typo March 6 2009 Plus 3269 days = feb 16 2018.
It is based on a george lindsay time count
not sure how to fit this in yet it does land very close
to the total lunar eclipse
correction again , feb 15 is a solar eclipse !
this is going to become tricky as we go forward
More work to be done
January 31, 2018 — Total Lunar Eclipse
North/East Europe, Asia, Australia, North/East Africa, North America, North/West South America, Pacific, Atlantic, Indian Ocean, Arctic, Antarctica
New Features: Path Map | 3D Path Globe | Eclipse Information
February 15, 2018 — Partial Solar Eclipse
South in South America, Pacific, Atlantic, Antarctica
New Features: Path Map | 3D Path Globe | Eclipse Information
An interesting discussion on regression by Sven Henrich AKA “Northman Trader”
https://www.zerohedge.com/news/2018-01-03/price-always-reconnects-yearly-charts-show-high-risk-accident
Timely!
Verne,
Great information! Thank you for posting!
http://www.news.com.au/technology/science/space/a-blue-supermoon-lunar-eclipse-coming-for-the-first-time-in-150-years/news-story/d55d65bf53382a94e3aa5e602e9839fd
comparison to the dalton minimum is still on track
this is a 90 day avereage of the dalton minimum vs the sunspot
cycle . updated through dec 31 2017
https://imgur.com/zg7vOh7
Verne
that was a good link , fits with your reversion to the norm
a 25 % drop definitely would make sense.
depending on all of the stocks in the dow regardless of the dow
and its 5 yr ma , we could see a further drop .
comes back to watching the major stocks in the index vs just watching the index.
going to be an interesting yr no doubt .
thanks for the link 🙂
I think we are still thinking about the upcoming market retreat in terms of a typical correction, or even a typical bear market.
Forget about all the giddy bulls. Even cautious traders who understand it is in no way normal for any market to go this long without so much as a mere 2% correction with volatility descending to unheard of levels due to a complete abscence of sellers, could still be missing the enormity of the situation. The multiple expansion we have witnessed is entirely driven by debt expansion and not genuine revenue or GDP growth. Global debt now literally dwarfs what it was in 2007 and I suspect even the slightest market decline would threaten the viability of all that mountain of IOUs issued against assets of bloated value.
If you miss this I think you are missing the main reason for the insane conduct of the central bankers. The leverage in my view has gone past the “Event Horizon”. I think about the implications and keep asking myself: “What am I missing???!!!
What would Charles MacKay think about this market I wonder…?
Todays extension lower on the $UTIL index
is cleaning up the daily chart .
it looks much better as a V wave of wave III of III
any bounce would be labeled wave IV of 3
weekly chart though has 5 waves in it .
703-696 is possible
This is what id say is a very very clean chart of an impulsive wave to the
downside which is still developing ( it may fail yet so far it hasn’t )
From an Elliott wave point of view id say this is an excellent example
to add to it i added a top to top to top to bottom count which if that
has merit call for a bottom of wave V of wave III tomorrow
https://imgur.com/9Kbj0zl
I will add one note to the above chart .
if that was in fact a leading diagonal wave 1 ( which i did not label )
leading diagonals have 1 caveat , the wave 2 is brutal .
Keep the weekly chart in mind is all.
What a Multi Year Textbook Triangle looks like
and it is not always just a short pop once it completes.
longer duration’s imply a longer term thrust .
note the overlaps , these are key to true triangles.
https://imgur.com/pIVinli
Last example of what id call a multi year true triangle
yet has not as of yet really thrusted as it .
Holding above the wave E low is key yet
the wave C low is what keeps this stock with in
a triangle formation
https://imgur.com/ySKeIBP
Last comments on triangles .
all of the stocks posted i own
i also traded alcoa into its top in 2007
alcoa monthly : Near the top in 2007
https://imgur.com/SMqu6du
Verne you say you love triangles
So do i , im just a bit anal on their formations is all
The Triangle 2 ??
Microsoft in 1986-1989
its just worth thinking about triangles in different wave positions is all.
the mantra is they only show up at the end but the dont .
https://imgur.com/GG1Trv7
morning ES “glance”…..
https://invst.ly/690-t
there is no “finishing” look to these waves…….. https://invst.ly/692r9
ES hit 2729 with a long upper wick…so far….
https://invst.ly/69401
that was supposed to be the final wave??? really??
???
https://invst.ly/69412
Unsure. Price has broken up from what looks like a bull flag. I will re-sssess if we close above 2730.
Looking like 2700-2709 is now ES support.
Today’s Chart Show may be a really important one.
suspect so…:)
IF the $nya hits 13220 i will re short the market .
This is becoming ridiculous yet there is no proof of a market top .
$UTIL appears to have made a swing low today
Through the looking glass…!
$TRAN gave up todays gains
https://invst.ly/694qj
ok, readjusted the close up count for ES.
This website is for educational purposes relating to Elliott Wave, natural cycles, and the Quantum Revolution (Great Awakening). I welcome questions or comments about any of these subjects. Due to a heavy schedule, I may not have the time to answer questions that relate to my area of expertise.
I reserve the right to remove any comment that is deemed negative, is unhelpful, or off-topic. Such comments may be removed.
Want to comment? You need to be logged in to comment. You can register here.