
 Down — Almost Right Across the Board
All the assets for which I do video report on a daily basis are setting up for a turn early in the week. It’s been a long haul and once again, it underlines the difference between trading success and losing consistently: Sitting on your hands.
Or, if that’s too tough, phone a few friends and get them to help you form a locked ring of hands. It might not be a lot of fun past about a minute (depends on who your friends are!), but you won’t lose any money!
The point is that way too many people over-trade. You want to wait for set-ups. Whenever I’ve lost money, it’s because either:
- I’ve had a winning streak and became invincible in my smallish mind, or
- I’ve jumped into a trade that “looked simple and lucrative” without doing my proper homework, or
- I’ve listened to someone else, rather than me.
But the most common reason is simply over-trading. So, have a plan; better to have a system, and follow it religiously
_________________________
The SP500
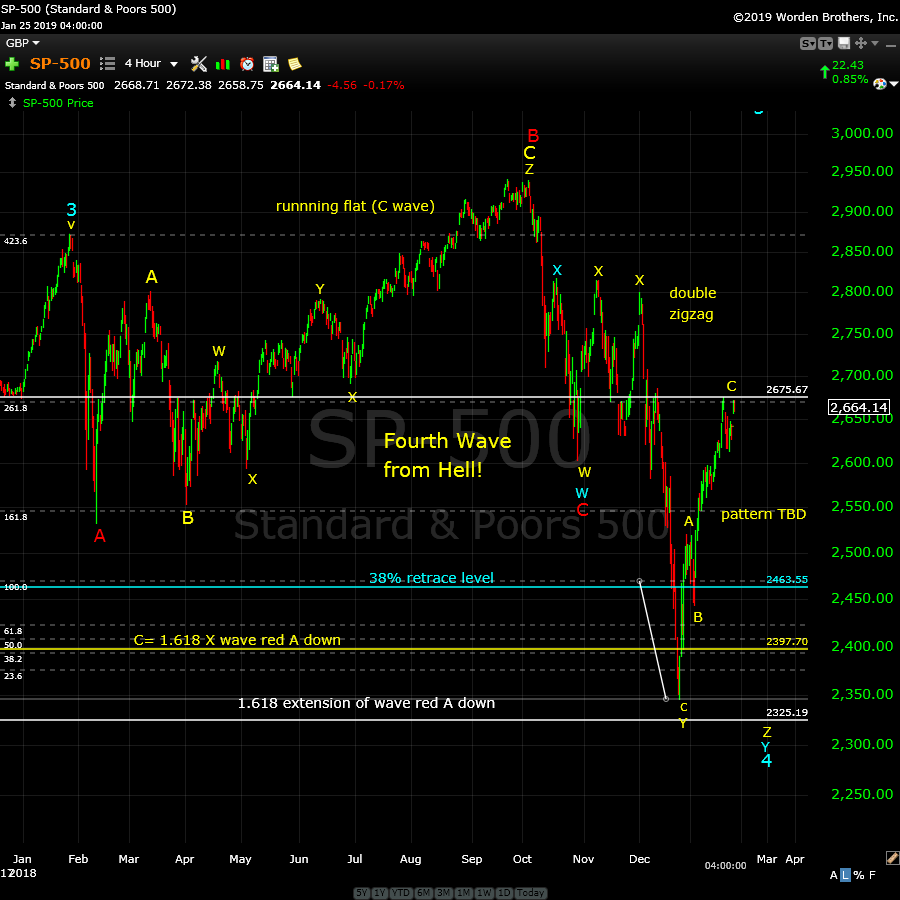
Above is the four hour chart of the SP500. It would be difficult to interpret this any other way than a great big corrective wave up and a great big drop to come (although there some professed Elliott-wavers out there that have either way more imagination than I have, are on medication I’d like information on, or have no idea what they’re doing). All the US indices are in obvious corrective waves to the upside.
Open interest (the put/call ratio) is at about .27 (under .50 is bullish) and so the most of the dummies out there think we’re going up. The herd is almost always wrong, in life, trading, and Las Vegas.
This particular wave down will be the parade I’ve been waiting for. Almost all assets classes are going to participant, along with a host of international indices. It may end being a bit of a “show.”
So, watch for turns in oil, the US dollar, USD currency pairs, and US equities, to name a few.
Now, let’s not get “all jacked up” about a crash. The waves down are corrective … all of them … from January 29, 2018 until now. That means we have another wave up to a new high. It’s a fifth wave, and every wave pattern since the beginning of the stock market, across any index you care to speculate on, has had one at the top of a bubble (or any other top, for that matter).
Know the Past — See the Future.
_______________________
Elliott Wave Basics
Here is a page dedicated to a relatively basic description of the Elliott Wave Principle. You’ll also find a link to the book by Bob Prechter and A. J. Frost.
____________________________
Registration for Commenting
Want to comment? You need to be logged in to comment. You can register here.
If you register, it protects your information. It also allows you to comment without filling in your information each time. Once you’re registered, simply go to the home page and click on the login link top right in order to log yourself in. Usually, you’ll be logged in for several days before needing to be logged in again.
______________________________
Problem receiving blog comment emails? Try whitelisting the address. More info.
______________________________
Rise above the rest … SM 2
Rise above the rest …I have only ever met a few people who, in their chosen fields (astrology, medicine, music, martial arts, technical analysis), rise above all the rest and you are one of them…you have ‘the gift’…and that’s why I’m a Trader’s Gold member. —SM |
A true expert in Elliott Wave FL 2
A true expert in Elliott Wave …You are a true expert in EW analysis. What you provide is not available anywhere and is priceless. Subscription on your services is the best thing I have ever done. Many thanks for your effort to make me a better investor. I now have more trust in my investment decisions. I hope you will continue the excellent work! —FL |
the real deal SM 2
The real deal …‘Educational, insightful and thorough market analysis for all levels of traders. It’s Elliott Wave at its best….Peter Temple is the real deal’ —SM |
The best of them JL 2
The best of them …Last couple of years, I subscribed to several ‘market traders’. You are by far the best of them and the personal contact is awesome. Daily and daily updates are very well written! Besides your expertise in EW, I also like your cycles analysis. Best investment I ever made! —JL |
Have not had a losing week RW 2
Have not had a losing week …I have been with Peter almost a year. The only thing that matters is have I made money with his service. I think I have finally turned the corner using Peter’s EW. I have not had a losing week in the last 5 months. Thanks Peter, for your amazing amount of hard work. —RW |
Tops in your field DZ 2
Tops in your field …You are tops in your field. Tried to follow Elliot Wave international for years. They were always behind the market. After discovering you, I perceive that you are an expert in reading the waves, which puts you way ahead of the rest of your peers. And you can read the Waves like you are reading tomorrow’s financial section. I pray you stay healthy. —DZ |
Get an upper hand … JC 2
Get an upper hand in trading …Seeing all the different currency pairs and the wave structures and hearing you explain why this has to do that on a nightly bases gives one a upper hand when trading. Elliott Wave applies to all stock and indices and can be applied to any candlestick chart. If someone ask what you want for Christmas – Tell them a membership to Peter’s “Traders Gold!”—JC |
Couldn’t be happier … KK 2
Couldn’t be happier …The analysis and insight you provide is simply amazing! I’ve been trading the futures and equity markets for well over thirty years and usually average around 5% monthly. Since joining your Traders Gold Service two months ago, that number has better than doubled. I couldn’t be happier.—KK |
US Market Snapshot (based on end-of-week wave structure)
Here's the latest daily chart of ES (emini futures)
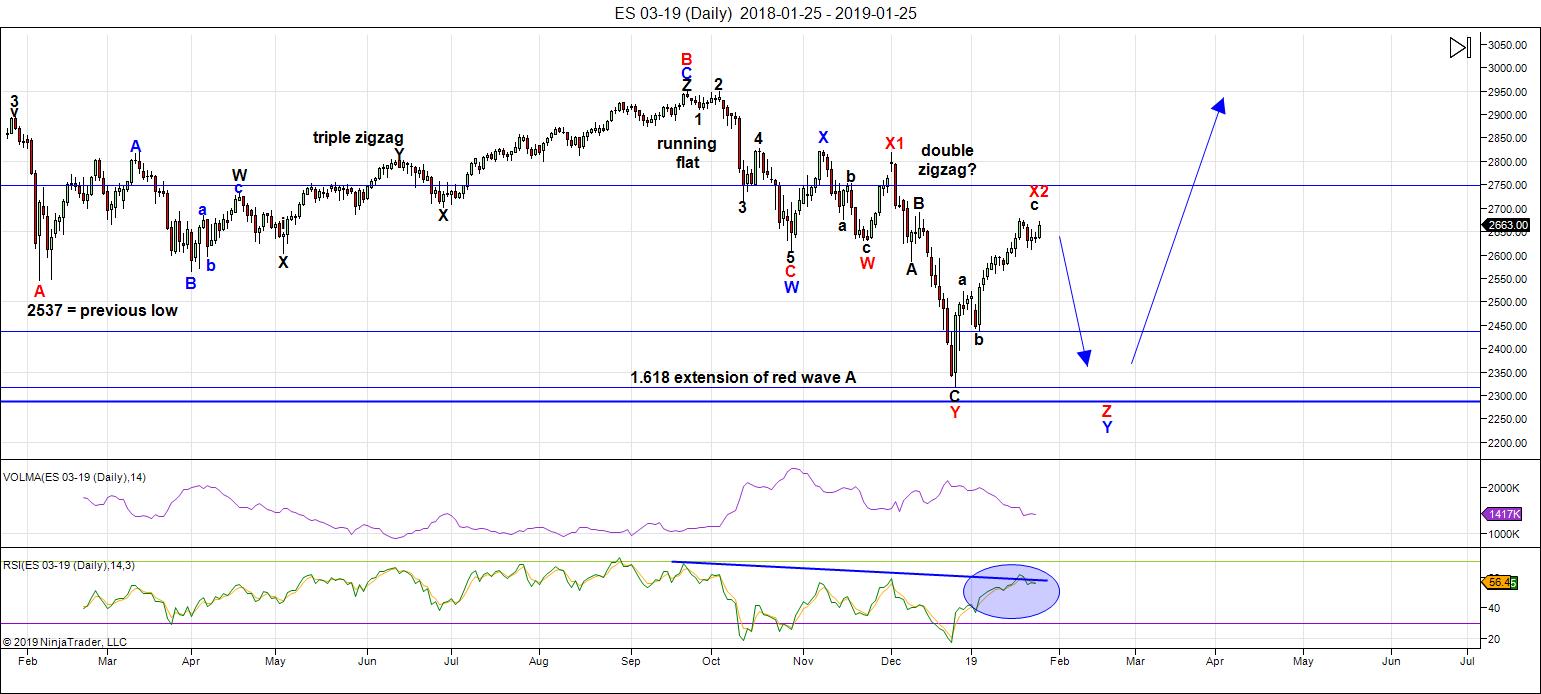
Above is the daily chart of ES (click to enlarge, as with any of my charts).
The current huge countertrend rally has lasted five weeks, but now we're all but done.
I've been expecting a double top, but how it was going to happen, and when, has been the question. Over the past couple of days, those questions have been answered, for the most part. I'm looking for a top of this monster rally early in the week ... finally.
I have fibonacci ratios at our current top in the NYSE and SP500. ES has been difficult to pin a top to, because the measurements aren't working out, but that's likely because the length of the wave up in futures is different than that in cash: They have different starting levels at the very bottom.
The final pattern to the downside is still up in the air. I would expect a zigzag to the downside, but with such a large rise, and with only two patterns determined so far in this large fourth wave, there are other possibilities. However, with along currency pairs, the US Dollar, and Oil all expected to turn at the same time.
The downside target at the moment is the previous low at approx. 2318. We could drop lower, but this level is a fibonacci level which is a common stopping point for a fourth wave, and I have nothing to support a further drop (doesn't mean it can't happen).
Summary: My preference is for a dramatic drop in a zigzag (5-3-5) pattern to complete a triple zigzag with a wave at least to the previous low that could start as early as Monday. The culmination of this drop should mark the bottom of large fourth wave in progress since January 29, 2018 - almost a full year of Hell.
___________________________
Trader's Gold Subscribers get a comprehensive view of the market, including hourly (and even smaller timeframes, when appropriate) on a daily basis. They also receive updates through the comments area. I provide only the daily timeframe for the free blog, as a "snapshot" of where the market currently trades and the next move on a weekly basis.
______________________________________
Sign up for: The Chart Show
Next Date: Wednesday,February 6 at 5:00 pm EST (US market time)

The Chart Show is a one hour webinar in which Peter Temple provides the Elliott Wave analysis in real time for the US market, gold, silver, oil, major USD currency pairs, and more. You won't find a more accurate or comprehensive market prediction anywhere for this price.
Get caught up on the market from an Elliott Wave perspective. You’ll also get Andy Pancholi cycle turn dates for the SP500 for the balance of the current month. There’ll be a Q&A session during and at the end of the webinar and the possibility (depending on time) of taking requests.
For more information and to sign up, click here.
| "I think you are the only Elliot Wave technician on the planet who knows what he's doing.” |
| m.d. (professional trader) |
All registrants will receive the video playback of the webinar, so even if you miss it, you’ll be sent the full video replay within about an hour of its conclusion.


Hello Peter,
Please excuse me for asking the question in the wrong article. I have posted it on the relevant section.
I always enjoy reading the material posted on your website, it’s refreshing and different to what’s available online. I have a question, in which I hope you can please answer. You posted an article called the “Next Up: Down!” I noticed the B wave of the running flat had a three wave structure ABC. The C wave was labeled as WXYXZ. Shouldn’t the C wave have a five wave impulse move? I’m asking this question because I want to understand properly how the corrective wave structure works. This was never mentioned in the book or explained. But I have noticed in a number of markets the wave structure occurs in this format.
Many traders have labeled the B wave top as a five wave impulse structure. This must be wrong since the market is rather choppy, the suppose third wave didn’t accelerate enough and wave 2 didn’t even retrace to the 38.2% level. Obviously, this must be corrective.
I hope the holiday season was pleasant.
Omar,
Let me start by saying that there are a lot of errors in “The Elliott Wave Principle.” I’ve written about many of them before, but I haven’t spent a lot of time on the issue of “5-wavers,” and the difference between the two types. It isn’t addressed at all in the book. In fact, even though impulsive waves are addressed, the book doesn’t give the wave measurements the import it deserves. I’m not going to address all of this here, but I will do a brief overview of the difference between 5-wavers.
There are two types of 5 wavers – “simple” and “impulsive.” Impulsive waves are actually very rare and are only found in trending markets, not corrective ones. The rules for an impulsive wave are very strict: Waves 1, 2, and 3 must have 5 subwaves, the wave must have “the right look” (the correct proportions) and the lengths of all the waves must measure to the correct fibonacci lengths.
Since 2009, we have had no impulsive waves in the NYSE indices. However, we have in the Nasdaq-related indices, but only on the way up from the low in 2009.
Simple 5-wavers are found in corrective waves, are not impulsive by any means, but often their fibonacci subwaves will have impulsive wave ratios. You can find “simple fives,” as I like to call them in A, B, and C waves (ie – in any corrective wave).
In the corrective wave structures, you will never find impulsive waves, so here are the obvious corrections to the book:
So, to your question. C waves are never impulsive waves; they can be “simple fives,” or 3’s, or some other pattern, like an ending diagonal, for example. They can be anything they want to be.
Where a lot of confusion comes in, I think, is that the convention is to number impulsive waves the same way we label “simple fives.” However, one is in a trending market (impulsive) and has VERY strict guidelines and the other is in corrective patterns (simple five) and has no guidelines, other than the fact that you must be able to count 5 waves within them.
The difference between these waves isn’t even addressed in the book and it took me a couple of years early on to prove the difference and refine my own set of rules around them. So, the book is a good start, but Prechter and Frost made changes to Elliott’s work (and some assumptions) that they should not have made. In any event, as I consider the Elliott Wave Principle to be a science, like any science, it evolves as we study it more and truly understand the intricacies. Too many have taken the book at face value, a book written decades ago.
Now to WXYZ labelling: When a corrective large pattern (could be a large C wave) has individual patterns within it, we use the WXYZ labelling. This denotes a more complex structure. For example, when a C wave is composed of 3 zigzags, each of those zigzags should be delineated by a W, Y, or Z. The ends of each subpattern are labelled with an X.
Getting to your last comment about the B wave at the top of the market. Very obviously, it cannot possibly be an impulsive wave up — that’s an absolutely ridiculous conclusion, based solely on the requirements of an impulsive wave. And that’s only one of several reasons it can’t possibly be one — the waves adjacent preclude that opinion. I’ve seen a few ludicrous labelings that I can only just laugh at. It shows a complete misunderstanding of the basic rules of the Elliott Wave Principle, even with the errors in the book.
Hope this helps.
Thank you for sharing your work and experience with us.
You’re welcome, Skippy.
Amen..you speak the truth…it will be worth the wait..
1/28 will be 6 PI-years from the march 2000 high. Think this is the real cycle. So Monday will be signifcant. But 1/29 will be a low so I expect some consolidation into month end. In 2016 2/1 was a high so a 3 year cycle points to 2/1 2019.
Venus velocity is bullish into q3 2019. 90 years (90 degrees) from the 1929 high also point to q3 2019.
I expect the low in march before we get the last leg up into q3.
Thank you, for explaining the difference, it made perfect sense to me.
Good … and thanks for moving the original query.
In 1929, Oct 18 was a full moon. SE was Nov 1. As far as Puetz views the 1929 crash, it achieved the 2nd most likely eclipse scenario (6 week topping pattern where peak was two months prior to SE). As I have mentioned in the past, everyone is too fixated on the normal blueprint when there are variations on a theme. And I feel it is a mistake to conflate seasonal and eclipse considerations. He may have done this in the past, but to the best of my knowledge he has not written anything along those lines in over ten years, so I think it is best to ignore the specific seasonal dates and instead focus on the idealised eclipse cycle and its common variations, if we are specifically referencing Puetz.
Dan, I’m not quite sure what your 1929 dates are attempting to do. The pattern fit in virtually perfectly with the Puetz crash setup scenario. Are you saying it didn’t? The crashes begin around the full moon at or within one full moon cycle from a lunar eclipse full moon. You note the lunar eclipse was on 11-17 (I have it on the 18th but that is immaterial) and as you noted above, the solar eclipse was 11-1. I have seen no mention in Puetz research that writes about THE peak. He was interested in the secondary price peaks (Wave 2 tops?) that led to the crashes. So while you are right that THE price peak on 9-3 on the DJIA was two months prior to the solar eclipse, I have never seen Puetz work discuss that. If you have, I’d be curious to see it. You also mentioned the “2nd most likely eclipse scenario.” I have never seen Puetz work rate the likelihood of different scenarios. Again, I would be curious to see that. I communicate with him from time to time so if there is a question we need a definitive answer on in terms of his research, let me know. My reading of 1929 was it was a virtually perfect Puetz setup…an initial low off the 9-3 high on 10-4… a secondary rally to 10-11…10-4 low close broken on 10-19, within 24 hours of full moon (within one cycle of eclipse full moon), then 2 sideways days, then price acceleration into crash. He did, indeed, write about the seasonal factors and it was indeed over 10 years ago, but so what. Does that negate the research? I do agree with you that there is too great an emphasis on perfect setups and that we would probably be better served if we look simply at the basic premises and setup i.e. like so much in the market, look for rhymes, not duplicates. 🙂
The peak of his eclipse cycle is the new moon prior to the SE, and that the secondary top is usually the full moon/LE after the SE so that a 6 week topping pattern is seen, followed by what is usually a 2 week panic but not always. However, the eclipse cycle can play out one new moon early per 1929 so that the peak there was two new moons before the SE and the crash kicked off around the FM prior to the SE. You’ve also had cases where the topping pattern takes ten weeks and not 6 per the idealised cycle. HK 1997. And you’ve also had cases where the market blows off into the FM/LE and then crashes. All these variations fit within his eclipse (aka crash) setup per his newsletters/book which is something most are unaware of.
The idealised cycle is really just an average of all eclipse cycles and its plays out every eclipse. Its just when emotions are running high, geomagnestism has a significant impact on price action so that the real big crashes are almost a replica of the idealised cycle with some minor variations whereas in other bear markets/mini panics there is a bit more variation.
No brainer trade on SPX triangle. 100 contracts of SPY 262.50 Jan 30 puts at 1.40 per contract.
This trade should return an easy double.
I love triangles! 😜
Sold half for 2.15….
Peter G and Dan
Thank you both for your thoughts on puetz.
as I noted before I’m going to leave this subject alone .
I’m glad we all have been able to share our views .
Peter g
I’ll finish by just saying that I have mentioned before
I have not read much of Steve puetz writings
What I have done is I took what I believed he wrote
And I took Chris carolans work and I compared them
In several different years to check on both of those
Theories accuracies . In that study by looking at actual
Market history I formed a few opinions and by digging
Further I formed my own opinion .
So based on our discussions we have different views .
I understand where your coming from and that you have
had discussions with Mr puetz.
I have not ever had a discussion with Mr puetz nor have I had
Any discussions with Chris carolan .
I respect their work though and if I am discrediting them
By my observations using what I believe to be their work
Then I feel it is best for me not just not touch the subject .
I have found cycles with in cycles using both of their work
And I have discovered a few patterns as well which I have expaneded
On for my own use .
Now as for another reason I’m going to leave this subject alone .
Here is the list we get to deal with for the next 2 years .
It’s not going to be so simple getting all these turns correct .Jan 6 2019 solar
Jan 21 lunar
July 2 solar
July 16 lunar
Dec 26 2019 solar
Jan 10 2020 lunar
June 5 lunar
June 21 solar
July 5 lunar
Nov 30 lunar
Dec 14 2020 solar
Today
The cash Dow gapped to the downside on the open
And while it took a bit it did in fact reverse back to the upside
.The proof in the pudding will be a follow through day tomorrow
To the upside .
If that takes place it would call for a Feb 4 high as well as a Feb 13-19 high
And most likely a March 5 high .
I do not have high confidance in this call .
It is just a very strict technical call using timing .
How this actually takes place I have a hard time believing
Yet that is why I posted the 2 scenerios in the previous thread .
My work involves calling the market for an entire year in advance .
It’s not an easy task.
Tomorrow is another day .
Joe, I am definitely not an EW guy but it sure looked to me like a 3,3,5 move off the morning’s lows. That imples not “follow through” tomorrow, but a lower low prior to any serious tradeable bounce. Not sure how this comports with your own astro turn dates. I guess we could be seeing a small c of a larger B wave, to be followed by a larger C up. Just thinking out loud here…
I have to say I admire you guys that know quite a bit about how astro cycles affect price action. I wish I knew more about the subject. The only way I have found t0 effectively trade this market is to scalp the moves. Directional trades in this market, with the exception of the recent counter-trend rallies has been a sucker’s game. I would not be in the least bit surprised to see yet another island reversal gap filled.
Crazy market!
Hey Joe, Peter G
Email me at clubrioinc at yahoo dot com dot au if you are interested in sharing ideas on Puetz/Carolan etc in a less public forum where we can thrash out ideas more freely.
Overnight triangle in ES. The crooked bankstets know traders are expecting a downside break so look for a false upward break to dislodge the early birds! 😉
They are so predictable it’s not even funny.
Reloading SPY 162.50 strike puts for Feb week two….ramp is a gift….
Taking the money and running. Trader whipsaw is the name of the game. I will continue to aggressively sell the rips. It is the only intelligent way, imho, to trade the current environment. If you know how the banksters think, you know how they are likely to behave… 🙂
I have started trading around my shorts as well. A series of 3 wave moves in both directions. My own methods (non-EW and non-astro) point to a low close to the previous low (2320 area) sometime in mid to late Feb. But the move from here to there can be very choppy with multiple retracements. The most common EW pattern I have seen historically in this kind of condition has been triple zig zag, but I am completely open to Peter T’s idea of seeing a 5-3-5. Nasdaq is at the cusp of a head and shoulder top. With FOMC coming up tomorrow, its very easy to see whipsaw moves between now and friday.
Yep. Elliotticians will have a tough time finding good entries. Quite right about the three wave whipsaws. This a scalper’s market with almost month-long waits for good swing trade opportunities in the indices. We do have some developing bearish divergences…but I agree the grind could continue for some time, as we have seen….
Verne
Feb 4 is Monday
If this continues and I’ll admit I’ll be amazed
Yet if . Then a volitility spike is due on Tuesday
Wednesday another reversal back up yet signs
Of momentum loss should show up .
Basically Tuesday should be a LARGE DROP .
As we enter mid Feb the market should begin
To roll over to the DOWNSIDE .
March 5th is the start point of a new cycle which
Can go either way yet more times than not it’s a high
Followed by a decline .
We had a hint in December of an extended move based
On that cycle .
The norm would be a drop from March 5 to March 15
Yet the extended versions goes into early April .
I cannot call this in advance yet ……
I’m not finished running everything ( it’s time consuming )
All I can say is
Earlier April ( April 5 ) is where I need to focus on next
And in thinking out loud with no opinion it is something
I’ll need to do some more actual market research on .
April 5 is the first new moon following the spring equinox
March 31 moon at apogee .
Between now and late May early June is where I’m a bit confused
So as much as I have had some fairly to very accurate calls over the past several
Months at this point I’m not su sure .
Feb 4 a high of sorts Feb 5 DOWN HARD Feb 6 some kind of fake out DOWN then Up
Then flat mkt or VOLITILITY COLLAPSE but not that bullish in terms of point moves .
The cash Dow may have already printed it’s price high for this leg up .
Call it a distribution period ?
That’s it for me for a while
Dan Goulding
I’ll note your email .
At the moment I’m at sea, just leaving long beach California on our way back to Portland
Oregon . I’ll send you a message when I can yet this discussion would be more informative
In the March April time period when I’m home and can show refrences .
Thanks for the invite .
Peter T
I found this latest post one your your best . Overall you covered a lot of ground
And your comments on the message board was well put .
Plan your trade trade your plan , wait for the setup and all of it is what I’m getting at .
Thank you times a million : )
Joe
Joe you could be right about that. I tend to try and structure my trading around pattern recognition, more so than EW counts as I second-guess myself trying to determine what the correct count should be and generally get it wrong. It looks to me like ES is tracing out a large triangle on the 5 hour chart. If that is correct, it will make an UPSIDE break…..
Hello Peter,
My EW count has certainly improved with your explanation of corrective waves and I have a nice short position on the SPX and Nikkei. Thank you, once again for opening my eyes. I have another question when you look for market reversals do you apply Fibonacci numbers (years) in your analysis? For example, the SPX bull market began in 2009, and it turned bearish in 2018, the duration was 9 years, one more than Fibonacci number 8. The number 9 is an Ichimoku time theory number. Hidenobu Sasaki one of Japan’s greatest speculators was a keen advocate of the theory.
For example, when I look at your chart I can see the Ichimoku numbers. From wave X (red) to wave Y (red) it took 17 days to complete. The same outcome occurred in wave Y (red) to wave X (red). The number 17 is an Ichimoku time number. Sanjin Hosada only advised using the time theory on the daily, weekly and monthly chart.
Hi Omar,
Well, that’s interesting about the ichimoku time numbers. I’ll have to google and find more info. I don’t use EW time cycles, because they don’t seem to have a great level of accuracy on a short time scale. Years, yes, but often, it’s a plus or minus one year adjustment.
Hello Peter,
Western sources on this subject are quite distorted. Anyway, I will give you the numbers. The Ichimoku numbers are 9, 17, 26, 33, 42, 51, 65, 76, 83, 97, 101, 129, 172 and 200-252.
If the market showed an anomaly then Sanjin Hosada introduced the concept of equalization. He had his own wave system similar to Elliot Wave but its more limited in my opinion. One of his wave patterns is called an N wave. This is similar to a zigzag pattern in EW.
I will give you a hypothetical scenario in how the theory of equalization works. If wave A took 19 days to complete this is an anomaly because it wasn’t an Ichimoku number. Wave B took 9 days to finish and this was an Ichimoku number. The expected completion of wave C will either be 9 or 19 days.
I found a couple of pages on it online, so I’m going to study it. Thanks!
A few years ago through inter-library loan, I borrowed a copy of Nicole Elliott’s book on Ichimoku. This one looks close: https://www.amazon.com/Ichimoku-Charts-introduction-Harriman-Trading/dp/1897597843. She wrote that the lines and patterns were great but that the most overlooked part of the strategy was the time counts. Gann was big on time counts, too. (I also found her last name interesting….). And now, I see that she has some YouTube videos.
For what it’s worth.
Every now and then when I try to point out triangles in the market other traders will correct me in pointing out that the rules for them are very specific.
I fully agree.
At the same time rules do not help us as traders if we get market direction wrong.
While a sideways consolidation may not technically qualify as a triangle, the outcome is generally the same, namely a continuation pattern with price tending to break in the direction from which the consolidation began. Just my two cents…
don’t know if this means anything but the NYA and Indices have topped pretty much 44 to 46 days after each top of the Baltic dry index since December 13, 2017
If that holds that would again put us at its high by the end of the week for the indices, which seems to be align with many of the things timing wise ..I am curious to see if their is follow thru on that this week..
That sounds about right to me Marie. We need some time for a thrust from this sideways consolidation before we see an interim top imho…
For those of you who trade around Fed announcements, here is a great piece of research from Rob Hanna of Quantifiable Edges…with what were to me surprising results!
https://quantifiableedges.com/why-waiting-until-the-announcement-is-a-tough-way-to-trade-the-fed/
It is axiomatic that whatever direction the market sprints in response to FEDspeak, it will swiftly be reversed…
Thanks, Peter G.
Peter T
Just a thought on the ES .
Have you compared the charts of the front month only
To the continuous chart ?
Not sure of your data provider but some roll the new contract
But it’s just a continuation of the previous front month .
Hence the Dec futures contract might and probably does show
A different price high then the current March contract .
The cash spx though does not do that .
Just saying that might help pin the fib levels .
Food for thought is all .
Omar
You are a breath of fresh air
Thank you
I’ll definately have to research further .
Are you aware of any books on the subject written in English ?
Thanks for any info in advance
Joe
https://www.youtube.com/watch?v=fco7je6i2Rc
https://www.tradeciety.com/the-complete-ichimoku-trading-guide-how-to-use-the-ichimoku-indicator/
Hello Joe,
Every single book on Ichimoku in English is useless. Nicole Elliot’s book introduces the concept of price, time and wave theory, however, there are so many flaws and respectfully she has no idea.
In the west, traders believe the Ichimoku tools are the most important, but quite frankly this is wrong. These tools were used by Goichi Hosoda as a buy or sell signal, not to forecast the market. Much of his life was spent on refining those three theories rather than developing the tools.
I’m curious by nature. I wanted to know who has used this model successfully. The name that crops up within the Japanese community is Hidenobu Sasaki, regarded by many as one of the greatest speculators in Japanese history. He was the best traders in Japan for 15 years and had the ability to predict market reversals on a consistent basis, the crash of 89 is a prime example. He was taught by Goichi Hosoda.
Hidenobu Sasaki wrote a book in 1997, considered the bible in Japan. He introduced the wave pattern 4. In Ichimoku wave theory you have I, V, N, P, Y, S and 4. Furthermore, he expanded on the price theory. Originally, you have N, NT, V, E. But Sasaki introduced 2E and 3E. He was a master of time theory. Of the six chapters in his book only one was used to explain the Ichimoku tools, the rest were about the core pillars.
Tetsuo Hosoda (Grandson) of Goichi Hosoda has stated many times that time is the most important aspect of the theory, it can be used to predict market reversals and acts as a GPS for when to buy who sell.
The current leading practitioner of Ichimoku is Yutaka Yoshino. He was the first apprentice of Hidenobu Sasaki studied under him for 10 years and is the Chief Technical Analysis of SMC Nikko Securities.
My recommendation is to read Japanese websites translate some of them to get an idea. But if you really want to understand it then translate Hidenobu Sasaki’s book. I’m going to do this in the future because combing Ichimoku with Elliot will make it a powerful tool to trade the markets.
We have the thrust from the triangle so I will be unloading calls at the open. Took the money and ran on ES contracts.
Triangles used to be penultimate wave patterns. Every one I have seen recently has led to higher prices. Many things in this market have changed, and traders simply have to adapt to survive. I am not going to assume the current thrust is terminal as that expectation has recently, strange as jt is, been clearly repeatedly negated. Strange times!!!
I agree Verne, and the shutdown has delayed reporting that is important to traders and businesses. So the markets are meandering upward and downward in a la-la land. It could be some time before numbers come out (or they will claim insufficient data). Hard for the market to be forward-looking in this environment.
Lol! I am only too happy to make a little coin off these whipsaws. After all, we trade to make a profit, not be impeccable about market theory, right?
Having said that, this gap higher is unimpressive. It penetrated the area of a previous downside gap and is facing resistance. Closure of that gap would imho warrant another upside scalp.
Gap filled…BUT, bearish divergences persist. Ramp higher appears to be sound and fury.
I am selling this rip via Feb 4 265 strike puts. 1/4 full load with plan to scale in on any move higher, stop at 2720 close
…Yikes! These banksters are busy as beavers!!! 😉
New highs means five off December lows.
Price is what it is….
Even with five up off the Dec lows, a short side trade on a possible 62% retrace once this move up completes is a no- brainer!
The key is not to over- stay your welcome!😁😁😁
3/4 fully loaded. Holding final 25% for a green VIX print. Hard stop any CLOSE above 2720.
Taking a break from forum life.
Best of trading success to everyone. Bye!
I have a nice trade on USoil. The Wave 2 of wave C is currently an expanded flat. There was also a clear Y wave, which was a good indicator that the market was going to reverse with an N wave. On the 1 minute chart there is divergence, so wave 3 seems have finished.
The third wave became extended, I expect the market would target at least the 50% retracement level at 53.099.
This is really a difficult market as Peter T has been pointing, I know we had been looking for a down move from 2531..we are some 150 points away and now with FED U turn I am not sure where we end up.
Peter T – Wanted to see your thought on latest market action, Do you think we still revisit 2350 or is there something else brewing.
Oh, I think we’re going a lot lower than that. You don’t typically get a B wave like this without dire consequences on the other side.
USoil: Volume is steadily decreasing which means the final leg of the third wave should complete. Due to the bearish strength, I expect the market to target the 61.8% level instead of the 50% zone. The trend should then continue upwards.
SPX: There’s a good probability that the B wave top has been reached. The N wave target has been reached and it fits quite well with Ichimoku time principle. There is divergence and volume has decreased.
Blog/Climate
Posted Feb 1, 2019 by Martin Armstrong
There is a town named HELL in Michigan. It has actually frozen over. There were more than 3,600 flight cancellations and more than 14,867 delays. This extreme cold weather coupled with the shutdown will mean that the 1st quarter numbers in the US economy will also turn down sharply. Temperatures dropped into the mid 40s here in Tampa and I went to the movies to see a feature and there were at best 8 people and nobody on the road even down here. Power companies have been asking even General Motors to suspend production due to extreme temperatures. While Hell freezes over, the GDP of the US economy will decline and that is very bad news for the rest of the world that depends on selling things to American consumers – especially cars.
I suppose we failed to drive our cars enough to warm things up or it must be a new secret weapon of Russia that the Democrats can investigate and somehow link to Trump.
February 1, 2019, 6:26 am
Hi Peter, I have my most important indicator back. Since September I had to do without it. O.K. To the point and as confirmation of youre forecast:
There is from this moment a huge decline into Tuesday/Wednesday. (zig/zag?) I have not seen this large movement before. Then up and on Wednesday down again. Probebly into the weekend.
Trade safe 🙂
http://www.prognoseus500.nl/
Willem,
Was looking at your site. I had picked a possible timeframe of mid to end May for a bottom of this fourth wave, based upon a very possible drop to 1800 in ES. It’s nice to see your Bradley chart with the same dates. I’m not as focused this weekend on the short term, as I know it’s heading down very probably Monday. More looking at the longer term right now. Thanks for the update and your work.
VIX closed below 1.4 Bollinger Band yesterday. Looking for a close back inside the band as a sell signal for SPX. Another interesting market – India. a 61.8% perfect retrace on SENSEX (still about 2% away on NIFTY). It does seem like a lot of markets around the world are setting up for a decline in the coming days. I will wait for some sort of confirmation before adding to my shorts.
Baltic dry index suggests a decline about to start too
On SPX…is this a 3-waver or 5-waver up from the 2346 lows?
If 5-waver, I’m calculating SPX could go as high as 2,787
Omar
I’ll look for the Japanese version. Thank you for pointing me
In the right direction .
Misc
The move in the cash Dow from the Jan 22 low looks like some
Kind of extended wave. I don’t have good enough data to define it
Yet my gut says part of and extention of a 3 rd wave .
From the Dec lows I see 1 2 3 and this move from Jan 22
Being I ii and I’ll assume ( not a good thing ) this last leg being
A iii of sorts . Bottom line it’s still only 3 waves up from the Dec lows .
I can be wrong and the simple count being an incomplete 5 wave structure
Yet I don’t know so consider my thoughts as a grain of salt .
Monday is Feb 4 and Tuesday should be down hard , Wednesday
A drop then bounce . From Wednesday on I am not going to try to call it.
Feb 13-19 th a strong cluster in time hits . Feb 13 th specifically I’m not convinced
It’s a high or a low . All things being thought out , this ” crash cycle ” has been fairly
Accurate to call yet it brought panic buying vs panic selling .
This cycle is now coming to an end ( Feb 13-19 th yet Monday Feb 4 is the momentum
Peak date ) so the market should see a volitility spike in Tuesday and maybe part or Wednesday
The a volitility crush yet with momentum turn down .
The next cycle begins March 5 th and can run into early April yet I need to see the set up
Before calling it .
Bottom line : Feb 5 into Feb 13-19 is to be expected as sideways slop , March 5 to March 15
If typical would be down yet based on Dec 2018 I’m leaning towards late March into early April
As a low of sorts .
All for me
Joe,
No problem, I’m always here to discuss more things on Ichimoku, so don’t hesitate to ask. What method do you use to analyze and trade the market?
From a very capable EW friend up out of Toronto
http://imageshack.com/i/plsmS0Vnj
My own work (non EW) is in close enough accordance.
I consider posting other people’s bad EW counts on this site like coming over to my house for dinner and telling me I’m full of crap. Just so you know.
A new weekend blog post is live at: https://worldcyclesinstitute.com/the-eve-of-destruction/
This website is for educational purposes relating to Elliott Wave, natural cycles, and the Quantum Revolution (Great Awakening). I welcome questions or comments about any of these subjects. Due to a heavy schedule, I may not have the time to answer questions that relate to my area of expertise.
I reserve the right to remove any comment that is deemed negative, is unhelpful, or off-topic. Such comments may be removed.
Want to comment? You need to be logged in to comment. You can register here.