Update Friday, July 15, After the Close
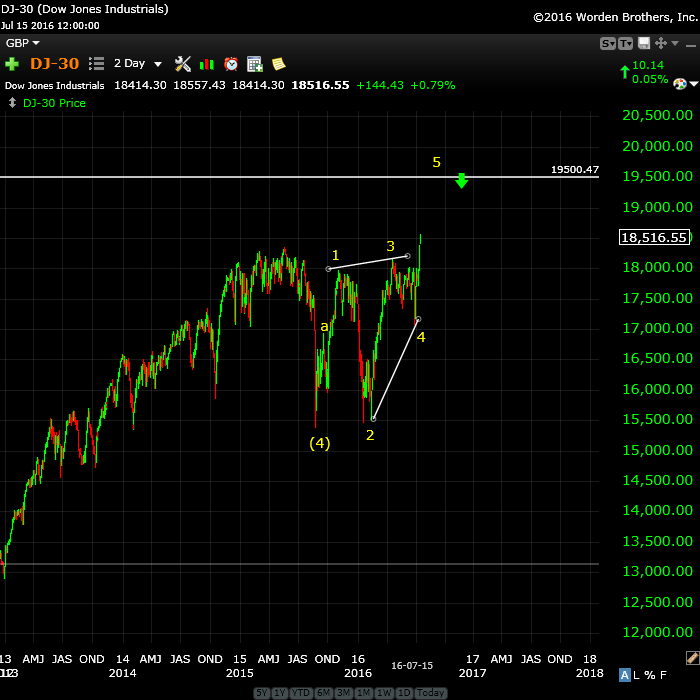
I’m getting a chance tonight to review all the charts on a high level and thought I’d post the DOW chart, which is looking fairly representative of all the indices. I’ll do a complete review in the service.
Above in the 2 day chart of the DOW. With the surge to a new high, my “second wave theory” has fallen by the wayside. I was ultimately wrong, but it was the best count at the time and it kept us safe throughout this hard to decipher market. The difficulty all along has been the fact that all these waves are in 3’s, so they’re corrective. The most probable pattern now comes to a very large ending diagonal (back to this pattern, but on a grander scale). Not a conventional one, but a diagonal none the less. Nothing else in terms of EW patterns fits a jumble of three waves.
I now expect the NYSE go eventually go to a new high. Everything should. Once one goes, they all go. I’ve put a target here of 19,500 for the DOW, an extension off the first wave up marked “a,” but with an ending diagonal, there is no rule, so that’s a guess, at best.
Expect a B wave down this week but not to a new low (below yellow 4). It will require another wave up, (which we already knew) and that should be the final wave. So not much has changed in terms of the short term picture, except that the wave down this coming week will not be as robust as it would have been in an expanding triangle (I’ve discounted the expanding triangle and the wave up has carried to about 140% and guidelines suggest 125% should be tops).
__________________________
Update Friday, July 15, Before the Open
It has been raining non-stop here in Calgary for the past 24 hours. We’ve had a week of on and off rain during the Calgary Stampede, which is historically the sunniest period of the year. And we’re in a desert. Dr. Wheeler said that the first climate of a cold period is wet. Dry and cold comes later.
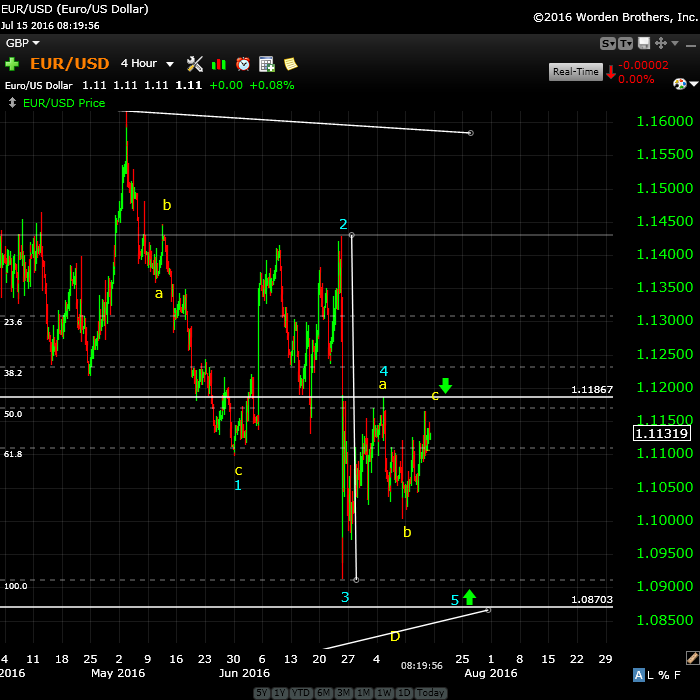
There’s not much sense posting a chart of the SPX or ES, as they haven’t really changed all that much overnight. But let’s look at the 4 hour chart of the EURUSD. Above is a closer shot of the triangle unfolding (you’ll find a large view chart below). You can see the large ABC configuration (everything is overlapping and one large wave is bigger than everything else).
However, as is so often the case, there are actually five waves in this mess (in blue). However, because of the overlapping and the large, most prominent wave, if you squint your eyes, there are only three major waves here. This is one of the keys to Elliott wave—knowing when you have a well-formed motive wave and when you don’t.
This tells us that this wave needs to drop to the lower trendline of the triangle and then completely retrace, as has been my call for a very long time. The euro is moving like a snail. It may move up to tag the previous blue 4 level today or this may be a smaller “2nd wave,” which means is will head down now to complete “wave 5” over the next couple of weeks. Either way, we’re heading down to the 1.087 area.
Finally, we should have a move up to the upper trendline, which would complete the triangle and lead to a large 5th wave decline (September for that?).
The moves of these currency pairs are aligned with the movement in the US indices and we’re slowly playing out the final waves before the crash, imho.
_____________________________
Update Thursday, July 14, Before the Open
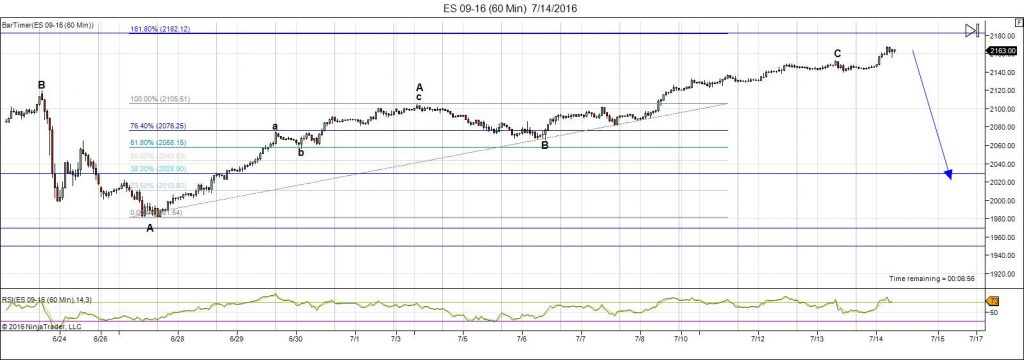
Above is the 60 minute chart of ES (emini SPX futures). It’s certainly one of the most impressive rallies I’ve seen. However, the wave appears to be in 3 waves. The SP500 is less defined, but with currency pairs set up to turn down, it makes sense to me that we’re still in this expanding triangle. I’ve drawn the fibonacci relationship on the chart showing the wave A and C extension. It sits at 2182, a common relationship. So we could have a little more upside today before we find a top, either tonight or tomorrow morning would be my best estimate. We could also turn here, as it’s “fork” area. We’re now up about 140% of the previous wave, which is above EW guidelines for an expanding triangle wave. The turn date is July 14/15 so sometime in this next 24 hours, we should see a turn.
As we get closer to a top, the waves tend to get more and more motive-looking, something I’ve noticed at other tops and bottoms, so while I believe we have one more likely even more impressive up/down move to go, we’ll be watching for the structure of the wave down.
Wait for a lower high (a small second wave retracing at least 62% before wading in anywhere)—that’s my caution.
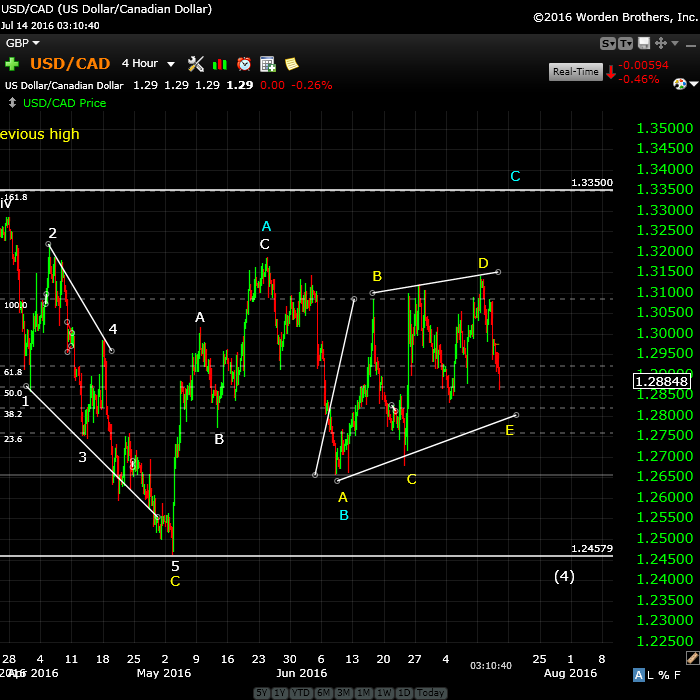
Above is the 2 hour chart for USDCAD. It looks like we are indeed going to drop to complete the larger triangle and then we should turn up. I would put the turn at sometime tomorrow (morning?).
Longer term, I expect move up to about 1.334 before a turn down to a new low at about 1.245. This has been the forecast for a while now, but we’ve simply been consolidating all this time. Other US dollar currency pairs are in similar positions. I also expect a turn down in EURUSD but after a slight move up to ~1.1186.
___________________________
Update Wednesday, July 13, Before the Open
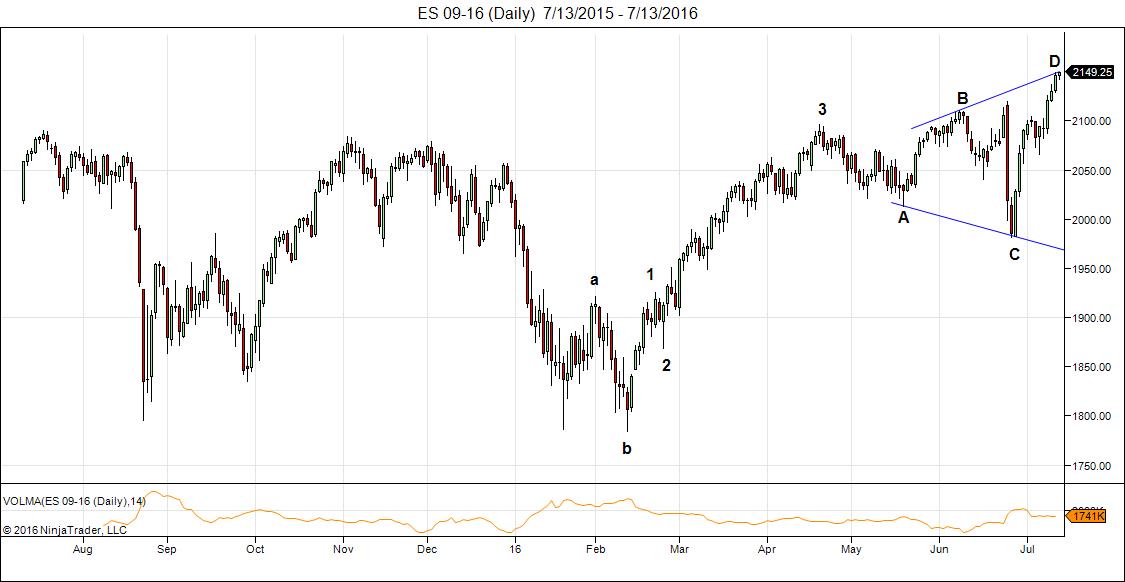
Above is the daily chart of ES (emini SPX futures). We’re still defining the upper trendline, but the lower one is set. The bottom indicator is volume and you can see how it’s been dropping off ever since the Feb 11 low. It’s dropping off again at the high here. I’m not expecting a lot out of today. The 5 waves of the C wave appear to be in place and indicators are showing divergence. The cycle turn date is 14/15 so a little more patience should do it.
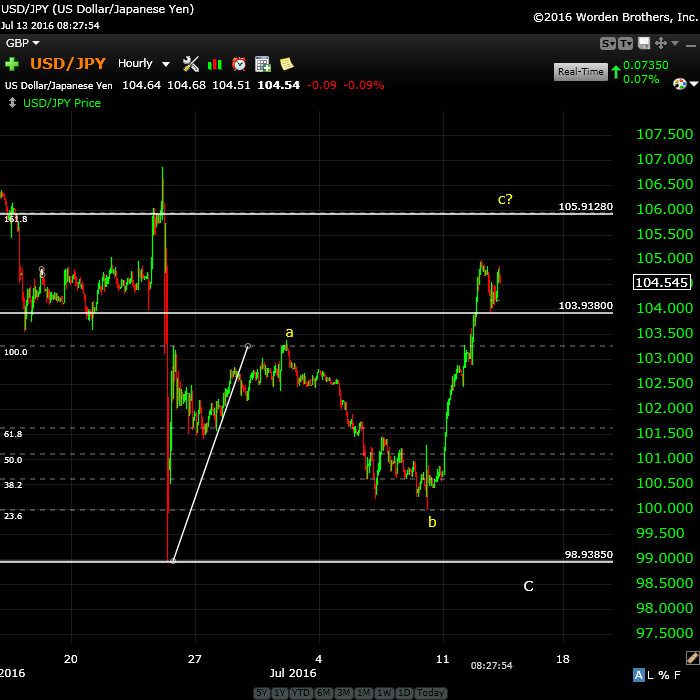
Above is the hourly chart of USDJPY, which can move on its own (not in sync with other currency pairs, because of the yen component). It hit my target of ~104. My fib extension tells me it has a bit more to go … likely to about 106. Then I would expect a turn down. USDJPY is at the end of a 4th wave move and will eventually reach down to 99.00. However, it’s likely to be a bit volatile until then.
___________________________
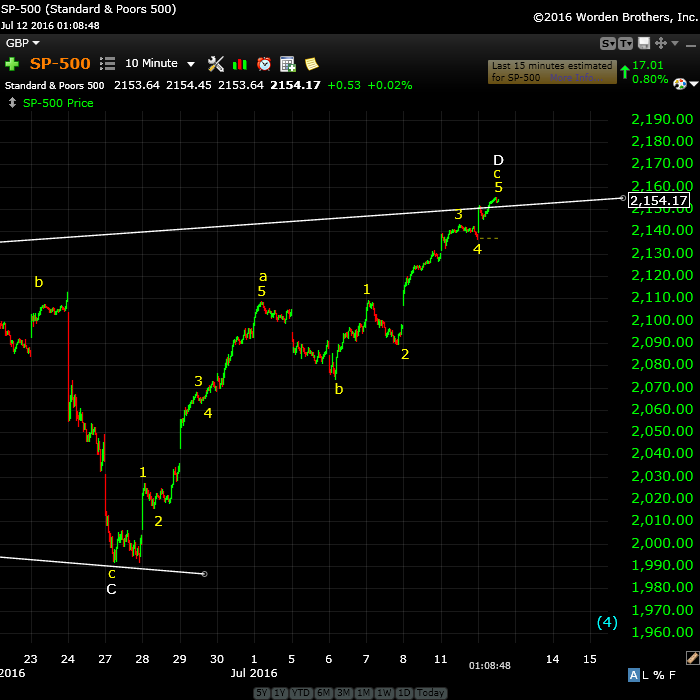
Update: Tuesday, July 12, 1PM
Above is the 10 minute chart of the SP500 showing the wave up that’s coming to an end. I was looking for a wave 4/5 combination as we didn’t have a 4th wave. A zigzag wave (a wave in 3) as part of an expanding triangle is a 5-3-5 pattern. The a wave will be in 5 waves, the b wave in 3 waves, and the c wave in 5 waves. It looks like we have them all and we’re slightly above the guidance level of 125% of the previous wave, so I would expect this wave to be all but over.
RSI, although not shown here, is also indicating the wave should be ending soon, if not now.
____________________________
Update: Tuesday, July 12, Before the Open
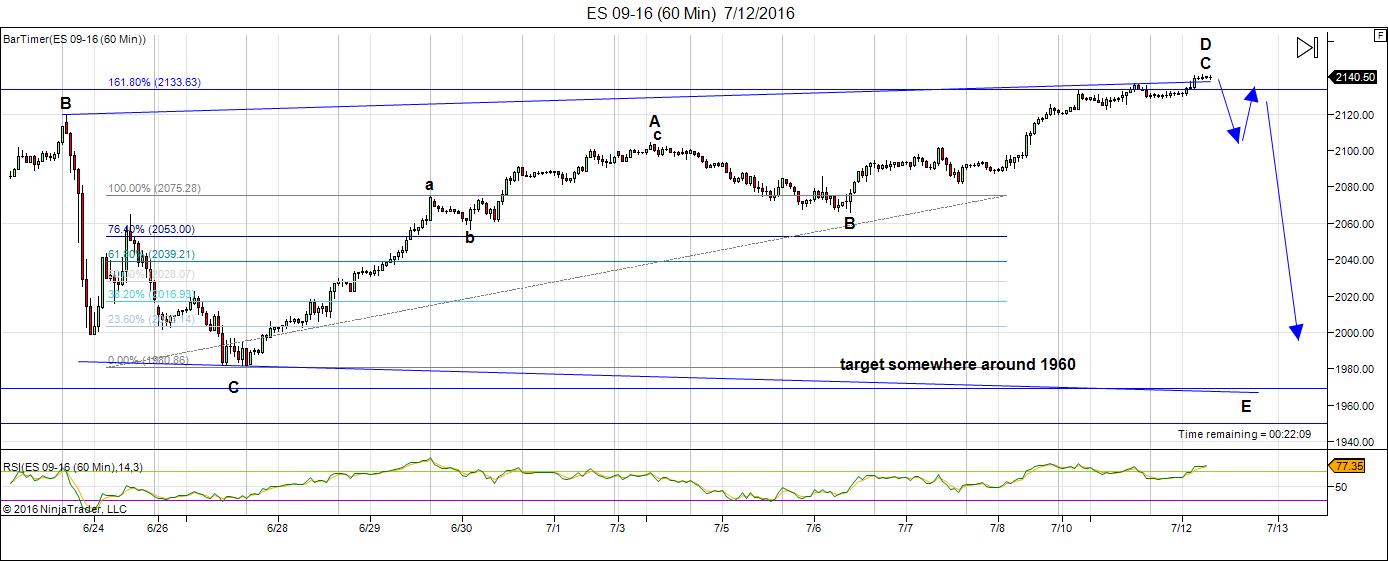
Above is the 60 minute chart for ES (emini futures of SP500). I suspect today we’ll drop into a fourth wave of the C wave since we really don’t have one. The SP500 should do the same thing. Then one more up on Wednesday likely before we start to head down Thursday/Friday. The target on the downside should be around 1960 (the lower trendline) but we’ll be able to target that a little closer as we move down.
Currencies have rebounded slightly, so they’re set to turn over as well, in tandem with the indices. The cycle turn date is July 14/15.
___________________________
Original Post (Sunday) July 10: Periodicity, in terms of cycles and patterns, in terms of Elliott waves, work together in a very powerful, very predictive manner. Periodicity (the tendency to recur at intervals) is a requirement of a cycle. Predicting the directional movement of the market and resulting price levels is the core of Elliott’s discovery in the 1930s. Used together, they’re highly accurate predictors of where the market will be tomorrow.
Cycles don’t in themselves determine direction. However, if a market is trending up and we are coming up to a major cycle turn, the probability is that it will turn in the opposite direction. The key is to know if the cycle you’re focused on is a major or minor cycle.
Elliott waves forecast the direction of the market and the probable turn in terms of price levels, but are not that accurate in terms of timing. Hence the power of meshing the two natural phenomena.
The key to predicting using Elliott waves is determining what pattern you’re currently in, as the patterns unfold in virtually the same manner each time. This is often an operation of determining probabilities in what patterns are viable based upon the price level you’re currently at, keeping in mind the preceding pattern. To be more specific, it’s more often an exercise of discounting less probable patterns to end up with the most probable pattern. Fibonacci ratios play a very large role in that exercise.
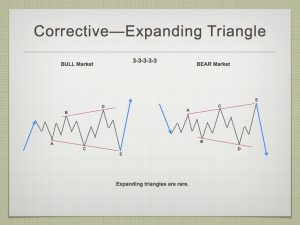 The pattern we’re in now in the major US indices is an expanding triangle (in a bull market). I had projected an ending diagonal very early in the game, but it has proven not to be the most probable operative pattern, and, in fact is the far more rare of the two patterns. There’s an interesting discussion of the reasons why this pattern has come to the probable “top of the heap” is here: https://worldcyclesinstitute.com/forum/todays-market/expanding-diagonal/
(You need to be logged into the forum to be able to add to comments on it).
In short, the reasons an expanding triangle is the most probable pattern over an ending expanding diagonal are the following:
- The wave up from ~2025 on May 19 cannot be a final fifth wave, because it’s clearly in 3 waves, so it must be a leg of a triangle. If that’s the case, it’s the B wave.
- Because Friday’s leg up went to a new high, the triangle is expanding. That leaves two options: an expanding triangle, or an ending expanding diagonal.
- An expanding ending diagonal is a fifth wave pattern, but we’re clearly in a fourth wave at this time, plus there’s absolutely no supporting evidence that they even exist. Bob Prechter cited one instance of one in the DJIA, which upon further analysis doesn’t hold water, and Ralph Elliott never identified that pattern in any of his work. I’m convinced it does not exist, based on the work I’ve done on post-analysis of example charts.
- Finally, ending diagonals are “diagonals” (Elliott was very clear about that); they are not horizontal patterns, which this triangle clearly is.
This leaves us with no alternative but an expanding triangle. If that’s the case, we have one more leg down (the E wave) and one more leg up (wave 5). These will take some time to unfold.
There’s also the history of the market to contend with. This is very important: Markets, to my knowledge,have never topped in summer months (the volume and participation just isn’t there). That’s why I’m targeting September for a market turn.
Bottom line: The next cycle turn date (Andy Pancholi) is July 15. The market should hold up until then, resulting in a turn down into the E wave (in 3 waves). The target for this wave up is somewhere between 2126 and 2152 in the SP500 (2116 – 2142 in ES).
Currencies are finishing up their final patterns slowly as we wend our way to the final top (preferably wave 2 in the US indices).
Gold and Oil: Special video report in the forum here.
Trader’s Gold Service
I’m almost finished the technical aspects and I’ve developed a lot of supporting content so that this is also a learning experience for anyone wanting to understand Elliott wave and how it applies to the movement of the market. You may not immediately be able to use it to perfection on your own, but you should be able to understand the basis concepts and use it to forecast the overall pattern and market direction.
Wave Three Down
Here’s a link to a projection for wave three down in the SP500.
______________________________
Here’s a video overview of the market for Tuesday, July 11, 2016:
Market Report for July 11, 2016 |
_______________________________
The Charts Going into Monday
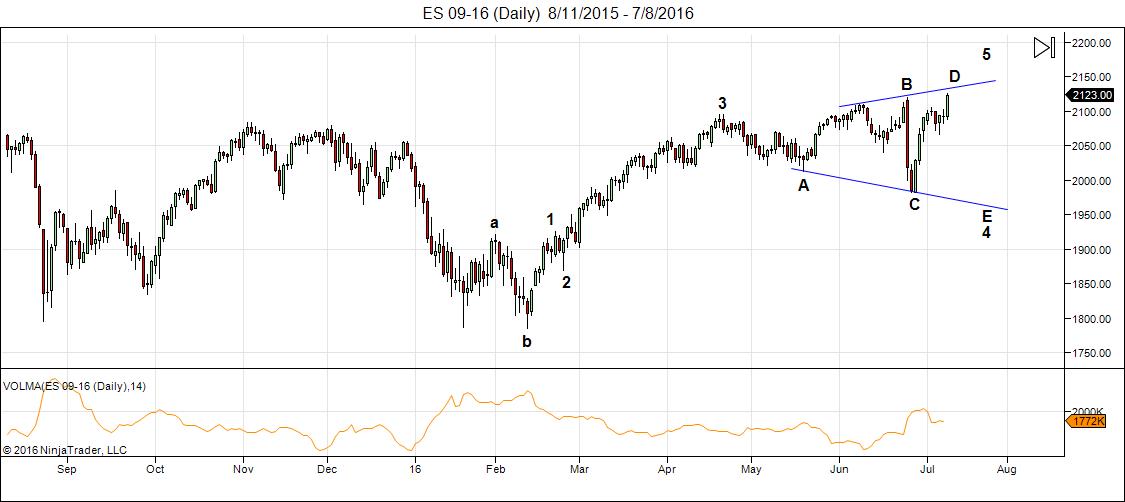
Here’s the daily chart for ES (emini futures) with the count to now. This shows the expanding triangle pattern I’ve identified up top. In this case, we have one more wave down and one more wave up. The wave down should be in 3 waves (a zigzag, which is a 5-3-5 configuration), followed by three waves up to a top.
In an expanding triangle, each wave is typically 105-125% longer than the previous wave. Therefore, I’m expecting to see a top on Thursday/Friday at between 2116 and 2142.
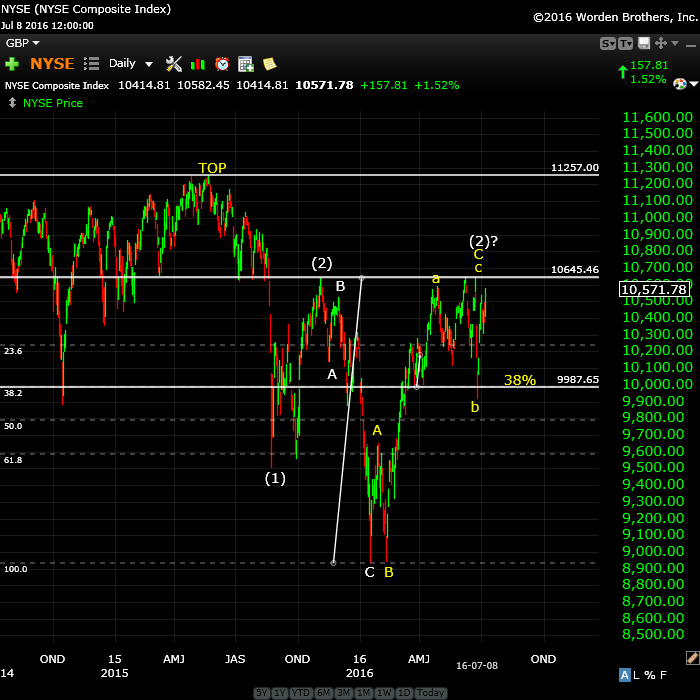
Above is the daily chart of NYSE (the largest cap index in the world) and the one we really need to pay attention to for the US market. This is the big picture and shows the double pronged second wave that we’re in the process of finishing. We’re not at a new high here, so this index could be tracing out a simpler path to a double top, having missed it by $10.00 a little over a week ago.
The bigger picture is that we’re setting up for a very large third wave down.
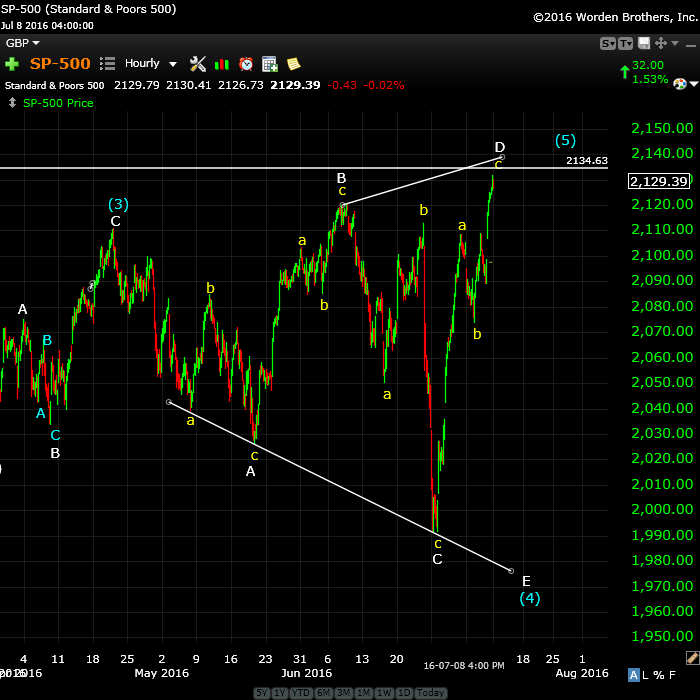
Above is the an hourly chart of the SP500. This shows the expanding triangle about to top. I would wait until later in the week to get short, however. The cycle turn date is July 14/15 and we still haven’t established the top of the present wave. The typical top for a D wave here would be between 2126 and 2152. The previous high is ~2134, which I don’t expect us to achieve (I can alway be wrong!).
The high for this wave should be between 2126 and 2152.
We will then turn down in an E wave with a final wave 5 up to come at a later date.
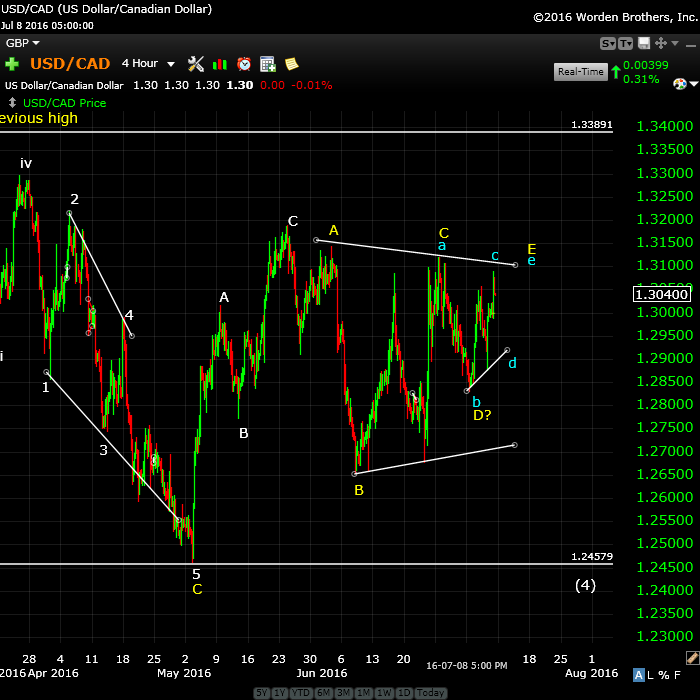
Above is the 4 hour chart of USDCAD. EURUSD, USDJPY and CAD here are all in the process of finishing up countertrend (corrective patterns). As such, it’s likely to be very volatile. USDCAD has followed through on my expectations, but stalled again on Friday and seems to be forming another smaller triangle, which triangles can do in either the C, D, or E wave. This is the D wave.
We will eventually reach 1.245, but how we get there is a bit of a question right now. My higher probability projection now is to complete this triangle and (with a turn up in the euro chart) to turn down to complete the final fifth wave of the pattern.
After that, we’ll turn up in a very large fifth wave in the opposite direction, which will eventually take up to a new high for USDCAD.
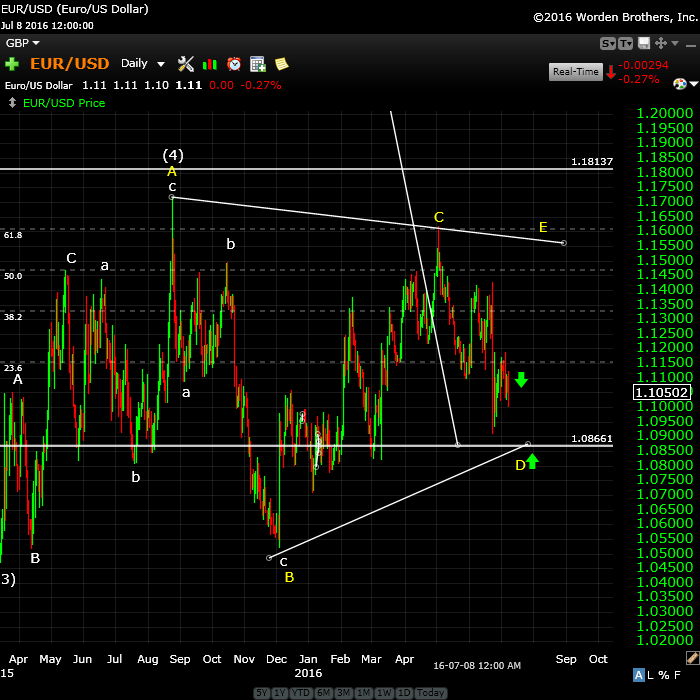
Here’s the four hour chart of EURUSD showing the ongoing triangle—the major (combination—a flat and a triangle) corrective pattern we’ve been in since March, 2014. We’re in the final stages of a bearish triangle formation, with one more leg up to go to finish the E wave. I’ve widened the triangle here to leave a distance between yellow D and E of .618 X the distance between waves A and B (not shown here), which is the typical wave E length. (I show more in the video)
This means that we should continue to drop to the 1.0870 level and then I suspect when we finish wave E of the expanding triangle in the US indices, we’ll turn up in the final E wave of the triangle.
EURUSD should turn down after finishing the E wave in tandem with the US equities.
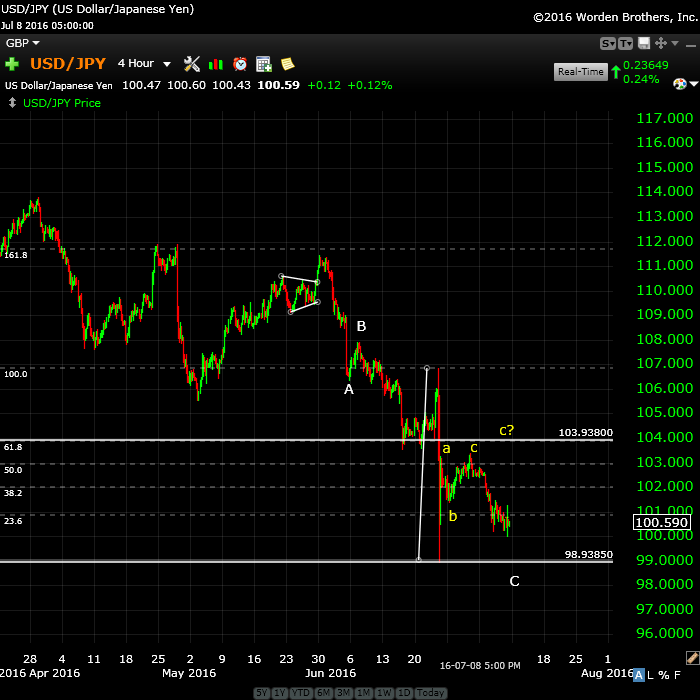
Above is the four hour chart of the USDJPY. I continue to predict volatility here, as well. We need to get to a double bottom, but how we get there is questionable. We headed down last week, but I’m expecting one more leg up at some point. I’ve drawn a horizontal line at the 62% level which with a little more travelling down would be 1 X the A wave. So we may get a leg up to 103.94 and then another leg down to finish off the pattern.
Once complete, we should get a turn up in a very large 5th wave to a new high. Give this until September to fully play out.
________________________
First Wave Down – What to Watch For
What we’re looking for (likely in September) to confirm a turn is a motive wave down in 5 waves at small degree. After that, we should get a second wave that will retrace up in 3 waves about 62%. That’s the preferred EW entry point. So don’t feel you have to rush in. There’ll be a much better opportunity at the second wave level than at the top and the risk is substantially reduced.
You’ll find a diagram in the forum here.
__________________________
History: The 1929 crash
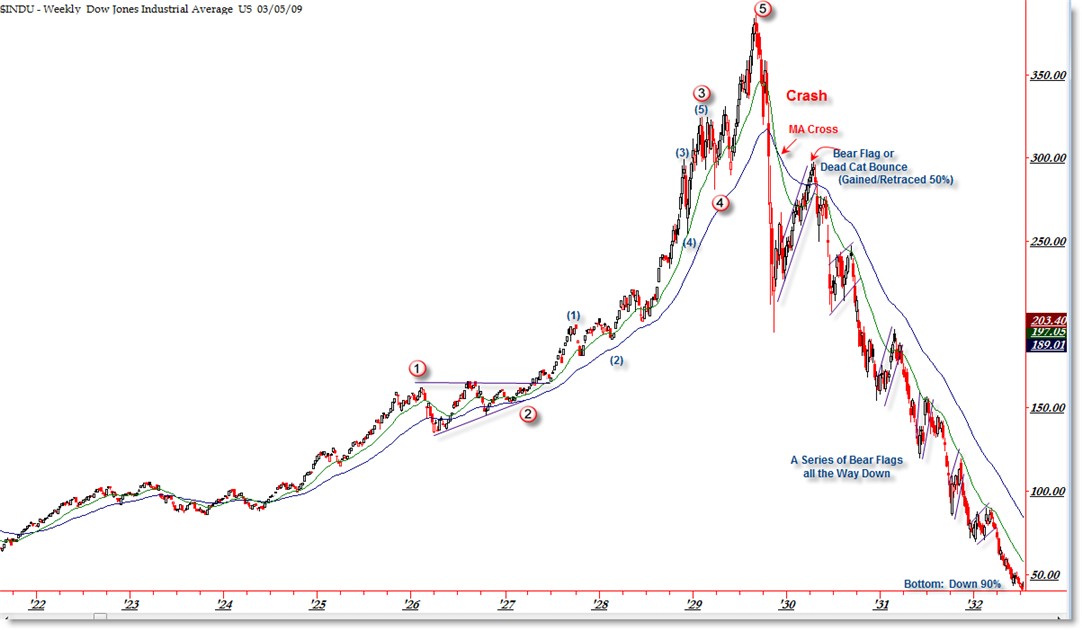
I think it’s important to look at 1929 and the wave structure (above and below), which was the same as 2007—to a point. I will show the 2007 crash below in the “What If” section.
The wave structure of the 1929 crash was in 3 waves overall. There were 5 waves down from the top (the A wave) and then a very large B wave retrace. The final C wave down was a stair-step affair and lasted over 2 years.
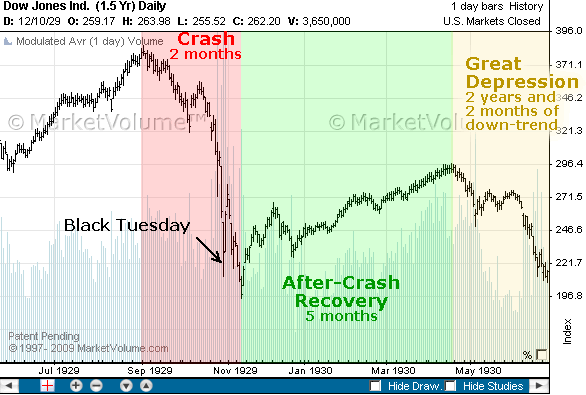
Let’s look a little close at the timing of the 1929 crash because the similarities to today are uncanny.
The market peaked on September 3, 1929 and then it took 2 months for the crash to actually happen (to reach the bottom of wave 5 of the A wave). The larger crash which we always hear about began on October 23, 1929. Then there was that large B wave, which lasted 5 and a half months and finally (which I explain a little further in the cycles section below), the C wave which went on for more than 2 years. This might be the scenario we’re looking at going forward.



Here’s ‘an attempt’ at trying to count waves on the DJIA since the Jul 6 lows.
Please feel free to ‘shoot this down’….because I’d love for it to NOT have to go to ‘yet another’ high.
https://postimg.org/image/vk4v6s1up/
purvez,
Looks correct to me. Taking the same fib measurement I did on ES, and Ted did on SPX, the 1.618 extension comes to 18,600 give or a take a dime or two.
Ugh!!! I was hoping someone would find a ‘fatal flaw’ in my count. Ah well I’ll just wait patiently.
Here’s a blown up chart of the 5 minute DJIA since 11:00 BST 14 July’16 . It’s looking like a triangle to me…..which is the second last wave in EW terms.
https://postimg.org/image/fslrcdrtj/
Fair warning ALMOST ALL of my triangle calls morph into something else….but I keep plowing on in hope.
Solarham.com shows K index has remained elevated last few days. K index is measurement of geomagnetic energy. When it stays above 3 for 5 or more days in a row it is kind of unusual and per John Hampson’s research is negatively correlated to equity prices. I am in SPY put options that expire next week and the week after next.
PALS is negative this week and price has risen which is either sign of a strong market direction or a building of negative energy that will resolve with a sell off next week.
Hi Valley,
Are you posting on any other site except for this one. Please share if you are using a twitter account. Your insights are helpful.
Is PALS negative next week too.
I only post here as Peter Temple and Worldcyclesinstitute.com is the only site that has elliot wave tutorials that are so easy to grasp. Next week:
Phase: negative all week
Distance: positive post apogee all week
Declination: positive post southern all week
Seasonals: negative all week
Summary: no clear PALS effect. I am betting on negative side only because of hunch that price is overbought during summer which usually doesn’t have rallies.
I just updated the chart for USDCAD as it looks like it’s going to complete the larger triangle. Top of the post.
Hi Peter,
Can each of wave a,b,c,d,e in a megaphone 5th wave be a 3 waves ? Thanks
This is a fourth wave, but yes, they all have to be, or the pattern isn’t correct. The fifth up after the triangle E bottom should be a 3, too.
Peter the target will be 2020 now or can it go to 1960 without changing anything
My original blog post targets 1960. I don’t know where 2020 comes from.
May be I misunderstood, on the top, the chart, it looked like 2020 now
Also, Peter , since the wave went so far up, will the target of 1st wave of 3rd still be around 1800 or it will be higher now. just trying to learn
I’m completely lost as to what you’re asking me. I don’t know what 1st of the 3rd you’re talking about, or what index you’re referring to. In ES or SPX, we have an E wave to go down next.
Peter. I am talking about. Spx. Roadmap u had put in forum. When 3rd wave starts. Ist wave app goes to 1800. If the fifth wave of 2nd goes say to 2200to 2200 spx which is Much higher than originally thought . Does the road map also changes for the 3rd wave. Just trying to learn. Thanks
If we go to a new high, then yes, the trajectory will change, but not by all that much. There’s no point thinking about the specifics until we see how everything ends up. It’s always based upon the first wave length.
Thanks
Valley
Im not sure what you mean by the K index
i use this and i look at the KP index and i watch for
it to turn Red and also watch for a solar storm .
Once i see the red and the solar storm i count 39 hours .
More times then not it is a bullish signal .
when its green or yellow i ignore it .
http://www.n3kl.org/sun/noaa.html
Joe
Valley
never mind
i get it , your K index is the same as what im looking at ( Kp index same thing )
Joe,
When we approach August 4 will you let me know if you are selling the market?
John.
Here are some data to buttress Peter T’s recollection of no important tops having been reached in the summertime. This post speaks specifically about July. This gentleman, by the way does neither Elliott nor cycles specifically but, for my money does some of the best technical work online… and it’s all gratis! http://jlfmi.tumblr.com/
bulls becoming very bold and confident, and they are proven right also. they are saying nothing will bring it down even the terrorist attach
Terrorist attacks and the like just increase the desire for GLOBAL money to flock to the US stock market. It really got started last fall when most banks around the world went to negative interest rates. The world is well aware of Microsoft, Amazon, Google, Tesla, etc. Then there are the plethora of stocks that pay dividends of 3% to 7%. Until Martin Armstrong makes a few bad calls, (hasn’t ever happened since the 80’s) it would be a good idea to keep an eye on his site. Dow 22,000 here we come : )
I added a chart of EURUSD, which looks about ready to head down. We should see a turn today in the US indices, as well as US currencies.
My preference is for a double top is ES. I have the C wave count as complete, although the ultimate fib extension is about 2180. And then a lower high (a small second wave). We may not get the double top, but that’s what I’d be looking for.
Currencies already look like they’re rolling over.
In ES, a drop below 2151 and then 2139 to confirm the turn. Currencies look like they need a bounce (and by extension possibly ES and SPX). It’s certainly tentative, which I’d expect anyway, but I don’t think we’re quite “done.”
ES 2151 is also the 1.618 extension of the A wave down so far, so if it’s going to bounce anywhere, it’s at 2151.
Hi Peter
In southern Oregon where i live we usually get decent weather in December
and the rainy season historically is Feb march .
Last Nov it began to rain and in December it poured and poured and poured .
The ran let up finally about a month ago and i have been able to get some things
finished up outside.
Something that bothers me about this market is this expanding triangle .
looking at the spx and Dow monthly chart from the 2000 top to today
also looking at the weekly RUT from from Jan 2014 today.
Ive always felt that the larger pattern will end up as the minor pattern in
the end and im starting to think that is what is playing out .
The Rut has finally broken above its nov 2015 highs today .
the pattern while speculative appears to be a head and shoulders top .
the left shoulder would be the year 2014 with the head in 2015.
if so we are forming the right shoulder now .
Andy’s turn date may end up as correct on this index ( RUT )
and possibly the tech sector .
My Bias being the DOW august 1st-4th is still my key date range .
looking at the daily Dow chart and im sure it shows up on other index’s
the low on aug 24 2015 and the low on feb 11 2016 was 118 trading days
adding 118 trading days to the Feb 11 low is August 1st .
the high on april 20 plus 34 trading days was the high on June 8th
Plus 34 trading days is July 27th .
The low on may 19th plus 26 trading days was the june 27th low
plus 26 trading days is august 3rd .
joe
Conanbab July 13, 2016, 4:09 pm
Hi,my dates are 12-20 july and 2 agoust + 1 day maybe,this work 90% time.If day Before was low buy and reverse in Es or Dax,stox5e,best Stockmarket Es.
I am have astrology numbers 1.500 very low in years,hére probably very fast down Before 2 agoust,flash crash maybe.
joe , don’t know this person but this is what he posted above
Some times I am truly blind!! Here is something that I should have spotted at least 10 hours ago.
The DJIA 5 min divergence between it’s price and it’s 14 period RSI.
Something as ‘strong’ as that would inevitably have consequences and we are in the throws of those consequences I believe. I would ideally like this down wave to go to at least 18450….although it won’t in a straight line!!!
https://postimg.org/image/da57kbgyp/
Here’s the link…. I’m all over the place today.
https://twitter.com/allerotrot/status/753974664846794752
technicals on the daily chart cause me to believe a high may be in…the degree remains to be seen…
I tend to agree. I think the next small wave is a second wave.
MUCH as I’d like to agree I personally think that, at least on the DJIA, we have a smallish expanded flat which should end around 18450 and then we have another final ramp up.
On the S&P we didn’t even get a new high, which may make for a zig zag.
Anyway I’d love to see a chart of what you guys are looking at.
All the US currency pairs are bouncing in what I suspect is a second wave, so ES and the like should also. USDCAD has done one complete wave up, EURUSD, one down, etc. She is not moving quickly ….
Market legend Art Cashin says a ‘conspiracy theory’ is going around that explains the latest stock rally
http://wsf.typepad.com/wall-street-forecaster/2016/07/market-legend-art-cashin-says-a-conspiracy-theory-is-going-around-that-explains-the-latest-stock-ral.html
So the turn date has arrived! And US indices have paused and will hopefully turn down next week. I will be amazed if the ES hits the bottom of the triangle at 1960 before the final wave up as the market mood is so bouyant. I wonder how high stocks would go if France or Italy left the EU? The worse the apparent economic shock the more positive for stocks. A world addicted to low/negative rates. I believe a truly disastrous bear market will unfold when central banks start raising rates but not really before that happens.
krish right now they don’t let it fall 10 points, donot know what will bring it to 1960
I just opened the Traders Gold signup page at https://worldcyclesinstitute.com/traders-gold-signup/
The prices are even lower for the next 24 hours …. until tomorrow night at midnight. I’ll be sending around an email to current members tonight.
I never should have set this up for a turn day … 🙂 (too much going on).
Finish off today, I’d say the turn is in. I only expect ES to reach 2159 before another turn down. USDCAD has done one wave of 5 up and is currently almost done the 2nd wave (should turn at 1.291.
EURUSD similar situation.
Peter, I have a question on the service: in the weekly webinar, say it is buy time around 1960, can we ask you if time and price is right to buy say qld, uwm etc. just making sure we are doing the right thing, as done lot of trades early or wrong
Absolutely! That’s what that webinar is all about. I’ll take say 15 minutes to review a few charts and the rest of the time will be open to questions on anything. And it could go longer than an hour, if the interest it there. I haven’t got around to doing a lot of descriptions (webinar, etc.), unfortunately, but I’ll be working on that some more on the weekend. I’m also going to try to open up the webinar to others (at a low price), but traders gold members would have to come first, so have to think about that.
the reason I am asking, I don’t do options, or futures or currencies,
sue,
I’ll talk about anything that has a chart pretty much, as long as I can get to it, or if there’s time, members can even show one. I’d like to cover off charts like SPY, DIA, IWM, etc, but there’s a bit of a time factor in daily reports, and the indices pretty much all move together, but I’m certainly open to providing info as I can.
with the low price you got my interest, i wish you opened the special price till Monday gives time to think. want to make decision after you post the price for the just webinar
Do you think Andy’s turning point could be the coup in Turkey? Just thinking out loud.
That’s funny. I was emailing Andy and he said he needed to call and thank the military for the turn. So, in a word, yes.
The Black Swan is a Turkey?
http://stockboardasset.com/insights-and-research/black-swan-turkey/
“On Friday, the Turkish Military attempt to overthrow the Government. This occurred on a post cash basis for US markets, as well as Global markets. We call this a black swan event where a market has not prepared. It’s like yelling fire in the theater with one exit, but having to wait an entire weekend to make a move as well as everyone else.”
I’ve posted a new chart of the DOW at the top of this post after spending some time looking at the bigger picture, based upon most major indices reaching a new high. That negates my second wave count, of course, but doesn’t actually change all that much in the short term.
So, will have a small upturn then the 4th wave down?
I am watching after hours and its getting pretty ugly with lots of red candlesticks.
Peter thanks for updated chart. 1) if andy said it is major date . I thought it as major top. 2. With cpc. Msn greed fear ratio At 90. Everything bullish sentiment. Do u thing correction to. Say 2000 will be enough. To bring sentiment down
Rose,
Sentiment is about as high as it’s ever been, which means we’re really close to a top. That doesn’t mean we’ll top before September, but this is a dangerous market. We’re in the final wave, but I make this an very large ending diagonal and ending diagonals don’t necessarily have a final target. However, we will be able to nail an entry shortly after a top.
Andy’s date is a major turn. I don’t think it’s the top, but it’s close. I think it’s an A wave. There’s another turn in 10 days or so.
http://www.jessicaadams.com/2016/07/15/caution-mars-in-your-horoscope-in-2016/
she refrences the above as something that comes
Every 29 years ago .
2016-29=1987
and an early August top fits perfectly
Joe,
Looking back to the chart of 1987 we saw a big upswing starting in the 3th week of July wich lasted till the 3th week of August.
Mercury retograde in that time was Oktober 16 till November 6
Around that time the market crashed.
We are just breaking a long sideways patern ( SP500 & Dow) and now we have a Mercury retograde August 30 till September 22.
So maybe there is a parall and we will first see the market surge to much higher levels till the third week or end of August at the start of Mercury retograde.
It would be inline with the prediction of Mahendra SP 500 + 15% = 2400/2450 by the end of August?
( At the moment he wrote his June letter ).
Also Stan Harley is talking about a period September 21/23 for a high or low in the market and he expects a bullish summer ( I already placed a link to his latest free letter).
So my gut feeling tells me the market will rise higher the bears will hate to see it and there are no fundamentals that support this rise (just like the China bubble and the Dotcom in 2000 etc..).
Everybody wants to get rich quickly syndrome .
Just my thoughts :
Waiting for the next big cycle turn dates (Andy) September 9-16.
A good weekend to all
you may want to consider reviewing all of Pancholi’s free videos that have been posted here…July 14/15 was clearly identified as a major turn…he also identified a second time frame for a major turn…it is not September 9-16…this is not intended to be offensive…however, far too much inaccurate information gets posted to blogs/message boards that people take as gospel…
Andy said july and nov are major dates.
what specific period in November?
Rotrot,
I also had a lot of faith in Andy’s turningpoint 14/15 July but Iike I mentioned before I now think it is an upswing.
I want to stay open minded so that I m able to respond to what I see and not what I m thinking, that’s why I wrote what might be in the cards for now.
It is a free blog and that’s what I like about it so we can all learn and share our opinions and information.
All the best.
John.
Hi Peter, what is your target for this wave down in the DOW before we possibly head up towards 19500? I’ve got a DOW short at 18150 which I would like to close ideally at break even or profit before we explode higher to 19k +.
I don’t have a specific target, but it should not go below the previous low at 17,063. It should come down in a zigzaq (5-3-5).
Thanks Peter. Just signed up for 1 year of your trader gold membership. Looking forward to it!
Here is a new free video from Andy Pancholi regarding the July 14/15 turn date.
http://cyclesanalysis.evsuite.com/mtr-update-14th-july-2016-optimized/
Hi Peter,
Are you saying Dow is in w5 of ending diagonal primary wave 5 since w1 and w4 are overlapping? Thanks.
No, I actually think we’re just starting a smaller ending diagonal and in that case, we’ve finished wave 1. However, it’s really early to call an ending diagonal. The direction is up, but we’ll have a correction first.
So we are not going down to 1960 like you had thought? Just keep going up? I’m really confused now.
Hi Peter
Can a megaphone be a wave 5 ? Thanks
1987 had rally of 10% from May to September and then a big sell off in October. Maybe this year could have the same pattern.
Next week I am going to flip from bearish to bullish if market sells off by 3% or more. PALS flips mostly positive following week, so want to get in at lower prices if they are available.
New post: https://worldcyclesinstitute.com/a-bullish-world/
This website is for educational purposes relating to Elliott Wave, natural cycles, and the Quantum Revolution (Great Awakening). I welcome questions or comments about any of these subjects. Due to a heavy schedule, I may not have the time to answer questions that relate to my area of expertise.
I reserve the right to remove any comment that is deemed negative, is unhelpful, or off-topic. Such comments may be removed.
Want to comment? You need to be logged in to comment. You can register here.