
Update Friday, July 15, After the Close
I’m getting a chance tonight to review all the charts on a high level and thought I’d post the DOW chart, which is looking fairly representative of all the indices. I’ll do a complete review in the service.
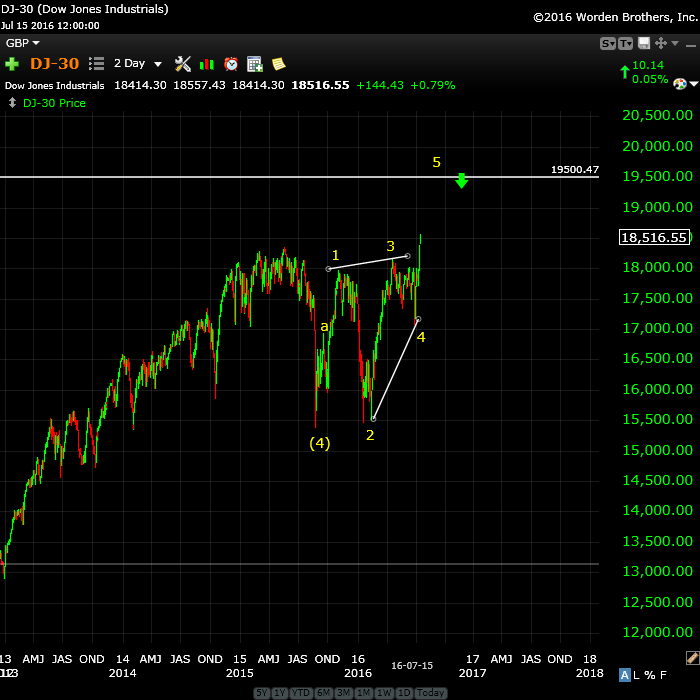
Above in the 2 day chart of the DOW. With the surge to a new high, my “second wave theory” has fallen by the wayside. I was ultimately wrong, but it was the best count at the time and it kept us safe throughout this hard to decipher market. The difficulty all along has been the fact that all these waves are in 3’s, so they’re corrective. The most probable pattern now comes to a very large ending diagonal (back to this pattern, but on a grander scale). Not a conventional one, but a diagonal none the less. Nothing else in terms of EW patterns fits a jumble of three waves.
I now expect the NYSE go eventually go to a new high. Everything should. Once one goes, they all go. I’ve put a target here of 19,500 for the DOW, an extension off the first wave up marked “a,” but with an ending diagonal, there is no rule, so that’s a guess, at best.
Expect a B wave down this week but not to a new low (below yellow 4). It will require another wave up, (which we already knew) and that should be the final wave. So not much has changed in terms of the short term picture, except that the wave down this coming week will not be as robust as it would have been in an expanding triangle (I’ve discounted the expanding triangle and the wave up has carried to about 140% and guidelines suggest 125% should be tops).
__________________________
Update Friday, July 15, Before the Open
It has been raining non-stop here in Calgary for the past 24 hours. We’ve had a week of on and off rain during the Calgary Stampede, which is historically the sunniest period of the year. And we’re in a desert. Dr. Wheeler said that the first climate of a cold period is wet. Dry and cold comes later.
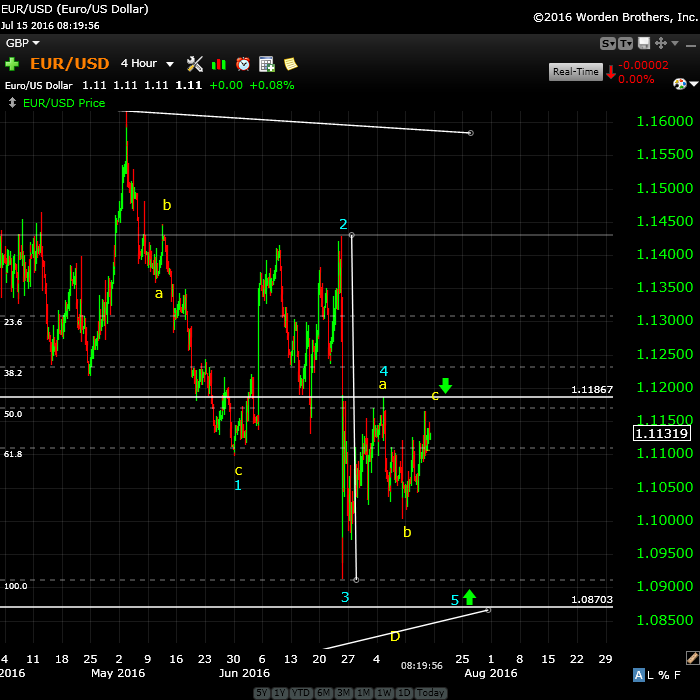
There’s not much sense posting a chart of the SPX or ES, as they haven’t really changed all that much overnight. But let’s look at the 4 hour chart of the EURUSD. Above is a closer shot of the triangle unfolding (you’ll find a large view chart below). You can see the large ABC configuration (everything is overlapping and one large wave is bigger than everything else).
However, as is so often the case, there are actually five waves in this mess (in blue). However, because of the overlapping and the large, most prominent wave, if you squint your eyes, there are only three major waves here. This is one of the keys to Elliott wave—knowing when you have a well-formed motive wave and when you don’t.
This tells us that this wave needs to drop to the lower trendline of the triangle and then completely retrace, as has been my call for a very long time. The euro is moving like a snail. It may move up to tag the previous blue 4 level today or this may be a smaller “2nd wave,” which means is will head down now to complete “wave 5” over the next couple of weeks. Either way, we’re heading down to the 1.087 area.
Finally, we should have a move up to the upper trendline, which would complete the triangle and lead to a large 5th wave decline (September for that?).
The moves of these currency pairs are aligned with the movement in the US indices and we’re slowly playing out the final waves before the crash, imho.
_____________________________
Update Thursday, July 14, Before the Open
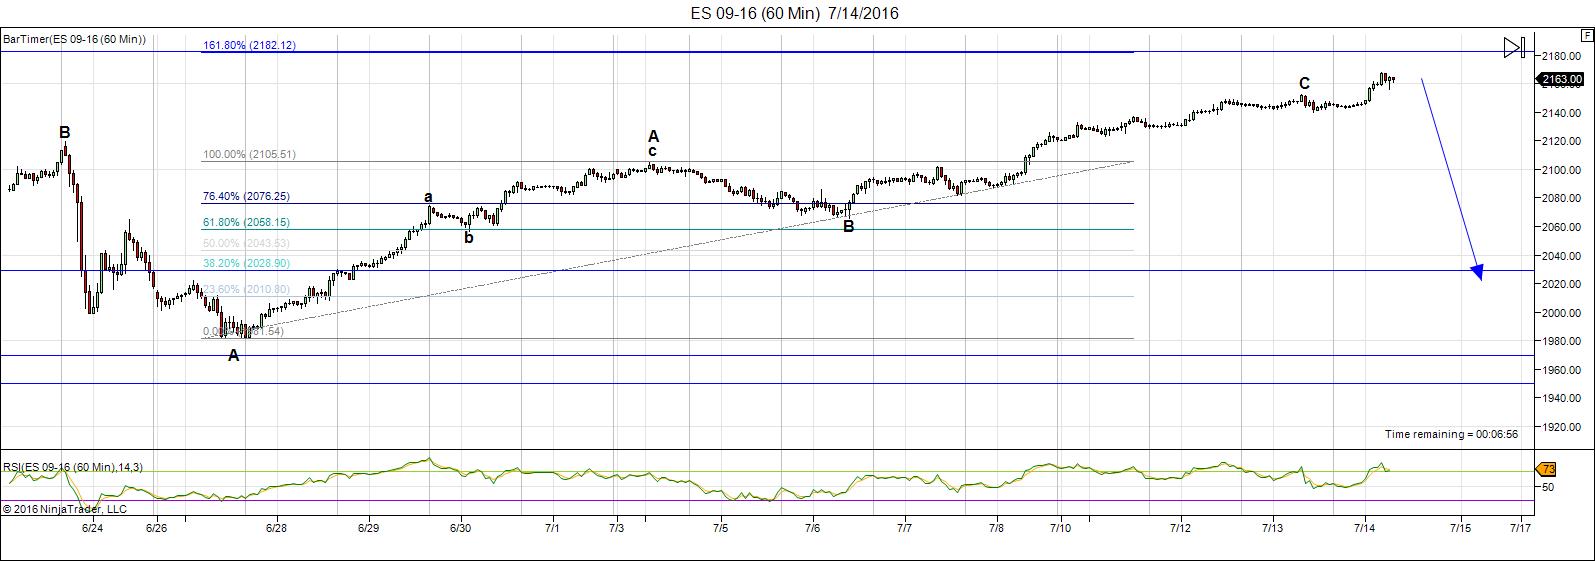
Above is the 60 minute chart of ES (emini SPX futures). It’s certainly one of the most impressive rallies I’ve seen. However, the wave appears to be in 3 waves. The SP500 is less defined, but with currency pairs set up to turn down, it makes sense to me that we’re still in this expanding triangle. I’ve drawn the fibonacci relationship on the chart showing the wave A and C extension. It sits at 2182, a common relationship. So we could have a little more upside today before we find a top, either tonight or tomorrow morning would be my best estimate. We could also turn here, as it’s “fork” area. We’re now up about 140% of the previous wave, which is above EW guidelines for an expanding triangle wave. The turn date is July 14/15 so sometime in this next 24 hours, we should see a turn.
As we get closer to a top, the waves tend to get more and more motive-looking, something I’ve noticed at other tops and bottoms, so while I believe we have one more likely even more impressive up/down move to go, we’ll be watching for the structure of the wave down.
Wait for a lower high (a small second wave retracing at least 62% before wading in anywhere)—that’s my caution.
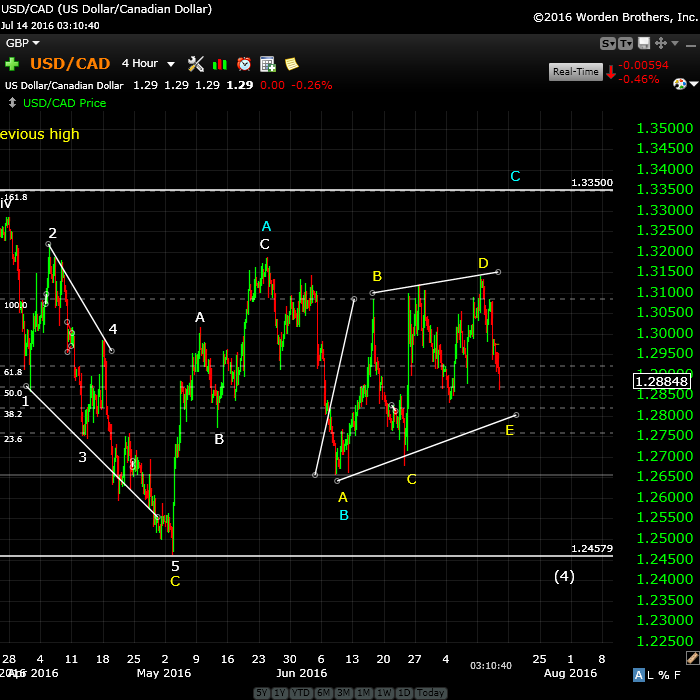
Above is the 2 hour chart for USDCAD. It looks like we are indeed going to drop to complete the larger triangle and then we should turn up. I would put the turn at sometime tomorrow (morning?).
Longer term, I expect move up to about 1.334 before a turn down to a new low at about 1.245. This has been the forecast for a while now, but we’ve simply been consolidating all this time. Other US dollar currency pairs are in similar positions. I also expect a turn down in EURUSD but after a slight move up to ~1.1186.
___________________________
Update Wednesday, July 13, Before the Open
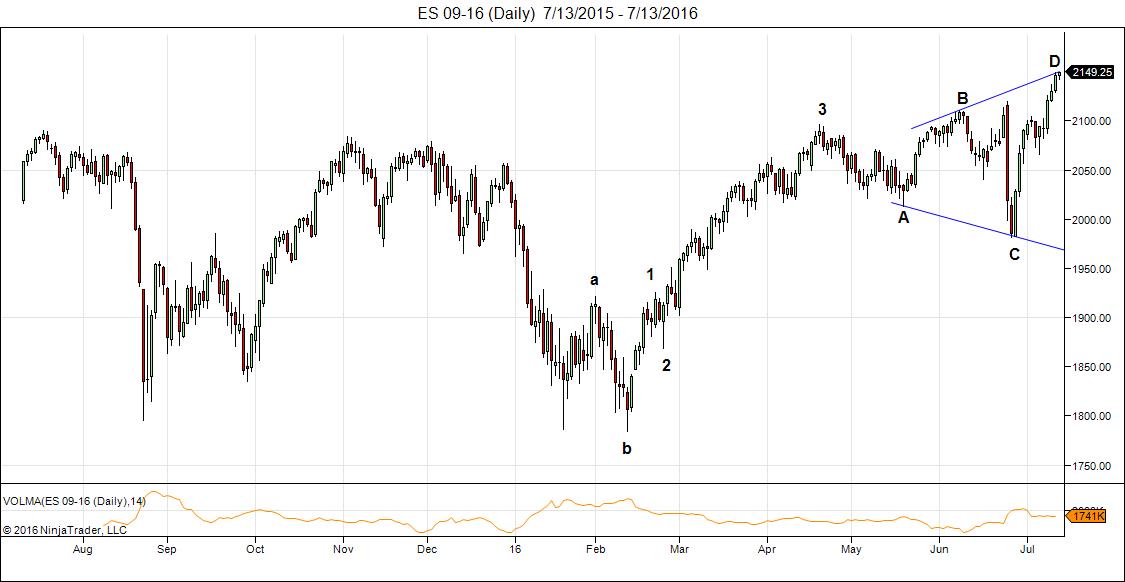
Above is the daily chart of ES (emini SPX futures). We’re still defining the upper trendline, but the lower one is set. The bottom indicator is volume and you can see how it’s been dropping off ever since the Feb 11 low. It’s dropping off again at the high here. I’m not expecting a lot out of today. The 5 waves of the C wave appear to be in place and indicators are showing divergence. The cycle turn date is 14/15 so a little more patience should do it.
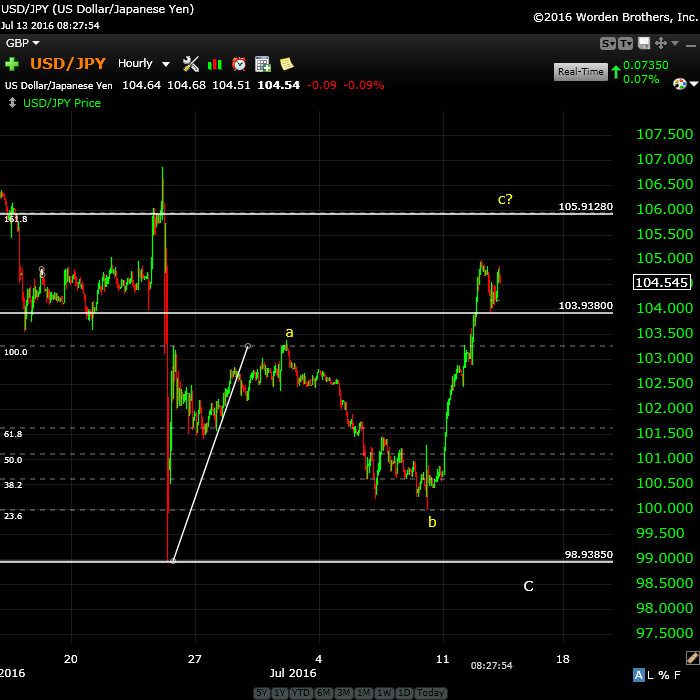
Above is the hourly chart of USDJPY, which can move on its own (not in sync with other currency pairs, because of the yen component). It hit my target of ~104. My fib extension tells me it has a bit more to go … likely to about 106. Then I would expect a turn down. USDJPY is at the end of a 4th wave move and will eventually reach down to 99.00. However, it’s likely to be a bit volatile until then.
___________________________
Update: Tuesday, July 12, 1PM
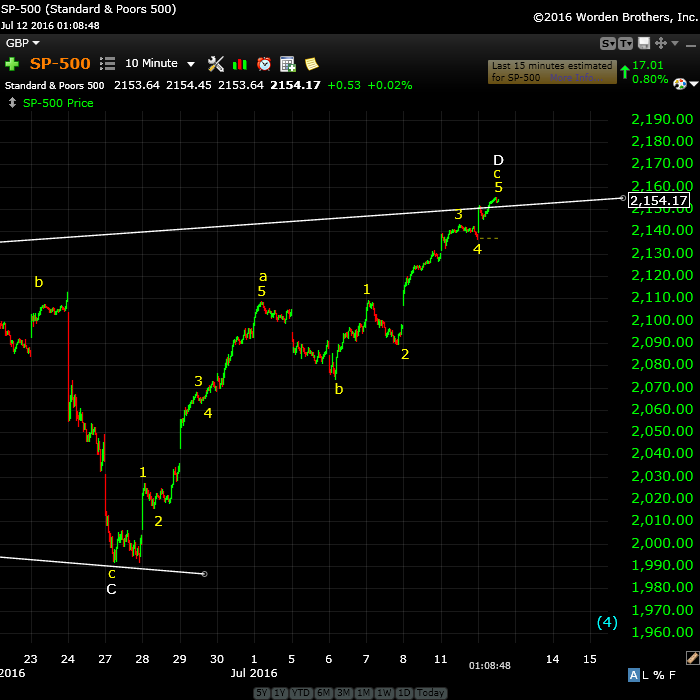
Above is the 10 minute chart of the SP500 showing the wave up that’s coming to an end. I was looking for a wave 4/5 combination as we didn’t have a 4th wave. A zigzag wave (a wave in 3) as part of an expanding triangle is a 5-3-5 pattern. The a wave will be in 5 waves, the b wave in 3 waves, and the c wave in 5 waves. It looks like we have them all and we’re slightly above the guidance level of 125% of the previous wave, so I would expect this wave to be all but over.
RSI, although not shown here, is also indicating the wave should be ending soon, if not now.
____________________________
Update: Tuesday, July 12, Before the Open
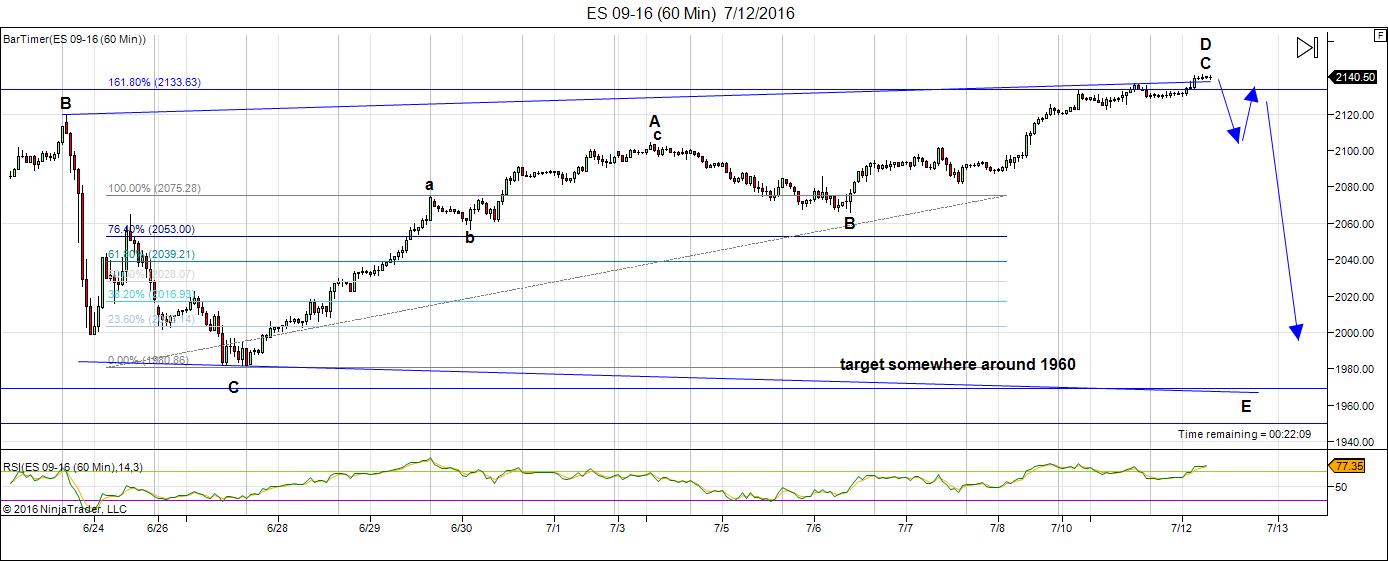
Above is the 60 minute chart for ES (emini futures of SP500). I suspect today we’ll drop into a fourth wave of the C wave since we really don’t have one. The SP500 should do the same thing. Then one more up on Wednesday likely before we start to head down Thursday/Friday. The target on the downside should be around 1960 (the lower trendline) but we’ll be able to target that a little closer as we move down.
Currencies have rebounded slightly, so they’re set to turn over as well, in tandem with the indices. The cycle turn date is July 14/15.
___________________________
Original Post (Sunday) July 10: Periodicity, in terms of cycles and patterns, in terms of Elliott waves, work together in a very powerful, very predictive manner. Periodicity (the tendency to recur at intervals) is a requirement of a cycle. Predicting the directional movement of the market and resulting price levels is the core of Elliott’s discovery in the 1930s. Used together, they’re highly accurate predictors of where the market will be tomorrow.
Cycles don’t in themselves determine direction. However, if a market is trending up and we are coming up to a major cycle turn, the probability is that it will turn in the opposite direction. The key is to know if the cycle you’re focused on is a major or minor cycle.
Elliott waves forecast the direction of the market and the probable turn in terms of price levels, but are not that accurate in terms of timing. Hence the power of meshing the two natural phenomena.
The key to predicting using Elliott waves is determining what pattern you’re currently in, as the patterns unfold in virtually the same manner each time. This is often an operation of determining probabilities in what patterns are viable based upon the price level you’re currently at, keeping in mind the preceding pattern. To be more specific, it’s more often an exercise of discounting less probable patterns to end up with the most probable pattern. Fibonacci ratios play a very large role in that exercise.
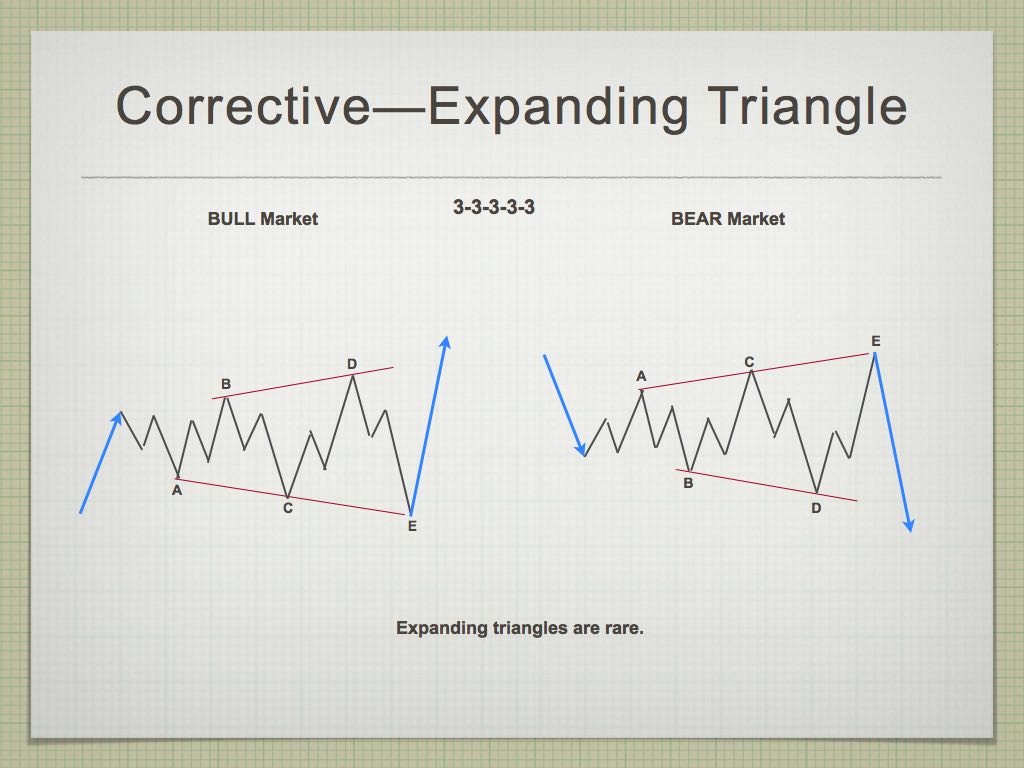 The pattern we’re in now in the major US indices is an expanding triangle (in a bull market). I had projected an ending diagonal very early in the game, but it has proven not to be the most probable operative pattern, and, in fact is the far more rare of the two patterns. There’s an interesting discussion of the reasons why this pattern has come to the probable “top of the heap” is here: https://worldcyclesinstitute.com/forum/todays-market/expanding-diagonal/
(You need to be logged into the forum to be able to add to comments on it).
In short, the reasons an expanding triangle is the most probable pattern over an ending expanding diagonal are the following:
- The wave up from ~2025 on May 19 cannot be a final fifth wave, because it’s clearly in 3 waves, so it must be a leg of a triangle. If that’s the case, it’s the B wave.
- Because Friday’s leg up went to a new high, the triangle is expanding. That leaves two options: an expanding triangle, or an ending expanding diagonal.
- An expanding ending diagonal is a fifth wave pattern, but we’re clearly in a fourth wave at this time, plus there’s absolutely no supporting evidence that they even exist. Bob Prechter cited one instance of one in the DJIA, which upon further analysis doesn’t hold water, and Ralph Elliott never identified that pattern in any of his work. I’m convinced it does not exist, based on the work I’ve done on post-analysis of example charts.
- Finally, ending diagonals are “diagonals” (Elliott was very clear about that); they are not horizontal patterns, which this triangle clearly is.
This leaves us with no alternative but an expanding triangle. If that’s the case, we have one more leg down (the E wave) and one more leg up (wave 5). These will take some time to unfold.
There’s also the history of the market to contend with. This is very important: Markets, to my knowledge,have never topped in summer months (the volume and participation just isn’t there). That’s why I’m targeting September for a market turn.
Bottom line: The next cycle turn date (Andy Pancholi) is July 15. The market should hold up until then, resulting in a turn down into the E wave (in 3 waves). The target for this wave up is somewhere between 2126 and 2152 in the SP500 (2116 – 2142 in ES).
Currencies are finishing up their final patterns slowly as we wend our way to the final top (preferably wave 2 in the US indices).
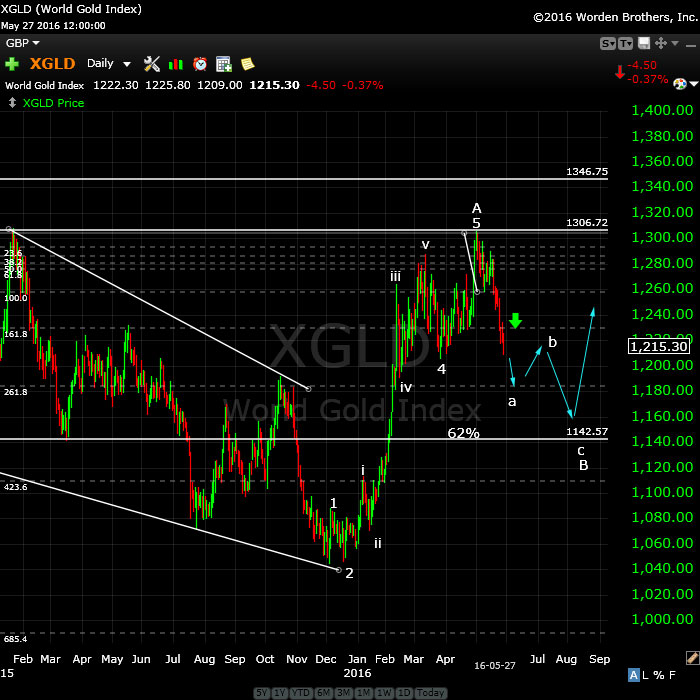
Gold and Oil: Special video report in the forum here.
Trader’s Gold Service
I’m almost finished the technical aspects and I’ve developed a lot of supporting content so that this is also a learning experience for anyone wanting to understand Elliott wave and how it applies to the movement of the market. You may not immediately be able to use it to perfection on your own, but you should be able to understand the basis concepts and use it to forecast the overall pattern and market direction.
Wave Three Down
Here’s a link to a projection for wave three down in the SP500.
______________________________
Here’s a video overview of the market for Tuesday, July 11, 2016:
Market Report for July 11, 2016  |
 |
Make sure you zoom the video to full size with frame expander (arrows) in the bottom right hand corner and also set the quality to as high as your web connection allows. This is an HD quality video so the best viewing is at that level. |
_______________________________
The Charts Going into Monday
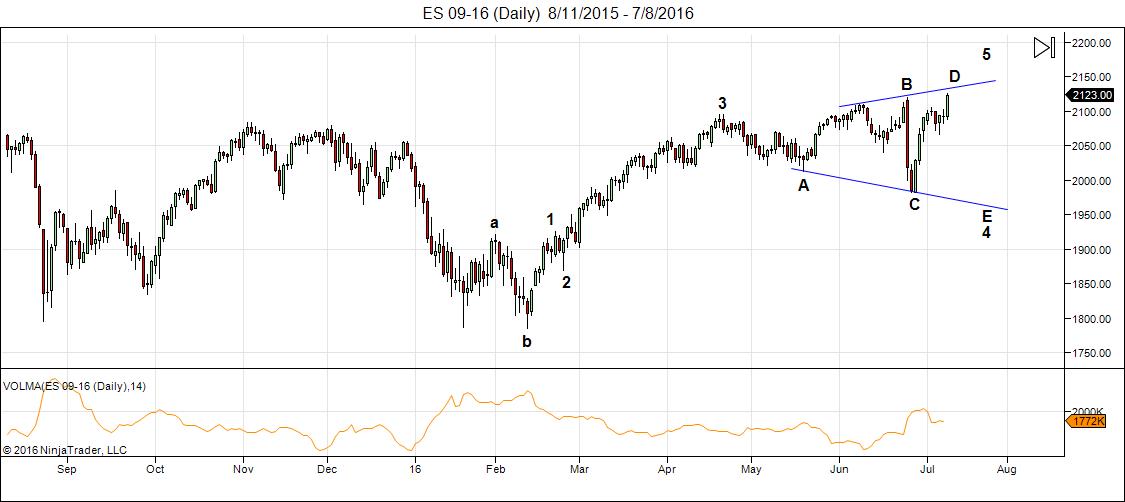
Here’s the daily chart for ES (emini futures) with the count to now. This shows the expanding triangle pattern I’ve identified up top. In this case, we have one more wave down and one more wave up. The wave down should be in 3 waves (a zigzag, which is a 5-3-5 configuration), followed by three waves up to a top.
In an expanding triangle, each wave is typically 105-125% longer than the previous wave. Therefore, I’m expecting to see a top on Thursday/Friday at between 2116 and 2142.
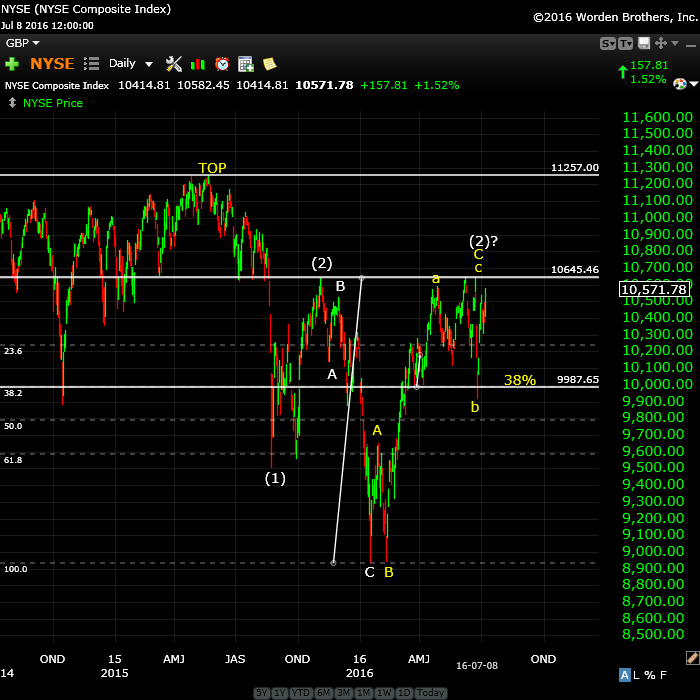
Above is the daily chart of NYSE (the largest cap index in the world) and the one we really need to pay attention to for the US market. This is the big picture and shows the double pronged second wave that we’re in the process of finishing. We’re not at a new high here, so this index could be tracing out a simpler path to a double top, having missed it by $10.00 a little over a week ago.
The bigger picture is that we’re setting up for a very large third wave down.
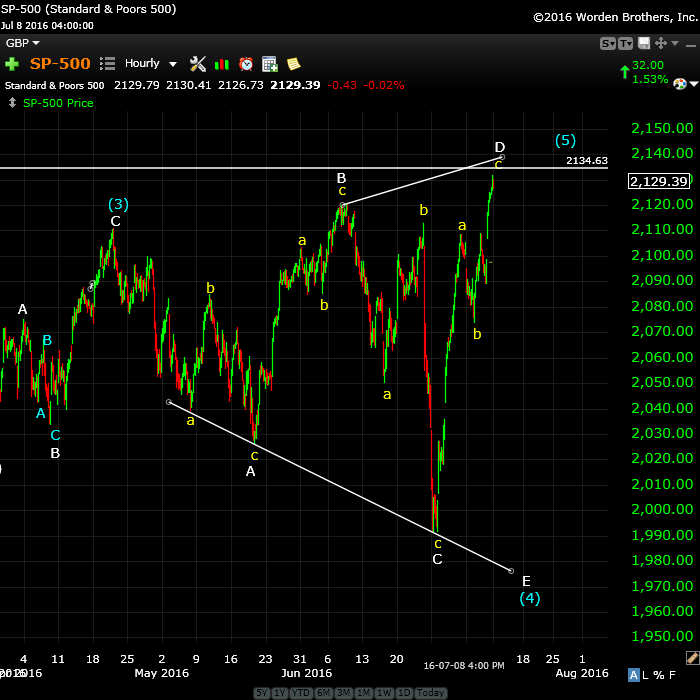
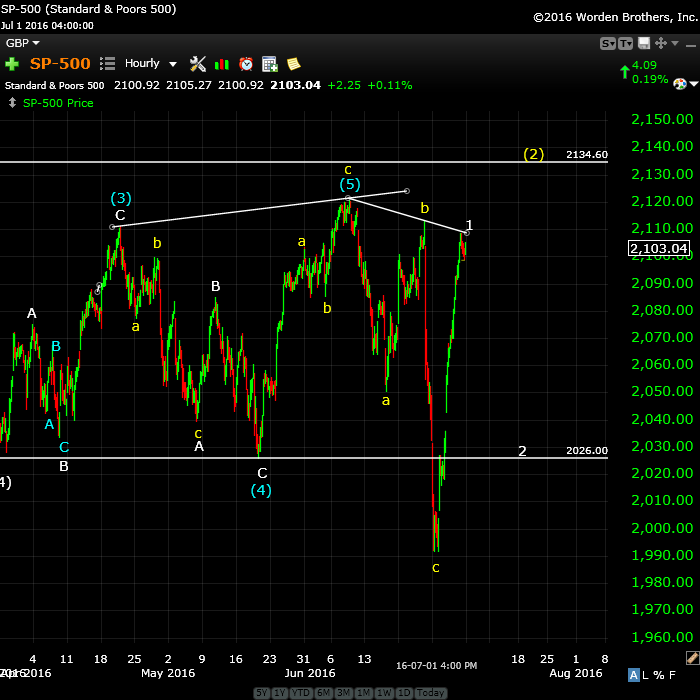
Above is the an hourly chart of the SP500. This shows the expanding triangle about to top. I would wait until later in the week to get short, however. The cycle turn date is July 14/15 and we still haven’t established the top of the present wave. The typical top for a D wave here would be between 2126 and 2152. The previous high is ~2134, which I don’t expect us to achieve (I can alway be wrong!).
The high for this wave should be between 2126 and 2152.
We will then turn down in an E wave with a final wave 5 up to come at a later date.
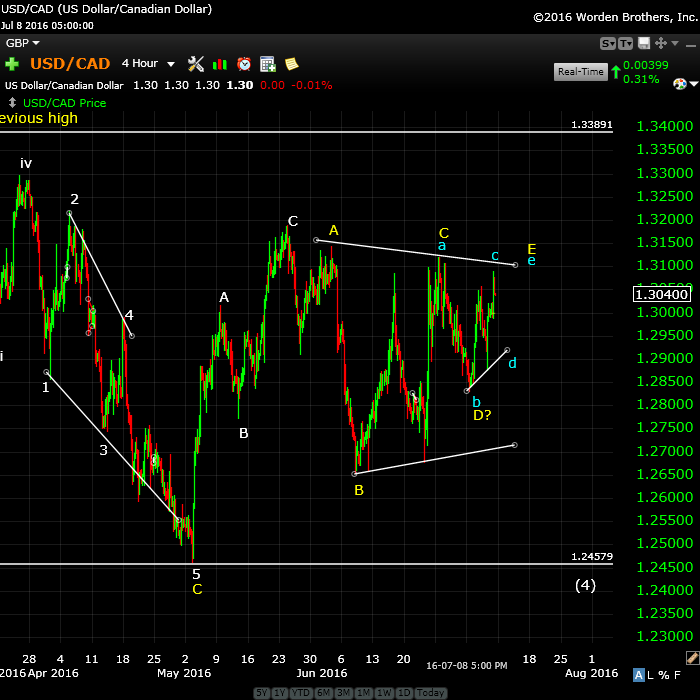
Above is the 4 hour chart of USDCAD. EURUSD, USDJPY and CAD here are all in the process of finishing up countertrend (corrective patterns). As such, it’s likely to be very volatile. USDCAD has followed through on my expectations, but stalled again on Friday and seems to be forming another smaller triangle, which triangles can do in either the C, D, or E wave. This is the D wave.
We will eventually reach 1.245, but how we get there is a bit of a question right now. My higher probability projection now is to complete this triangle and (with a turn up in the euro chart) to turn down to complete the final fifth wave of the pattern.
After that, we’ll turn up in a very large fifth wave in the opposite direction, which will eventually take up to a new high for USDCAD.
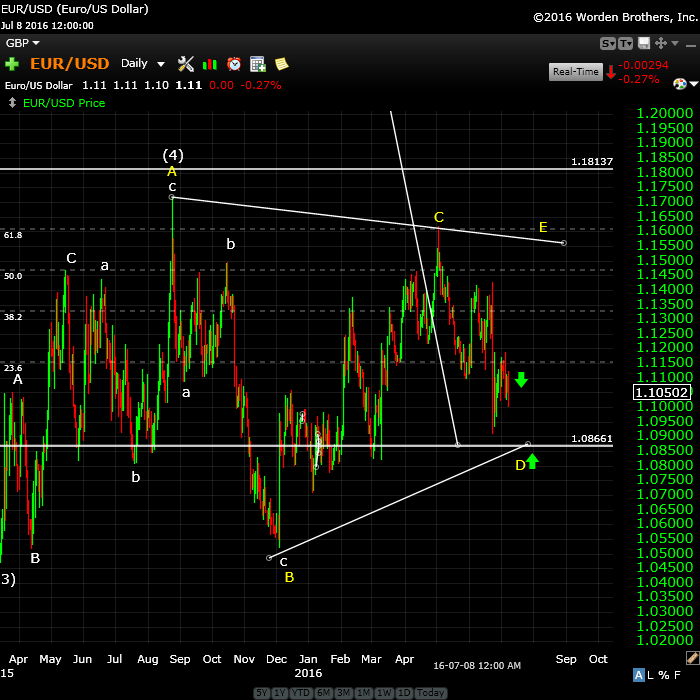
Here’s the four hour chart of EURUSD showing the ongoing triangle—the major (combination—a flat and a triangle) corrective pattern we’ve been in since March, 2014. We’re in the final stages of a bearish triangle formation, with one more leg up to go to finish the E wave. I’ve widened the triangle here to leave a distance between yellow D and E of .618 X the distance between waves A and B (not shown here), which is the typical wave E length. (I show more in the video)
This means that we should continue to drop to the 1.0870 level and then I suspect when we finish wave E of the expanding triangle in the US indices, we’ll turn up in the final E wave of the triangle.
EURUSD should turn down after finishing the E wave in tandem with the US equities.
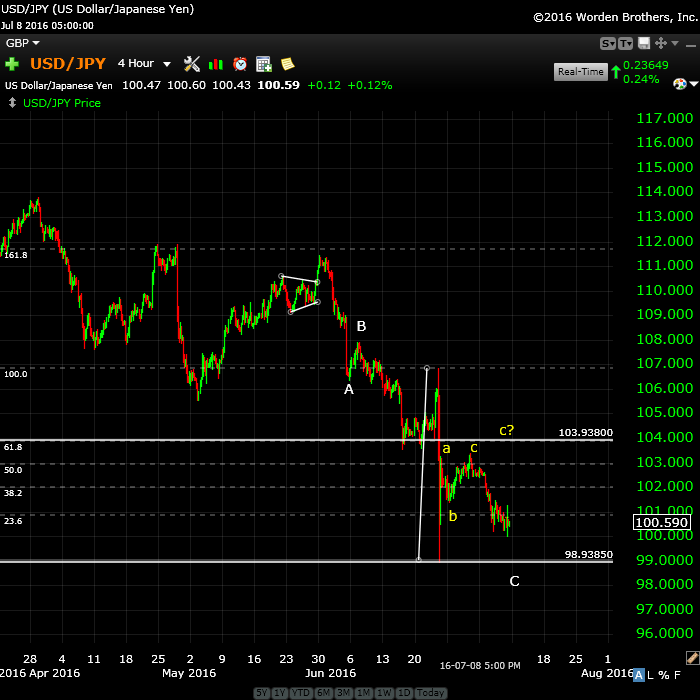
Above is the four hour chart of the USDJPY. I continue to predict volatility here, as well. We need to get to a double bottom, but how we get there is questionable. We headed down last week, but I’m expecting one more leg up at some point. I’ve drawn a horizontal line at the 62% level which with a little more travelling down would be 1 X the A wave. So we may get a leg up to 103.94 and then another leg down to finish off the pattern.
Once complete, we should get a turn up in a very large 5th wave to a new high. Give this until September to fully play out.
________________________
First Wave Down – What to Watch For
What we’re looking for (likely in September) to confirm a turn is a motive wave down in 5 waves at small degree. After that, we should get a second wave that will retrace up in 3 waves about 62%. That’s the preferred EW entry point. So don’t feel you have to rush in. There’ll be a much better opportunity at the second wave level than at the top and the risk is substantially reduced.
You’ll find a diagram in the forum here.
__________________________
History: The 1929 crash
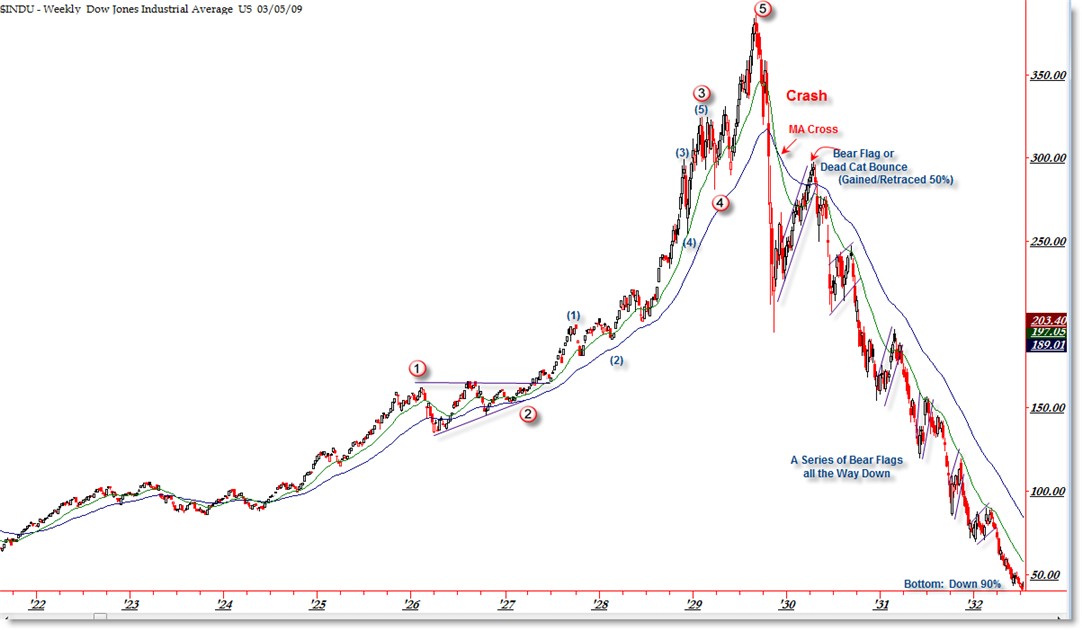
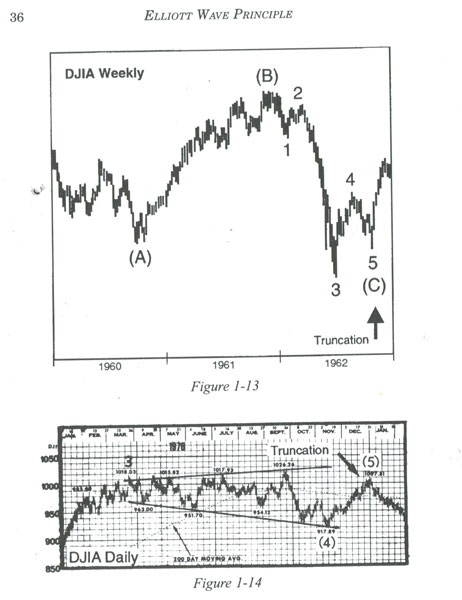
I think it’s important to look at 1929 and the wave structure (above and below), which was the same as 2007—to a point. I will show the 2007 crash below in the “What If” section.
The wave structure of the 1929 crash was in 3 waves overall. There were 5 waves down from the top (the A wave) and then a very large B wave retrace. The final C wave down was a stair-step affair and lasted over 2 years.
Let’s look a little close at the timing of the 1929 crash because the similarities to today are uncanny.
The market peaked on September 3, 1929 and then it took 2 months for the crash to actually happen (to reach the bottom of wave 5 of the A wave). The larger crash which we always hear about began on October 23, 1929. Then there was that large B wave, which lasted 5 and a half months and finally (which I explain a little further in the cycles section below), the C wave which went on for more than 2 years. This might be the scenario we’re looking at going forward.


Gold and Oil special video report is in the forum here: https://worldcyclesinstitute.com/forum/long-term-charts/gold-and-oil-special-video-report-july-10-2016/#p108
Excellent Elliot Wave analysis of market, thanks Peter Temple of Worldcyclesinstitute.com!
ES ( S&P Future reached ) reached 2133 … one point short of my minimum target 2134.
peter,
you are always talking about the FIB level being the focus of the market.
so the 2008 october high was 1576.09
the march 2009 low was 666.79
the price difference was [1576.09 – 666.79 = 909.3]
so 909.3 x 1.618 = 1471.25. when we ADD the 1.618% fib extension to the 666.79 low we get [666.79 + 1471.25 = 2138.04]
the market only got to 2134.72 in may of 2015. is the market ultimately trying to get to 2138.04 level before it is finished??
for clarity, the above is discussing the spx price levels
so the futures overnight will indicate that we will “thrust” hit that fib level of 2138.04 in the cash [spx].
will andy pancholi be 100% correct. will the week of 7/15/16 mark the absolute 350 year turning point for the market?
is the 1.618% fib extension level of 2138.04 the fib goal of the spx?
“if” the 2138.04 level is the goal of the spx – then that makes the feb 11th 1810 low the beginning of the 5th wave of the C wave from the A/B/C low of 2009. [that is the 2134.72 is the 3rd wave of C top, then an a/b/c 4th of C wave corrective to 1810]
if so, the ‘expanding” prices we are currently exhibiting may in fact be an “expanding ending diagonal” of the 5th wave of a C wave to 2138.04 – a ‘unicorn’.
see forum [expanding 2.0?] for some quick whipped up charts.
if the spx 2138.04 is the fib goal of the spx – then we should see a “pop” to this level at the open, and then price exhaustion and a “capitulation” type “fall” should occur. my only advise – ‘its time to put on the adult diapers’.
Rich, a simple point of clarification…It is actually the October 2007 high at 1576 but you are…
Precisely on target. Thanks!
thank eddie! yeah, 2007 it was! too much cocaine – “just say NO to cocaine”! :-))
Peter, Could you clear up a point. If we exceed 2134, how can this continue to be wave (2). 2nd waves cannot exceed the lengths of 1st waves, i thought. Thanks, TAJ
https://worldcyclesinstitute.com/forum/us-equities-and-futures/a-new-high-for-the-sp500/
sound, reasoned analysis…thanks for sharing…
I hold on to my prediction we will turn into Andy’s date starting tomorrow after that 18/21 July up again.
2138.04 fib level has been hit! should feel like a brick wall to the market?? market capitulation time??
back below 2138.04 fib level – can you feel it coming? projectile vomit time?
Big bear is around the corner we needed a new high for the cheerleaders.
class A type negative divergence in momentum, strength, breadth from spx may 2015 high, and now.
technical support that this is a wave 5 of C from the ABC 2009 lows.
NYSE has missed 15 points to the previous high once more up to now
NYSE seems to touch the target
Dear Peter, I guess this is good by. It has been a wonderful association with you. You are a kind, generous , and very smart man, as told you , I am very old and have no business in any market. My trading time is over. i will say one thing, i think you are a bit early on going private , as i think the best time would be after the top, as you would have a lot to be proud of and to show outsiders. Any way the best to you and yours , god bless you Peter Temple …….Nick…
Thanks, Nick. It’s time. Going “private gives me incentive to put in the many hours of time required to do a good job. Best wishes to you and thanks for hanging in there all this time. I remember your notes when we hit the top NYSE top back in May of last year …
I need help on what I need to do to be a subscriber! Cost? I have trouble navigating the site!
Ed,
If you mean a subscriber to the forum, just go to the forum page (via the menu) and click on the sign up menu there. More info on the service coming tomorrow, which means I’m signing off for today.
I posted this chart on the Solarcycles site back in early June:
https://postimg.org/image/mtwbzw42j/
Apart from the blue iv near the top right which I believe is either on-going or ended at the Brexit induced swoon, I can’t think of any other count that would make sense.
In some respects having the S&P500 make a new high sort of confirms that we are in a ginormous ABC of a huge 4 (currently in B, with C yet to come) before a 5th up rather than the start of the Bear.
What would be really nice is if the current wave up in the DJIA took a dip back to 18100 and then took out the May’15 high. That would make this a 5 waver up from the Brexit low and would bring the S&P & the DJIA in line before a drop back towards last August lows for the C wave.
Greetings to all!
I’ve been off planet for a while ~~
Does the new all time high in the SnP just now have much significance to the count(s)?
I remember from last fall especially with respect to the cycles, the SnP should have tested 700 or so. Back in that timeframe I was looking (pretty much based on Martin Armstrong) for the US stock market to keep rising on GLOBAL funds flowing to the US as a safe haven. This is pretty much still the case. The Dow should test ~22,000 unless his downside support is breached.
Hope you all took my advice on Silver at ~$13.50. The best is dead ahead : )
Best Regards and best of luck Peter.
Gary G (DC).
Fuel for higher prices..
http://www.zerohedge.com/news/2016-07-11/something-big-indeed-came-bernankes-japan-visit-sparks-monster-rally-after-helicopte
Bank runs in Italy.
https://www.armstrongeconomics.com/world-news/sovereign-debt-crisis/banking-panic-in-italy/
Looking forward to the end of the week and expecting a big market turn as per Andy Pancholi. If not I begin to question the accuracy of the market turns. A big one like this should be spot on.
the market needs a “wafer thin mint”!!!
https://www.youtube.com/watch?v=HJZPzQESq_0
rish THAT IS RICH!! Lurved it.
SP500 should do a smallish 4th wave before it’s done. The C wave only has 3 waves and with a zigzag (5-3-5), the C wave should have 5. This would mean a day down likely and another day up, and then the turn down into the E wave.
USDCAD has popped through the upper trendline of the triangle, so it looks like it will indeed work its way to the higher target area before turning down. EUR USD just keeps inching downwards.
Inspired by Whitemare a bit more on vedic. Don’t worry, this weekend I’ll post it on the forum.
It’s about lunar mansions (houses). This concept comes from chinese Astro. The moon does a 28 day cycle so a new house for every day (28). The Vedic system adopted this system but lost one house along the way and now uses 27. I prefer to use 28.
One full life in vedic is 120 years and each of the nine planets rule part of this (vedic stops with Saturn). The lunar mansion the moon is in at time of birth determines where we start in this 120 year cycle. When the NYSE was born, the moon was in the second mansion and this mansion is ruled by Venus. This is the last dasha of 20 lunar years. So we add 20 times 354 days (lunar year) To 5/17/1792 and again 120 time 354 to fast forward. Now we start a new sequence with Sun And find this today we are in the mercury dasha that started sept 2001.
This 27 lunar year cycle is now devided in 28 mansions. We are now in the 26th, from 6/9 until 1/10/17.
This mansion is bearish. If this theory is correct the market is down into jan 2017.
Remember 6/8 was a major high.
All very experimental but this timing confirms the 78 week cycle I wrote about this weekend. How is that for coincidence?
March 18 we enter Ketu (7 years cycle) that brings us into dec 2024. The midpoint of this dasha is 8/6/21.
Cheers,
André
Typo; Mercury =17 years.
Andre, Where are you posting when you refer to “this weekend?” Thanks!
The forum. Will see we need a new thread.
You can create a new topic on your own. If that doesn’t do it, let me know what you need.
Thanks; I will.
Thesis, antithesis, synthesis.
The 25 week cycle gives the high 7/15. The dasha system gave the high 6/9. The difference is 36 days. Adding half to 6/9 we get 6/27, a major low. I rst my case 😉
André
Does the futures this morning change your projections?
From what Peter last said it should be up until the turn date at the end of the week so might be time to start building shorts from tomorrow or later today if this irrational rally continues higher.
Thanks. I was just looking at the trend line, it looks like it is just touching at 2140.
Nope.
The market is euphoric now. Analysts now calling for S&P going to 2200, 2300, and 2500. Bond yields are plummeting and the rest of the world is a mess (Japan, Europe, etc). Could it be that no crash takes place in 2016 simply by looking at capital flows and central bank manipulation? Plus an election year.
I guess I’m trying to balance some of the fundamental stuff I’ve tracked for thirty plus years with my new EW and technical learnings. I know you say events don’t change market trends but the trend is still clearly up and now analysts are saying this is the next leg in the bull market. How does this just change on a dime?
You’ll likely hang onto your fundamental outlook for awhile. It’s two different worlds. I look at the technicals knowing the waves and marvel at what people do at the euphoric highs (the event they create). The media is blaming these highs on the Japanese helicopter money, but we knew the technicals were taking us here well ahead of that announcement.
It turns because we get to the end of the fifth wave, and as we do, the volume gets thinner, and thinner, and thinner.
“Analysts” (in name only) get euphoric because all their money is in the market. It’s a sign of how hooked the market is on its own success. It’s the recipe for the turn. All the money’s in.
Thank you for the explanation. That’s helpful. Yes it’s tricky to unlearn 30+ years of training. This old man will get there slowly but surely 😉
Now looking a to your latest charts, the waves tell us the target is 1960 then we head back up for the final top if I’m tracking correctly. (Probably 2150-60+)
I just added a chart of ES up top as at now (8:45 EST).
Peter, there is the little matter of the DJIA ‘needing’ to get to a new high too. It’s about 50-100 points on the DJIA from when I’m writing. UrrrrGH!!!
So I guess we still have another ‘up’ day before your chart pattern comes into play.
Although given how long all of this has dragged on my ‘preference’ would be to have a dip to form a w-4 low from June 26/27 and then take out the previous DJIA high. That way we can get on with getting the next wave down…..whatever that may be.
It doesn’t need to get to a new high. That has nothing to do with the pattern.
Yes Peter…. I agree that it doesn’t ‘need’ to get to a new high ‘for the pattern’ but given the proximity, there are a zillion bidders ‘wanting’ it to got to a new high.
Hi Purvez,
I think you like this one:
André Tiedje:
He is from Germany and very popular due to his trackrecord.
Take a look at his vision,looks at lot like yours after the new high (today?),the market will fall but wil rebound again just like you are telling us.
http://www.godmode-trader.de/artikel/ew-analyse-dow-jones-die-18-00000er-psychomarke-faellt,4770034
Hi John
My german is sadly ‘very poor’…..but I can still read german graphs. Ha who’d have thought that eh?!!
The ‘C’ down that I’m referring to is a LOOOOOOT LOOOOOOWER than what Andre is projecting. My ‘C’ down count should be nearer the Aug’15 / Feb’16 lows
That little high on SPX might represent the fourth wave, but I still don’t expect a true turn down until later in the week. I also think the SP500 is at the very upper end of the guidance number, although I haven’t checked. I’ll be away for most of the day.
Peter, not sure what you mean by :
‘hat little high on SPX might represent the fourth wave’
A fourth in a bull trend would a low rather than a high. Hence my confusion.
Purvez, I just posted a chart of SP500 to illustrate what I was looking for … the 4th and 5th wave of the C wave. Small, but I think we have them all now.
Peter, yes I see what you mean. Thx for the explanation.
Speaking from a ‘personal bias’ I do wish we can turn this wave in to a 5 waver and be ‘done’ with this infernal gyration. It’s making me dizzy….despite the fact that I make most of my money from such gyrations.
Boy …. ME TOO!
The bigger the euphoric rise the faster the drop. DOW has pretty much made new highs so we can get on with the drop now. Most likely all the bears have been wiped out so the majority of the market is now bullish which is a perfect recipe to end this bull leg.
sword of Damocles….
http://www.marketwatch.com/story/amid-brexit-debacle-another-eu-crisis-emerges-southern-europe-2016-07-12?link=MW_latest_news
The Criminal CB bankers now this and are fighting to keep thinks up.
Pardon :know this
Amazing! We’ve made it to Peter’s upper SnP number 2152 (2151.96). It will be interesting to see if this is the absolute ceiling. If so, the turn down comes today.
Hi Peter – can’t thank you enough for all that you have taught me!
I want to subscribe to the paid service you will be providing – how do I do that?
Thanks.
I’m standing with my Aug 4 th turn date for the high .
I’ve looked all over the internet and I cannot find anyone
calling for this date as a high .
the next date beyond that is Sept 8-9th based on the decinial
pattern .
the key in my work is August 4 th .
the risk ? breaking through 18300 on the Dow now projects
19500.
Aug 4 high
Sept 1 low
Sept 16 high ( Sept 8-9 fits but Sept 16 is the date )
then goodnight .
Jan 2017 low
Oct 2017 high
Jan 2018 topping and starting point for mega bear market
Joe
Joe, please may we understand the ‘basis’ for your projections? Thx in advance.
chris Carolyn solunar model is calling for aug 3 top too
Hi Purvez,
He is a legend in Germany,I read his blog tomorrow is Daxit day so the top of Dow is in or tomorrow his projection is that is will stay a little below 18.400.
John, on that basis I’m very much looking forward to tomorrow. Hope we ‘xit EVERYTHING tomorrow.
I’m bored with this infernal ramp. There is NO FUN in a one way market even when you’ve got the direction right.
Yeah me too,
Interesting fact he wrote this at 7/7/16 ( to Daxit) ,so Iet’s see if Andy Pancholi is right about his days.
Hi John
Could you please tell me the url of the legend in Germany ?
Thanks
Here’s the link:
http://www.godmode-trader.de/artikel/ew-analyse-dow-jones-die-18-00000er-psychomarke-faellt,4770034
http://www.godmode-trader.de/autor/andre-tiedje,30
You can sign up he has a free blog but it is all in German.
Lunars are weak next two days. Price is at peak. Mid July often has selling. I sold my Vix calls with minor loss and bought SPY puts that expire this Friday.
I wouldn’t short here at these levels. We are in the blow off top. All the institutional money coming off the sidelines. No bond yield so the money is flowing like milk n’ honey. Maybe a little pullback but the money to be made is on the upside as we hit 2200 to 2400
Hi Travis,
Little pull back is all I am looking for this week or next. 1 or 2 percent from these levels and I will move to cash, and then move to long side after next weeks Republican (Trump controversy) in Ohio.
Or if selling is fast and deep, may hold on for 3 to 5 %.
Deep, but not fast, imho.
Here’s a “sneak peak” at the Premium Service sign-up page, but it won’t be live until Friday, because the first full post will be Saturday. I’ll send out emails on Friday and Saturday. https://worldcyclesinstitute.com/traders-gold-signup
Peter I have dumb question, U were looking for 2115 for long time, Now we have reached 2151, inorder for 2nd wave to finish completely, why you want it down to 1960 and up again. is the formation not complete or what is it. thanks
I’ve posted the current pattern in the blog post and the guidelines for wavelengths. Not sure what else I can say.
Nodal Venus and Mercury will enter a bearish mansion together 7/17, just as we are 6 e-years from the 2000 high. Big weekend ahead.
This is my last post. No hard feelings but I feel uncomfortable posting on a paid service site.
So lots of luck to everybody.
Cheers,
André
Purvez
when you ask me for the ” basis” for my projections
are you asking about timing or price ?
if your asking about price then i’d start by saying
look at a chart of the Dow from 1923 to 1929
you will see that once the Dow back then broke
above 183 that level became support
183 * 100=18,300 <_———–
if your asking about my basis on the timing ?
I'll keep it simple .
how many bull markets have lasted longer than
8 years ?
I watched a video seminar of an old market timer
his name I can't recall yet he is still a trader today
he taught his daughter to trade and she at around 12 years old
I think entered a trading contest and won.! people thought
oh he was just helping her yet I'm not so sure .
anyways he commented on typical trends on short day trades
in bonds he went into keeping focused and then kind of off
the cuff he said this .
after a presidential election when the republican party takes back
the white house the people tend to sigh in relief and then the stock
market rallies .
on another note from a historicsl trend ,another well know analyst
states that when the US dollar rises with in 6 months of the election
the outcome becomes a republican win in the Whitehouse .
those are odd ball thoughts based on others research .
my timing for a 2018 high is based on my research and I have my own
longer term wave count I'm working with .
bottom line , the Dow can hit 23000-27000 to as high as 38,610
breaking through 18300 is just the level it must hold above
to project higher prices .
this bear cycle from August 4 into Jan 2017
Will be the defining moment as to whether those bullish options
stay on the table .
money management wise as we enter the August 4 date I intend
to reduce my stock portfolio in anticipation of a decline which
May become ugly yet that does not change my perspective on
a bullish stock market for most if not all of 2017.
8 years from March 2009 is March 2017
Oct 2017 is my target and that is where I will exit every single stock
I own and Jan 2018 my bias will be extremely deflationary .
it does not matter who gets elected we will end up with a huge bear market . what will matter is what rights we will have or won't have .
no way will socialistic policies survive . the banks won't get bailed out
which means your money in the bank will be lost.
commodities will rule ( they don't give away corn and it will keep a value even if very cheap )
I have said this many times .
the question becomes where do you put your money ?
money in any financial institution will be at risk.!
government bonds ? nope
even cash ( like cash in your pocket ) becomes a risk.
look up civil asset forfeiture ( it's being abused in the USA )
law enforcement budgets now include those asset forfeitures.
look up what Oklahoma just did ( atm machines in cop cars )
they can just charge your credit card or debit card and not charge
you with a crime .
there is no law in the USA , and we're voting for the 2 least liked candidates ever in our history.
cashless society ? I hope not but if so you better buy up something to
trade with .
some governments have already forced people to list their assets
or face criminal charges .
we're going to see a civil war before this ends .
I could go on and on .
I'll close by noting something .
if you knew beyond doubt that a event or war or hurricane etc was going
to happen on a certain date ( I know we never know )
what would you do ? sell your house to avoid the disaster ?
move your money to another country perhaps ?
if you lived in Europe right now where would you move your money to ?
Russia ? China ? USA ?
just a thought
good luck Peter
I wish you great success
this is my last post as I agree with Andre' and also don't wish
to conflict with Peters paid services .
good luck all
Joe
Joe, thanks very much for the detailed explanation. My question was directed at the timing aspects. I agree with what you say about the next 4-6 years.
It’s difficult to convince the rest of the family of the LEVEL of pain that is coming down the road. It will of course be too late to take action once it starts.
Best of luck to you too.
Purvez
Dear readers,
I m also saying goodbye to everybody and many thanks for all the things I have learned.
Peter, I wish you all the best and succes with your site you did an amazing job.
Joe ,Valley and André I will miss your original posts on this blog and Peter maybe it’s an idee to make a free blog like this one for your readers and subscribers ?
Good luck to all.
The free blog isn’t going away, but I won’t be posting the same material as the paid service, obviously.
Thank you for continuing your free blog. I faithfully read it every day. I also live in Alberta (small oilfield town) and my husband and I trudge along trying to keep our small business viable. We don’t do any stock market trading but I am fascinated by and enjoy all of your cycle and pattern information very much in the markets, climate and the world in general. We live in interesting times and wisdom can be gleaned from many places ~ thank you for being one of those places!
Theresa,
Thanks for this post. I feel a particular kinship with folks like you. For many years, I produced high-end corporate television for the oil patch, working out of places like Sundre, High Level, etc. I’m doing research on ATB right now, one of the world’s few public banks (North Dakota has the only one in the US). ATB will be much safer than the big six in Canada, which have bail-in legislation percolating in parliament to confiscate deposits when they eventually fail. So keep that little nugget in mind. I’m sure I’ll cover much more on that in future.
This will be a revolution by and for the people, so while it will be really tough in the short term, it will be a better world down the road. I’m attempting to regulate my time a bit better so I can spend more time writing about the important changes that will affect us all in the coming months. I appreciate the kinds words. Take care, Theresa.
Peter, I agree with John. It is a suggestion to keep the free blog open also. thanks
I agree also , can”t hurt……Nick
I’ve never said the free blog was going anywhere. It will remain.
I posted a couple of charts at the top of the post.
I am working on a way of making the Thursday webinars available to everyone at a very low cost, so for those of you unable to afford the full service, there will be that opportunity. However, I haven’t worked out the technical details yet.
thanks Peter, appreciate you continuing to think of the little guy…
I’m a little guy … 🙂
Yeah, that’s important to me.
Two questions on the new service – will there be a monthly payment option and will you provide some suggested trades. I’ve been having some troubles on timing. We think the waves should start heading down then they go up because the pattern was something else. But i know this ending top has been more unpredictable than usual. Will it be easier to spot what to do trade wise going forward?
Charlie,
I hope so, yes. People generally over-trade … let me start with that. You have to wait for the set-ups. The only thing I would be trading right now is the upcoming wave down and that’s about it (and maybe a currency, but most of them aren’t set up). The market is really unpredictable at the moment, due to it being a top, and the pattern we’re in hasn’t been cemented yet. Triangles never are until after the D wave as both trendlines haven’t been formed. Most currencies are in small triangles. Once they drop out of them, they set up.
In the hour-long webinars and in the nightly videos, I’ll be able to provide much more info. I find posts very limiting because it takes so much more time to write out the information. The other thing I’m going to be stressing is to find your own system. Now, that could be EW, but it might be that you use EW and cycles to augment a system that you’re using already.
The reason for me saying that is that patterns repeat over and over again. If you create a system that concentrates on a particular pattern, then you’ll likely do much better than trying to snag something that kinda looks good in hopes it will perform. In trading, as in almost everything, less is more.
I’m also providing a patterns library and I’ll be posting a pattern link for most assets I cover when we’re in a known pattern. Each pattern has its own rules and guidelines.
This is a roundabout way of answering your question, but hope it helps.
Thanks Peter for holding on a free blog.
One question,
What is your experience with Andy’s turning points can this also be a big turn that will be more than just 2 days.
Or is it just 2 days (14/15 July) and up again?
Thanks.
John,
The turn will be somewhere within that two day period (I would lean towards end of the day Thursday, but that’s just a guess). We should then head down in the E leg of the expanding triangle, and that should last until the next major cycle turn … likely as long as the wave up did, or a bit longer.
Oke thanks,
Looking at the video’s I know where the next cycle turn date is on the horizon beware of the full moon.
http://safehaven.com/article/41995/a-bondsy-scheme ed Carlson thinks low last week of july to 1st week of august
july 19 is also a turn date on Bradley, some expecting top on that day
Hi Peter,
Will Paypal be the only option for payment for your private service? I prefer not to use them from past experience.
Also, would you be willing to share a summary of your history and progression in trading, what methods/strategies you have tried and what let you to settle on EW and cycle work? Thanks!
Ellen,
Paypal offers the alternative of credit cards.
I’m writing out a philosophy for the service, which I may eventually post some of here.
The shorter version is that I started trying to trade the news, which was crazy, listened to way too much clutter, and then got into trading patterns like flags and pennants, resistance, and support levels, etc. I’ve read every major book on trading and have them in my library. It was at that point with the recurring patterns that I thought, “There must be more to this” and I read a book on Elliott waves, found the Elliott Wave International site, and went with them for awhile. But I found their analysis somewhat lacking and determined that I would learn it inside out. That’s when I really spent the time in the market proving to myself that it works, but that you have to be meticulous in your analysis (and you have to completely cut out the clutter!). I’m now at the point where I see some of the concepts introduced on top of Elliott’s original work to be erroneous. His pure system is the one that’s simply the way the market moves and I haven’t found it to deviate from that system.
More recently, I’ve found the power of cycles only augments the EW system, as EW is poor in the area of timing. EW is about price; cycles about timing.
Thank you! I find trader’s stories very interesting. The common thread seems to be that after all the books and seminars and blogs and (fill in the blank) ….. that one finally determines to do the time and study necessary if they want to make the cut to being a consistently profitable trader.
“That’s when I really spent the time in the market proving to myself that it works”
-A golden nugget right there. Thanks!
Ellen,
Well, you know, you’re right about that. Because like everyone, for a long time I was hugely skeptical. How can the market move in such a mathematical manner over and over again? It’s impossible! Turns out, it wasn’t, and isn’t, and it turned the way I thought about the world upside down.
Then I found the connection between climate and the market and that was like a brain explosion. That led to Dr. Wheeler, Dewey, Chizhevsky and all the other luminaries of the early 20th century. Steve Puetz also came into cycles through trading. A lot of people have. But not that many have put EW and cycles together.
Once I get through this book in deflation, my next one is putting this whole story together … I find it fascinating and I think this revolution is going to lead to a much better understanding of the Universe and how it affects us.
You lit a spark. I’ll stop now. 🙂
Hi Peter,
Thank you for keep the free blog alive!
Is it possible that wave 5 of Primary Wave 5 ended today, and ABC- wave 4 of Primary Wave 5 ended on June 27 2016 ? Thanks.
goldbug2009,
As I’ve said many times before, an ending wave should be in 5 waves and this one isn’t. The final pattern is not complete. It’s possible but it would have to be the first truncation I’ve ever seen, or heard of. So the probability, in my estimation, is very small. EW is all about probabilities.
I’m confused, I thought you said this morning that all 5 waves were in?
I’m confused, I thought you stated this morning that all five waves were in?
Scott,
Tell me what you’re confused about.
Sorry your comments to goldbug above stated that we had not yet completed five ways. Your comments from the chart this morning said that all five waves were in?
Scott,
Five waves are in on the C wave. There’s a chart of the SP500 near the top of the post that I mounted yesterday, I think it was, which shows the configuration of the zigzag wave, which is always in 5-3-5. A wave 5, C wave 5, B wave 3. Altogether an ABC wave.
I got you, so this next move down is an E wave to complete 4, then one more up to 5.
That’s it.
Hi,my dates are 12-20 july and 2 agoust + 1 day maybe,this work 90% time.If day Before was low buy and reverse in Es or Dax,stox5e,best Stockmarket Es.
I am have astrology numbers 1.500 very low in years,hére probably very fast down Before 2 agoust,flash crash maybe.
Regards.
Please clarify. 1) u r expecting flash crash kind thing before aug 2. 2) did not understand what is 1.5 very low astrology nimber
Hi Peter. Great analysis as always. How about usdcad?
Joe,
If it is not a problem for Peter,please keep on posting on the free blog?.
I have been following your work from the beginning and I really appreciate it.
I think most of the readers do.
This wave 3 can’t decide where to stop. The higher this wave goes the higher wave 5 will go. We could be looking at 2200 S&P on wave 5 now. Personally I see extremely little chance of a bear market any time soon. The market has navigated its was through a series of huge negatives so the upside is unlikely to be over this year. I’m bumping my year end S&P target to 2300+ from 2100.
Peter,
It looks like Andy’s cycle turn is to the upside?
Funny because in his video’s he was clearly indicating “write down the week ending July 8 something big will happen in the trend.
I think he also has the CB bankers on board reading his site.
Anyway don’t fight the trend go with the flow.
This is the last free update from Stan Harley also a big bull now.
https://www.equities.com/news/all-time-highs
I’m confused. I thought turn dates mean the market is changing direction? The last turn date was July 1 and the market has gone straight up since the last turn date. What is the point of publishing turn dates if the trend doesn’t change?
Charlie-
From my understanding, there are major and minor turn dates. When andy publishes turn dates he does not mean to say that the market will change trend and stay in that new trend until the next turn date. This where i think EW that Peter teaches becomes helpful combined with the turn date. When i look at a chart, i would call July 1st a successful turn date and the top of the A wave, as the upward trend started the day up, reached a new swing high and reversed on this day and had a 1.5 to 2 day down trend to July 6th ( i am not sure if there was a minor turn date here). For a candle stick trader, this looks like a shooting star pattern, which is a reversal pattern. Based on futures so far we look to be going up into the turn period, so we should set a new high either today or tomorrow and then begin heading down.
So the turn date is used to determine the end of the waves, Elliot wave is used to determine the magnitude.
That is my understanding so hopefully that makes sense and Peter can elaborate on anything i missed.
Chart i am referring to is SPX. Futures looks to have topped during the weekend.
Could not have explained this any better! Thanks, Ted.
A quick check shows I have July 4/5 as a turn date (which was bigger for currencies than equities, really). July 1 was a minor turn date and only for SPX, as I’ve explained before.
This turn 14/15 is the big one for the month.
I placed two charts up top just now (9:15 EST).
I changed my thought on the target slightly for ES. 2182 would be an upper end. We could just as well turn here, which is an Andrew’s fork area. In any event, I would wait to confirm a turn with a lower high.
On SPX, i also see we hit a 2.618 at about 2170 using the Feb 11 low and the top of what you labeled 1 on 2/22.
So we’re close … we just need the darn turn. 🙂
gap up everyday, don’t know if it will turn down unless surprise bad news, light volume, wedge, nothing matters, global central bankers
July 14/15/16 “really, really important”…”turn date” – Andy Pancholi & Woody Dorsey
______________________________________________________________________
Andy Pancholi forecast July 14/15 as “really, really important”
http://cyclesanalysis.evsuite.com/mtr-brexit-video-optimized/
______________________________________________________________________
Woody Dorsey has repeatedly forecast an upcoming ‘black hole crash’…did a google search for Woody Dorsey’s ‘turn date’…directed me to Dorsey’s website and an offer for a ‘Free Turn Date’…received an email with the identified ‘turn date’…07/16/2016
Yeah and then we have another naughty professor Mahendra Sharma saying exact the opposite.
There will be a strong new uptrend starting when SP trades 5 days above the level 2088
( we have seen that).
Or else from Juy 17th till end of August we could rise 15% or more.
That was from his last free letter the week before Brexit (20-24)
So take your pick.
This is his interview: Dalal Times
http://www.mahendraprophecy.com/userfiles/files/special_interview_june_2016_(1).pdf
I clarify again: Black Holes are great albeit normal Corrections which are typically very rapid declines in very short periods of time. The last 3 Black Holes declined, on average, around 19 trading Days. New highs in the S&P does not negate the Black Hole profile. The “Black Hole” I identified in August 2014- The S&P made new all-time highs only to fall into the “Black Hole” very similar to what we are seeing now.
Woody Dorsey, July 14, 2016 2:58PM
Thanks Rotrot,
I m very curious what will happen by Monday a big decline or straight up like Mahendra is saying?
But wven woody missed this ramp up
cpc: .42, investor intelligence 56% bull, msn fear and greed: 90% bulls, never seen that, now expected drop to 2020 , don’t know will bring enough fear, as people expecting it will take to 2220
This website is for educational purposes relating to Elliott Wave, natural cycles, and the Quantum Revolution (Great Awakening). I welcome questions or comments about any of these subjects. Due to a heavy schedule, I may not have the time to answer questions that relate to my area of expertise.
I reserve the right to remove any comment that is deemed negative, is unhelpful, or off-topic. Such comments may be removed.
Want to comment? You need to be logged in to comment. You can register here.