
The Center of the Financial Universe: The US Dollar
The movement of the past few days prompted me to do a deep dive on the US Dollar—a renewed interest in the “big picture”—where the dollar is going longer term. In this case the technicals tell a much different picture than the prognostications of many of the pundits, which are muddying the minds of investors and anyone else with a question as to what the future holds (in terms of deflation vs. inflation).
From a fundamentals perspective, to anyone who knows anything about our ponzi-scheme of a banking system, it should be clear that spiralling deflation is on the horizon. After all, credit is already starting to freeze up internationally, once mortgages start to go bad in the thousands (and digital money starts to disappear, along with a lot of the banks pushing digital currency), plus the eventual reckoning with the extreme amount of corporate debt out there (thanks, share buy-backs!), then all deflationary hell is going to break loose.
But, what do the technicals say?
Let’s look first at the relationship between the US indices and the US Dollar. To do that, it’s important to look at the major turns of both assets.
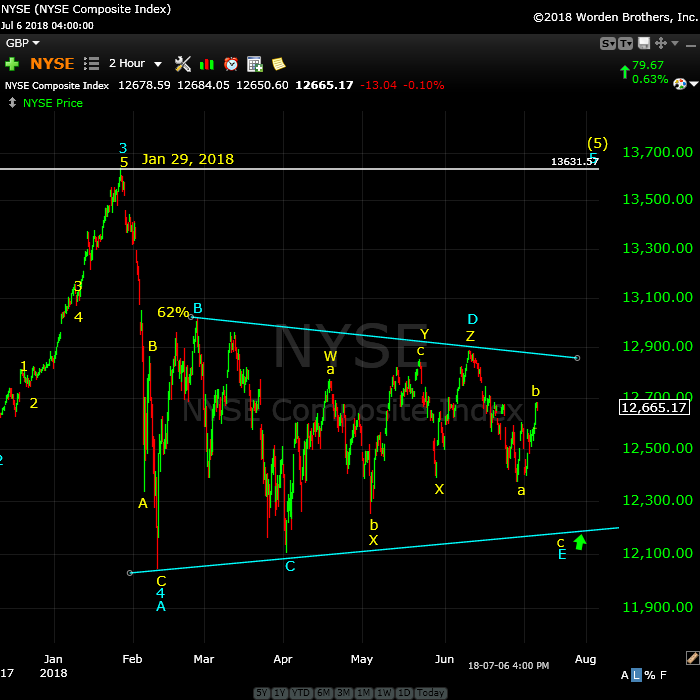
Above is the two hour chart of NYSE (New York Stock Exchange), the largest exchange in the world, by market cap. Notice the turn on January 29, 2018. This was the top of the third wave of a corrective wave up from 2009. The subsequent drop sent us into a fourth wave contracting triangle.
Contracting triangles (in fact, any triangle) in the fourth wave position announce the end of a trend. They’re the penultimate wave, or pattern, before the trend change. To that end, once the E wave of the triangle is complete, there will be one more wave up in five subwaves to a new high to end the trend. The market will then turn and head in the opposite direction: That direction is down … a long way down.
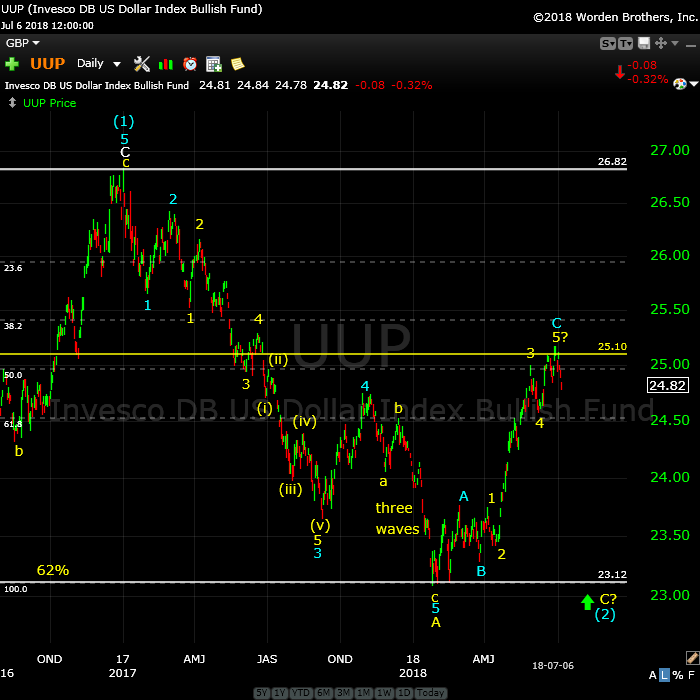
Above is the daily chart of UUP. The Invesco DB US Dollar Index Bullish ETF provides inverse exposure to an index of USDX futures contracts that rises in value as the dollar appreciates relative to a basket of world currencies. In other words, it parallels the movement of the US Dollar Index, which I show below.
The importance of this chart (which parallels the movement of the dollar) is due to the fact that it shows a reversal at 23.09 on January 26, 2018, virtually the same date as the NYSE (and related US indices) turned south. The entire contracting triangle that’s played out in the NYSE chart has done so while UUP has rallied to the 25.10 area in a corrective wave. It’s now ready to turn back down to a new chart low (to at least the 23.00 area). I’d give it another couple of weeks to complete the turn.
The turn is setting up to happen just as the NYSE is set to finish the E leg of its contracting triangle. That will lead to a rally up into the final wave of the trend (as I mentioned above)—a final fifth wave.
The point here is that (as I’ve been projecting would happen for the past two years plus), the US dollar is inversely aligned with the US equities market. With one more wave down projected for UUP, we have one final wave up to go for the US equities.
Once the US equities turn at the top of that fifth and final wave, the US Dollar will turn and head up. That’s deflationary. The reserve currency increasing in value is the definition of delation in the financial environment in which we live today.
Now, let’s take a look at the US Dollar index on a longer-term basis.
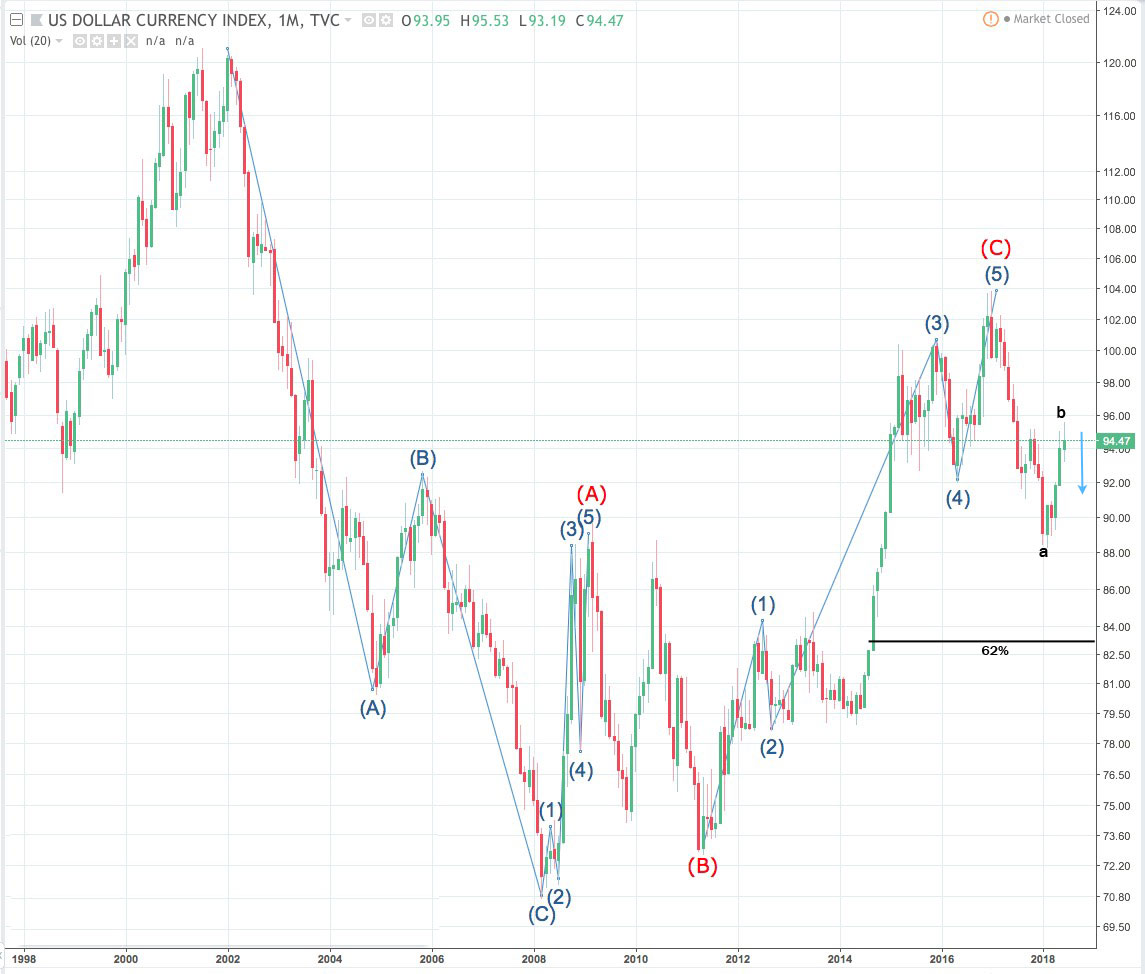
Above is the monthly chart of the US Dollar Index. This is not the raw dollar data, but is the index that’s most widely followed. It’s actually a basket of currencies.
The US Dollar index is explained in Wikipedia as a weighted geometric mean of the dollar’s value relative to following select currencies:
- Euro (EUR), 57.6% weight
- Japanese yen (JPY) 13.6% weight
- Pound sterling (GBP), 11.9% weight
- Canadian dollar (CAD), 9.1% weight
- Swedish krona (SEK), 4.2% weight
- Swiss franc (CHF) 3.6% weight
Nonetheless, it conforms to the Elliott Wave rules, as does any market.
There are several take-aways from the above chart:
- Going back to 2008, you can see that the dollar bottomed as the US market topped (remember the start of the “Great Recession?” Well, this chart tells us is isn’t over). The US Dollar rallied in 2008 into the beginning of 2009 (wave red circle A), when the US indices turned up (as quantitative easing began). The rise was deflationary (the dollar increasing in value); the subsequent reversal was inflationary (red circle B), but it didn’t last. The dollar eventually turned back up, which is deflationary. The Fed has tried to re-inflate, but has been unable to (deflation now has the upper hand).
- From an Elliott Wave standpoint, I’ve labelled this entire sequence to the upside (starting in 2008) as corrective. The reason for this is that although both the red circle A wave and red circle C wave are in five waves, those waves aren’t impulsive. There are three key reasons why:
- The red circle A wave does not have the “right look.” The subwaves don’t adhere to EW rules for impulsive waves.
- Wave blue circle 5 of the red circle C wave is in 3 waves and it not the correct length for a fifth wave (not even close).
- The most recent wave down (marked with small black “a” label) could be considered to be a fourth wave of a larger impulsive sequence BUT it’s clearly in the area of what would be the first wave of the larger sequence (which I’ve labelled as the red circle A wave). That’s basic EW rule and makes the entire sequence “corrective.”
This last sub-point is important, because this means that the entire sequence rallying to new highs will at some point reverse. However, I believe that will be after another series of 5 waves to the upside (at least). This conclusion is debatable, based on the above chart, because there are those that will argue that we currently have a zigzag in place (a corrective pattern) and that it will reverse now, and result in a new low.
So, the bottom line is that the long-term direction is debatable, based upon the Dollar Index alone. But I never just look at one chart …
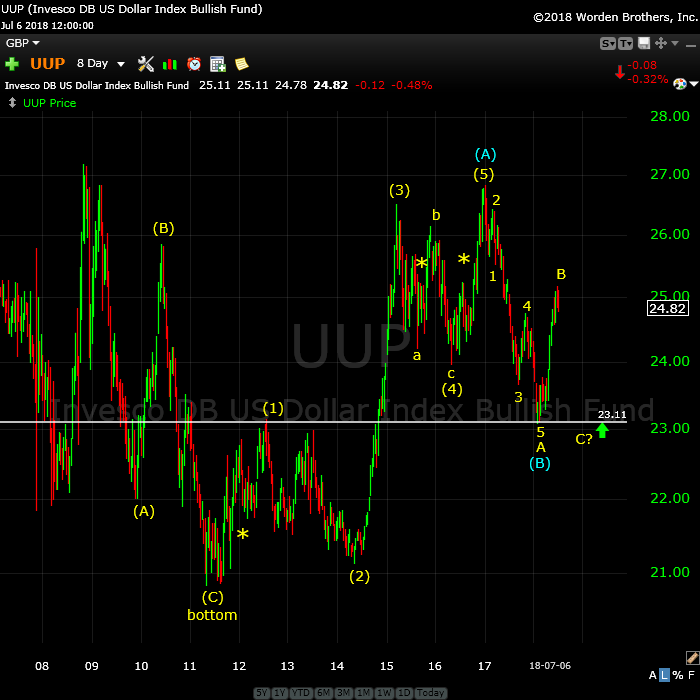
Above is the 8 day chart of UUP. This represents a similar timeframe to the long term US Dollar Index chart above. However, it’s slightly different.
The chart shows five waves up from the bottom in early 2011 (it did not have a lower low in 2008). While the US Dollar Index chart is inconclusive (from a technical perspective, it can be argued that is could go either way longer-term), the chart of UUP is conclusive.
What you see here is 5 waves up in what I’m labelling a blue circle A wave. I’ve done that because this set of 5 waves up is not impulsive (not a long-term trending pattern). I’ve put asterisks at the points where the subwaves are in three waves.
Elliott wave rules tell us we never just have one set of five waves (it doesn’t matter if it’s an impulsive or corrective environment). In a corrective environment, which this appears to be, the least you can have is a zigzag (a set of 5 waves, followed by a three wave reversal, followed by another set of 5 waves in the same direction as the first 5). The conclusion I have to draw from this UUP chart is that, after this downward correction is complete in the US Dollar, we’ll have another set of five waves up to a new high, which is deflationary.
Short term: The yellow B wave on the chart above is in three wave and must retrace to the downside. Backing up that conclusion is that the fact that the yellow A wave is in five waves. As I’ve said above, a five waver always means there’s another wave to come in the same direction as the original five waver. This wave may bottom at the A wave low, or it may go lower. In the case of UUP, as there are clearly five waves to the upside, and the A wave has reached the 62% retrace level, I suspect the C wave may just test that level and turn back up. However, I can’t be sure of that.
What I can be sure of is that it will happen at the same time as the US indices finish the fifth and final wave up to a new high. Remember, that several of the US indices have traced ending diagonals (the Nasdaq and the Russells) and this puts a cap of the US market. The fifth wave of the ending diagonal cannot be longer than the third wave.
Bonds
TNX, ten year treasury bonds (as well as TLT, the twenty year fund) appear to be reversing, which I warned about close to two months ago, or longer. What that means is that money is starting to flow into the US Treasury (a safe haven in times of major trouble) and that interest rates in the US are not going to increase. The Federal Reserve does not control interest rates (I’ve written about this before), they simply follow the market, something they don’t make very well known … (wouldn’t want anyone to think they’re not in total control … lol).
Conclusion
Based upon this work, from a technical perspective, the US Dollar is going to turn and head up (deflationary), as the US equities market tops.
Interest rates are going to stay low and money starts to find its way to the perceived safest haven—the US Treasury.
While we’ll move into escalating deflation (as we have in every cyclical financial collapse in history), at some point, that will reverse, by whatever means. Of course, we have a lot of economic parts moving here, with the reserve currency clearly being challenged around the globe. While I think the overall path is clear, it’s certainly going to be interesting to see how it all plays out in reality.
That’s it for now. I’m sure I’ll have more to say on this subject as the we open additional chapters in our political and economic novel, which is becoming exceedingly seedy.
_______________________
Elliott Wave Basics
There are two types of Elliott wave patterns:
- Motive (or impulsive waves) which are “trend” waves.
- Corrective waves, which are “counter trend” waves.
Motive waves contain five distinct waves that move the market forward in a trend. Counter trend waves are in 3 waves and simply correct the trend.
All these patterns move at what we call multiple degrees of trend (in other words, the market is fractal, meaning there are smaller series of waves that move in the same patterns within the larger patterns). The keys to analyzing Elliott waves is being able to recognize the patterns and the “degree” of trend (or countertrend) that you’re working within.
Impulsive (motive) waves move in very distinct and reliable patterns of five waves. Subwaves of motive waves measure out to specific lengths (fibonacci ratios) very accurately. Motive waves are the easiest waves to trade. You find them in a trending market.
Waves 1, 3, and 5 of a motive wave pattern each contain 5 impulsive subwaves. Waves 2 and 4 are countertrend waves and move in 3 waves.
Countertrend waves move in 3 waves and always retrace to their start eventually. Counrtertrend (corrective waves) are typically in patterns — for example, a triangle, flat, or zigzag. Waves within those patterns can be difficult to predict, but the patterns themselves are very predictable.
Fibonacci ratios run all through the market. They determine the lengths of waves and provide entry and exit points. These measurements are really accurate in trending markets, but more difficult to identify in corrective markets (we’ve been in a corrective market in all the asset classes I cover since 2009).
To use Elliott wave analysis accurately, you must be able to recognize the difference between a trend wave (motive) and a countertrend wave (corrective). There’s very much more to proper Elliott wave analysis, but this gives you the basics.
____________________________
Registration for Commenting
Want to comment? You need to be logged in to comment. You can register here.
If you register, it protects your information. It also allows you to comment without filling in your information each time. Once you’re registered, simply go to the home page and click on the login link top right in order to log yourself in. Usually, you’ll be logged in for several days before needing to be logged in again.
______________________________
Problem receiving blog comment emails? Try whitelisting the address. More info.
______________________________
Have not had a losing week RW 2
Have not had a losing week …I have been with Peter almost a year. The only thing that matters is have I made money with his service. I think I have finally turned the corner using Peter’s EW. I have not had a losing week in the last 5 months. Thanks Peter, for your amazing amount of hard work. —RW |
A true expert in Elliott Wave FL 2
A true expert in Elliott Wave …You are a true expert in EW analysis. What you provide is not available anywhere and is priceless. Subscription on your services is the best thing I have ever done. Many thanks for your effort to make me a better investor. I now have more trust in my investment decisions. I hope you will continue the excellent work! —FL |
Rise above the rest … SM 2
Rise above the rest …I have only ever met a few people who, in their chosen fields (astrology, medicine, music, martial arts, technical analysis), rise above all the rest and you are one of them…you have ‘the gift’…and that’s why I’m a Trader’s Gold member. —SM |
The best of them JL 2
The best of them …Last couple of years, I subscribed to several ‘market traders’. You are by far the best of them and the personal contact is awesome. Daily and daily updates are very well written! Besides your expertise in EW, I also like your cycles analysis. Best investment I ever made! —JL |
Get an upper hand … JC 2
Get an upper hand in trading …Seeing all the different currency pairs and the wave structures and hearing you explain why this has to do that on a nightly bases gives one a upper hand when trading. Elliott Wave applies to all stock and indices and can be applied to any candlestick chart. If someone ask what you want for Christmas – Tell them a membership to Peter’s “Traders Gold!”—JC |
Couldn’t be happier … KK 2
Couldn’t be happier …The analysis and insight you provide is simply amazing! I’ve been trading the futures and equity markets for well over thirty years and usually average around 5% monthly. Since joining your Traders Gold Service two months ago, that number has better than doubled. I couldn’t be happier.—KK |
Tops in your field DZ 2
Tops in your field …You are tops in your field. Tried to follow Elliot Wave international for years. They were always behind the market. After discovering you, I perceive that you are an expert in reading the waves, which puts you way ahead of the rest of your peers. And you can read the Waves like you are reading tomorrow’s financial section. I pray you stay healthy. —DZ |
the real deal SM 2
The real deal …‘Educational, insightful and thorough market analysis for all levels of traders. It’s Elliott Wave at its best….Peter Temple is the real deal’ —SM |
The Market This Week
Here's the latest daily chart of ES (emini futures)
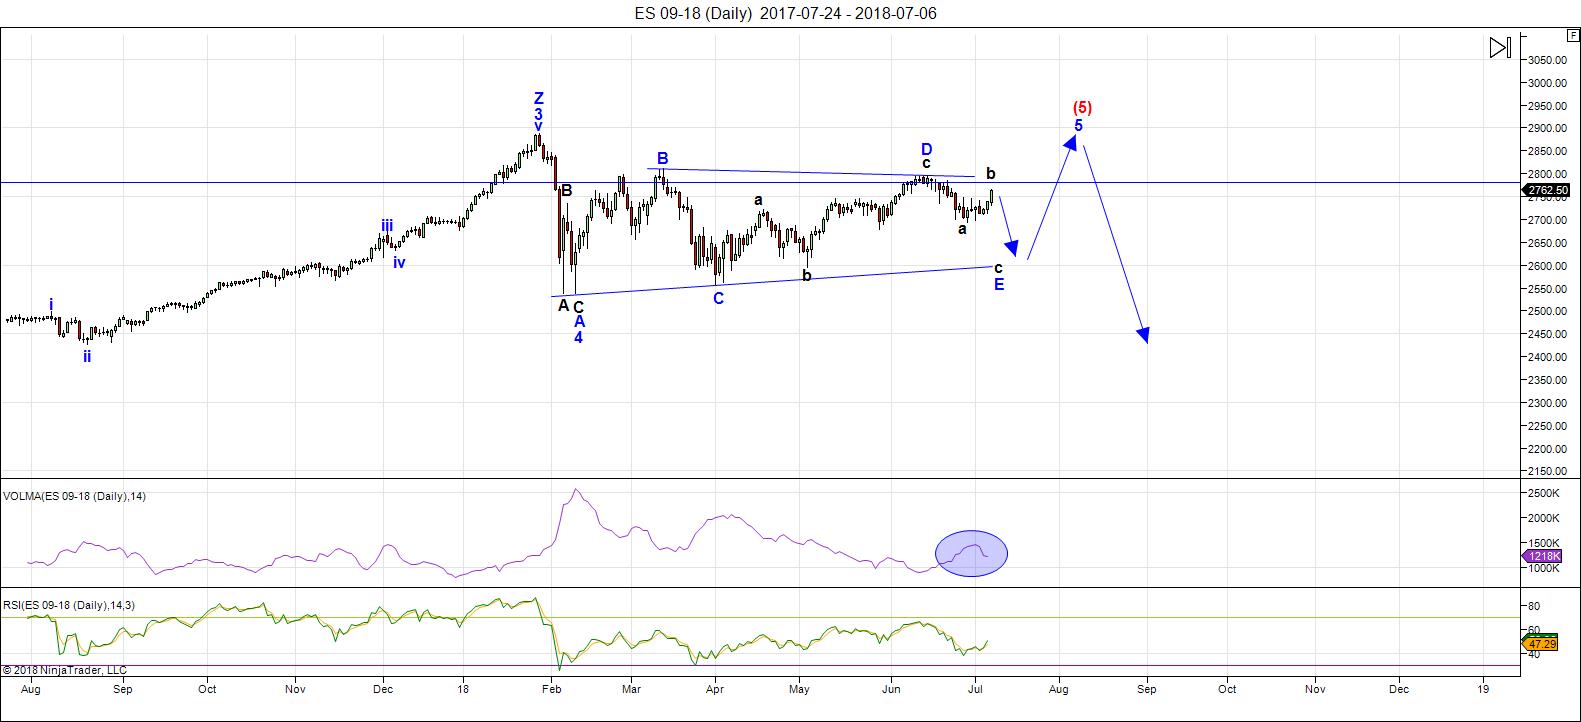
Above is the daily chart of ES (click to enlarge, as with any of my charts).
This past week, I was expecting a rise into the B wave of this large contracting triangle. My target was 2750, due to the displayed weakness of a large bearish triangle that didn't make a lot of sense to me. That's because it had set itself up in the middle of the E leg of our triangle.
However, in a combination wave, which we have (typical in a triangle leg), if a triangle appears as one of the combination patterns, it is always the last one. In this case, that would have meant a fifth wave (out of the bottom of the triangle) down over 100 points, which didn't seem possible (without creating yet another pattern, which isn't possible). As a result, I expected the triangle to be negated. It was.
The 2750 level was pierced and exceeded (markets can wander around the interior of a triangle as they please—rules are few) and now we have an extended rally which reached the 2765 area on Friday. It has another leg up still to go—a fifth wave up of a five-waver.
Keep in mind, though, that the entire sequence up is highly corrective (it has an entire corrective triangle—a bearish one!—below it, so we're not going to a new high, nor is this anything but a B wave of the E leg of a contracting triangle.
One of the reasons for my concentration on the US dollar this week is that fact that I consider it the instigator of this rise. The US Dollar is attempting to top in it's B wave (that's almost always a volatile process). Its volatility is pushing the B wave in the US indices to extremes.
The good news is that its setting up a very much larger drop in the C wave of the E leg. So while it demands more patience in waiting for the turn, the payoff will be that much larger.
Watch for a top in the first part of this week (it may take a couple of days to complete this rally).
Summary: We continue to trace out the E leg of a contracting triangle. Once the E leg (down) is complete, expect a final fifth wave to a new high. That fifth wave up to a new high will be the end of the 500 year bull market.
___________________________
Trader's Gold Subscribers get a comprehensive view of the market, including hourly (and even smaller timeframes, when appropriate) on a daily basis. They also receive updates through the comments area. I provide only the daily timeframe for the free blog, as a "snapshot" of where the market currently trades and the next move on a weekly basis.
______________________________________
Sign up for: The Chart Show
Next Date: Wednesday, July 18 at 5:00 pm EST (US market time)

The Chart Show is a one hour webinar in which Peter Temple provides the Elliott Wave analysis in real time for the US market, gold, silver, oil, major USD currency pairs, and more. You won't find a more accurate or comprehensive market prediction anywhere for this price.
Get caught up on the market from an Elliott Wave perspective. You’ll also get Andy Pancholi cycle turn dates for the SP500 for the balance of the current month. There’ll be a Q&A session during and at the end of the webinar and the possibility (depending on time) of taking requests.
All registrants will receive the video playback of the webinar, so even if you miss it, you’ll be sent the full video replay within about an hour of its conclusion. For more information and to sign up, click here.


Wow Peter,
I have a lot to learn.
When I retire I will do so. (3 years)
Until then, I trust this You and this website.
The High Mentioned for this week is probily 11 july in the early morning (my indicators)
http://www.prognoseus500.nl/
Good luck and be carefull
Keep up the good work, Willem.
Thank you Peter!
An exquisite piece of Technical Analysis and a great example of even when the market does the unexpcted, from a TA point of view the action has to be intelligible and make SENSE!
I trust the other posters here can follow Peter’s example when they offer opinions!
Peter you the man! 🙂
Tks. But it is technical, which may turn off a few folks. This is the correlation I’ve been watching in awe for two solid years, so I thought it was time to show solid examples. I could do this with all the USD currency pairs, but it would be somewhat redundant. And oil. And gold. Everything is poised to end their trends at the same time. It’s getting SO obvious now that even a casual observer (with basic EW knowledge) can see it.
I have to deal with it every day. It makes these odd movements extremely frustrating, because even knowing what’s going on under the surface doesn’t prepare one for the US Dollar stretching a corrective move without warning (and all the assets move when that happens, as they did this week).
Hi Peter, thanks for the update, what is your next level SP500 at 2800 again?
I see an important turn on Juli 13.
Good Luck
John.
Peter,
From a novice point of view, it does not turn people off. Your wisdom makes the market make sense. You reveal a way to take the “guess” work out of following the market. Thanks for all the work you put into the site.
Thanks, Jeff. I’m always concerned about being too technical in a long post. Thank you for such kind words.
Sure looks like middle of third wave…more upside methinks…
I don’t think my original idea of an ending diagonal for SPX is quite dead yet. This is a market I’m going to remember for a very long time … lol.
Momentum is too strong for this to be a “b” wave. Looks like we are back to ending diagonal. Will be tough to get a new moon low now. Maybe we get a significant high on July 13th.
This was a fairly long sideways consolidation. Unless we are looking at a false break-out, a high on July 13 seems unlikely.
I expect to roll my remaining long calls into next week. A move back below 2750 says I’m wrong.
Contracting triangle firmly negated in ES. A very difficult market to predict. Once again stopped out of shorts but holding bull put spreads for more upwards movement, Mr.Market continues to confound as bankstrrs pour on the juice. Institutions continue to head fot the exits en masse and those outflows ate clearly being covered. This is a great example of why alternative counts, at least for traders, and hard stops, essentially a number that says you are wrong, is so important! We are in the middle of a third wave up with more to go.
Verne – some of the individual sectors are still not above their downward trend line (XLF, XLI for example). Given the strength of the move, it would not surprise me if those laggards take out their downward trend lines and head higher over the next 2-3 days. To me, this whole pattern is starting to look ominous from a weekly stand point. If the Q1 drop was an “A” and we are in the process of finishing a larger “B”, then Aug-Oct sets up for a “C” down that will break Feb lows. Bearish set ups in Aug-Oct time frame are pretty nasty. Would love to hear from the astro guys if they see something ominous in the coming 3-4 months.
I agree Vivek. I am trading the move up with extreme caution and VERY tight stops.
The whole think has a very suspicious look and feel. There has been no bottoming process that would convince me this is a sustainable move higher. This is a very dicey market, and I keep thinking about how SVXY imploded with very little lead time. A huge flat indeed result in a new ATH ahead of a devastating C wave down this Fall. Some analysts see that as a possible pattern.
Verne, from a technical standpoint, how would you explain the implosion of SVXY? End of a 5th wave then a corrective down?
To be perfectly honest, my own view is that most leveraged instruments are simply not amenable to reliable EW analysis, and SVXY was one such animal. That was one of the most insane situations I have ever seen and I knew it was unsustainable. I still kick myself for leaving a year’s worth of profits on the table by exiting that trade way too soon.
The absolute corruption of these kinds of instruments can be clearly seen in the complete disconnection of UVXY from SVXY during the vol implosion. Chris Cole of Artemis is of the opinion that SVXY suffered a massive bear raid (lots of leveraged longs) and typical of leveraged instruments, blew up when the event horizon was breached. I personally am not convinced the short vol trade is anywhere close to being unwound. When it does, it will be the trade of a lifetime..l
Another interesting thing that everyone seems to have overlooked Vivek, is that DJI has already taken out its Feb low. Granted it was not on a closing basis but it is really amazing how few traders have paid attention to that fact and how potentially ominous it is…!
Tell tale divergence between RUT, which already filled this morning’s gap, and the other indices.
Who, will follow whom?
I do not trust this market. Exiting long trades. Better to take the money and run.
Buying IWM 169 July 20 expiration 169.50 puts for 1.29, stop at close above 170.
Another huge head fake?
If I might ask, how many contracts do you trade at a time?
Jeff T
Sometimes 50, most times 100, occasionally 200, when very confident.
This market has to be driving analysts bat guano crazy. I have been contending fo some time the unprcedented market intervention has bee skewing market signals and making TA more challenging.
Under ordinary circumstances, most traders would consider this morning’s gap up open in RUT to be of the exhaustion
variety. I shorted RUT after the gap fill, but I would be a fool to think that price could not turn right around and take out this morning’s high. We have seen it before!
If we fill Monday’s RUT gap I will consider the reversal confirmed and add to puts….
IWM puts now trading for 1.52. So far so good. Will add to position on move below 168.38.
Trade should be good for at least a double if we are looking at yet another failed break-out attempt.
Now a bearish engulfing candke in RUT. I still don’t completely trust it. Remember we are dealing with CB corrupted markets and price can certainly do the unexpected. We have seen this too many times not to exppect it could happe.
Selling half 169.50 strike puts for 1.68.
I truly despise this environment created by criminal banksters where one essentially is reduced to day-trading to secure short side profits. I am going to be so happy when this ridiculous bubble finally bursts!
I am now confident we will fill the IWM gap from Monday. Adding 169 put expiring this Friday for 1.00 even.
This should be an easy double in 48 hours or less. Stop at close above 1.70
Minday gap filled…as expected…adding to short position….
Wow! Nice pop on puts!
Nice change from getting kicked around the last few days… 🙂
Trading leveraged instruments is more often than not a complete waste of time.
A rightly timed entry can on occasion return some great gains. TZA 8.50 strike July 20 calls trading for 0.21 look promising… Picking up a for you-know-what and giggles…. 😉
The other indices are going to follow RUT. It is a rare situation when traders get a peek into the future. Buying DIA 249 strike
puts expiring this Friday for 1.00 even. I think today’s and Monday’s gap are both going to get filled. In a few hours more traders ate going to figure this out and the banksters are going to get hammered. Just in case, my stop is today’s high. Lock and Load!!
Banksters trying to hold the line on IWM. They are tying to hammer out a bottom at this morning’s low at 167.58. We move below that and you can stick a fork in ’em.
I am surprised, considering what is going that short sellers have not piled on to move us impulsively past it. The banksters have everyone intimidated…lol!
We should get another fat red candle down in IWM shortly to new lows. If that happens I am backing up the truck…
Not liking the lack of follow through. That is always a cautionary flag. Taking smaller profits on rest of recent shorts and waiting for reversal confirmation. I have seen too many gains turn into losses in this schizoid market. Tomorrow is another day! Later!
My gut last week or the week prior I noted a concern
With the up coming solar eclipse .
What I did not say in detail was the conflict with the
Short term bullish sub cycle cause by the mars Uranus pair
Which called for a low July 2 and a high July 27-Aug 11.
I have mentioned July 27 to as late as Sept 9 as the top
Of this trend .
Bottom line: the solar eclipse July 13 May bring an acceleration
upwards and in doing so negate the triangle ( which I have questioned )
And the final wave count becoming a simple A B C move from the Feb lows .
It’s still to soon for me to state that with confindance yet if so then the 25,800
Level on the cash Dow will be tested . From a flawed puetz cycle point of view
I’d say we are witnessing an inversion ( I don’t believe it but …..it’s possible )
We did not get the new moon high to solar eclipse low yet we also did not get
A true inversion ( new moon low to solar eclipse high ) .
I’ll consider it a failure for the set up though .
July 27 now is the next focul point .
We also will have mercury going retrograde July 27.
July 27 plus 10 days is August 6 th .
If the cash Dow is testing 25,800 near or on August 6
I will begin increasing my hedges as well as taking on
Speculative bearish positions ( betting on a wave C decline to
Below the Feb as well as April May lows )
I’ll post the various crash dates next week since I’m visiting
Family .
I still seriously doubt we see a new all time high in the cash Dow this year .
I don’t have time to explain and not sure which link would have the accurate
Data yet :
Google search :
George Lindsay time spans
George Lindsay time spans for bull and bear markets .
Most bear markets last 406 calendar days yet if you
Look up and find the information you will find the various
Counts .
Lastly, the stock market basis NYSE, spx , cash Dow for example
Have been in a corrective and or bearish pattern for just 6 months .
The end is nigh
Thanks for the comments Joe. I do like the idea of wave “B” completing in early Aug (possibly as late as Aug 10) near 26K on Dow. Nasdaq and SPX have been very strong compared to the rest of the world, and even these are setting up for a nasty move lower in Aug-Oct window. I would not surprise me if we were to get a wave “C” down in the US and a wave 5 down in China at the same time. Vols are very too low for such a move (I mean 3 – 6 month options). May make sense to look at Nov or Dec 255 and 265 puts on SPY.
Let’s if July 13 becomes a cycle low of sorts
Short term
Waning Crescent Moon
The moon is currently in Gemini
The moon is 26 days old
Distance: 57 earth radii
Ecliptic latitude: -3 degrees
Ecliptic longitude: 70 degrees
I was too much of a WUS to maintain my short trades despite the clear bearish signals from yesterday. You know the banksters have done an amazing job of psychological intimidation of traders when we no longer trust our own eyes. Of course, we have seen bearish signals violently reversed so often this kind of caution is understandable. Looking at the price action in futures, it is quite clear they are spending hundreds of millions in an attempt to halt the slide. It has long been my contention that this market is one day going to not simply correct, it is going to crash, and it will do so when the criminal banksters finally loose control of it. That in turn will not happen until the clueless masses awaken to the reality of this gargantuan con game, and that the market is going to give back evety single tick of its fraudulently acquired gains, at their expense! The rush for the exits is going to be something to behold, but of course for many it will be too late. The stealth massive capital flight from the market continues as the banksters cover for these sellers. Are folk really this stupid??!!
Joe as to your point of new all time highs in DOW cash, NOBODY is saying a word about the fact that it has ALREADY taken out
its Feb lows. Strange!!!
Based on what we saw in futures, we have lower to go. They will prop prices up until the close and then brutally whipsaw traders who are going short, instead of taking profits on the move down into the close. Just so you know…
I will not be surprised if we see a decline like aug24/ 2015… on Friday the 13th.
The bears just broke a support shelf the banksters were fiercely defending and forced a new low. It now becomes resistance and they are going to have to spend a whole lotta moolah to reclaim prior ti sending price higher. If we fall away from it, look out below…!
I am really stunned at how an artificially suppressed VIX (synthetic shorts) is keeping a lid on option premiums. EVERYBODY is convinced downside risk in this market is strictly limited…total insanity!!!
The banksters’ next line in the sand is DJI 24,500.00
I suspect the bears are getting ready to inflict some serious mauling on all the eager beavers who jumped on this “break-out”.
Hopefully they took profits early! 😊
They are fighting like hell to push price back atop that support shelf…watch what happens…! 😀
You’ve gotta give the banksters credit. They get an “E” for effort!
Market makers once again trying to rip me off with ludicrous bids on my DIA 249 puts expiring Friday. Who the hell do they think they are dealing with? The SOBs are refusing to bid even intrinsic value on those options!
I’ve got news for those cheating thugs….it is called option exercise!!
You gotta be f–ing kidding me!!
To hell with it! I’m not playing these stupid games with these guys. Exercising in the money options to sell short 10,000.00 shares of DIA. We all know where this is going. The morons trying to rip me off are going to have to pay me the full 249.00 share. Cheating SOBs!
Haha! The banksters did not like that. They did not like that one bit. Huge cash dump! hehe!
I am calling this bluff…big time. Buying another 100 DIA 245 strike puts expiring next Friday for 1.40.
Hedging short position with 100 250 strike calls expiring Friday for 0.13.
They seem to be in a complete panic about holding this DJI 24,700.00 level.
I wonder why?
Derivatives perhaps??!! 🙂
I think it is really telling that they let the sell-off take place in the futures market overnight. This means for the sake of optics they have to keep thing fairly elevated during the cash session. I expect them to bid prices up sharply into the close today. Rinse and repeats. These guys are so predictable it ain’t even funny.
I am off to get ready for the Chart Show. Got lots of questions for Peter! Later!
Now that’s what I am talkin’ bout! BooYah!
Covered short at 246.70, sold 245 strike puts for quick 20% pop.
Here comes the ramp into the close. You know what to do… 🙂
Until the DJI gap at 24,901.19 is firmly closed, I am selling the rips….big time!!!!
If the surrender the 24,700.00 shelf going into the close get ready for another round of mauling… 🙂
Looks to me like the banksters are in serious trouble…see ya tomorrow…GW… 🙂
https://invst.ly/7zg62
I know most people here are focused on the US markets, but here is something from Asia. China A Shares in real risk of breaking a support shelf. I was expecting wave B bounce from 2016 low to go higher, but it seems like Jan 2018 was it and now we can go a good distance lower. My own time line was for 2019, but it does feel like things are starting to unravel in 2018 itself. I will try to post the chart itself in case the link above does not work. I find that market to better represent Peter T’s theory that rally from 2008 is a B wave.
Very interesting chart. A looks like it could be a three but it cannot be a flat as B is too short.
Either way, China is toast. Xi, as China’s new “Supreme Leader For Life” simply cannot afford to loose face in this trade war, which means he has no choice but to blow up his already fragile economy. They can make all the announcements about deals with Germany that they want. They cannot survive a loss of access to US markets.
If I had any doubts that Merkel was trying to destroy Germany, no longer. She is a quantum physicist?! That has got to be total propaganda BS!!
Gaps down, long wicks, and momentum divergences at recent highs do not a bullish market make.
Reloading DIA 249 strike puts…0.72 per option contract….
Astro guys have been talking about July 13 for a while now. We could easily see a push above 2800 tomorrow as banks report earnings (which will be pretty good), and then an intraday reversal to close lower. I am still expecting a more meaningful high around 2830 sometime in early Aug to complete wave “B” for ES, ED for Nasdaq and a triangle “B” for Dow.
Ah yes! Friday the 13th!
And all that it implies.
The current move up looks corrective to me…a sucker’s rally…RUT seems once more to be leading the retreat…after a manner of speaking…
Stopped out of short from last week with 15 S&P loss while looking for Mars/Uranus turn at 7/13. Expected low, now thinking it must be a high. Today, close to hourly upside channel around 2830-40. Friday day order to short at 2830 limit or MOC. 30 point stop on close. looking for 100+ points. Good luck to all!
Another new moon, another high. The market did not disappoint in heading to a high on July 13. There is trend line resistance on various indices between here and 0.5 – 1.2% higher. I would like one more push higher later in the day to short ES and QQQ. In terms of levels, timing (from astro and calendar standpoint) and EW count, things seem to be lining up for a short trade (for a move greater than 8% lower). Its too difficult to pin point the last 1-2% and the final 2-4 weeks….My ideal level for SPX would have been 2840 around Aug 10 – but this is close enough for me to have some position on.
I am looking the SPX down to cycle low at 8/1. That’s to see how it goes.
G
Looks to me like the bears lost the battle around the DJI 25K and SPX 2800 pivots, with price now consolidating at those levels.
Shorting those indices with pivots intact on a close will probably be a loosing trade.
I am looking for a triple Q entry on steep divergent recent highs.
Stay tuned for “down.” Weekend report may be out relatively early this weekend.
Thanks Peter. I am staying away from SPX and DJI for the time being.
I went short on QQQ on confirmed bearish momentum crosses today.
Margin debt now at record levels. It will all end badly, as all bubbles do….
A new weekend blog post is live at: https://worldcyclesinstitute.com/ending-diagonals-cap-the-market/
This website is for educational purposes relating to Elliott Wave, natural cycles, and the Quantum Revolution (Great Awakening). I welcome questions or comments about any of these subjects. Due to a heavy schedule, I may not have the time to answer questions that relate to my area of expertise.
I reserve the right to remove any comment that is deemed negative, is unhelpful, or off-topic. Such comments may be removed.
Want to comment? You need to be logged in to comment. You can register here.