
Update: Wednesday, Dec 9, 3:30PM EST
Bottom line: We’re in the final pattern of this very large corrective flat that started on Aug 24. It’s a fourth wave triangle and today marked the bottom of the C wave. We have two more legs of the triangle left and then the final wave up to complete the much larger C wave. I have no doubt that finishing this pattern will take us right up to FED announcement on Dec 16. Expect firework then!
Here are a couple of charts to update the progress of the triangle.
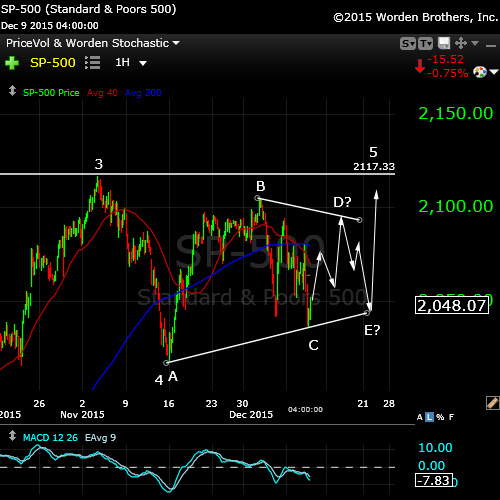
The 1 hour chart of SP500 above for today shows the triangle continuing to define its boundaries. We should head up tomorrow in wave D. The EUR/USD is running counter, so as it tops at approximately 1.09, the equities should head up in earnest. I expect the euro to top tonight.
I’ve drawn in the expected path. Wave C in a triangle is almost always the most complex path of the lot. We’ve seen that this is true in the case of this triangle.
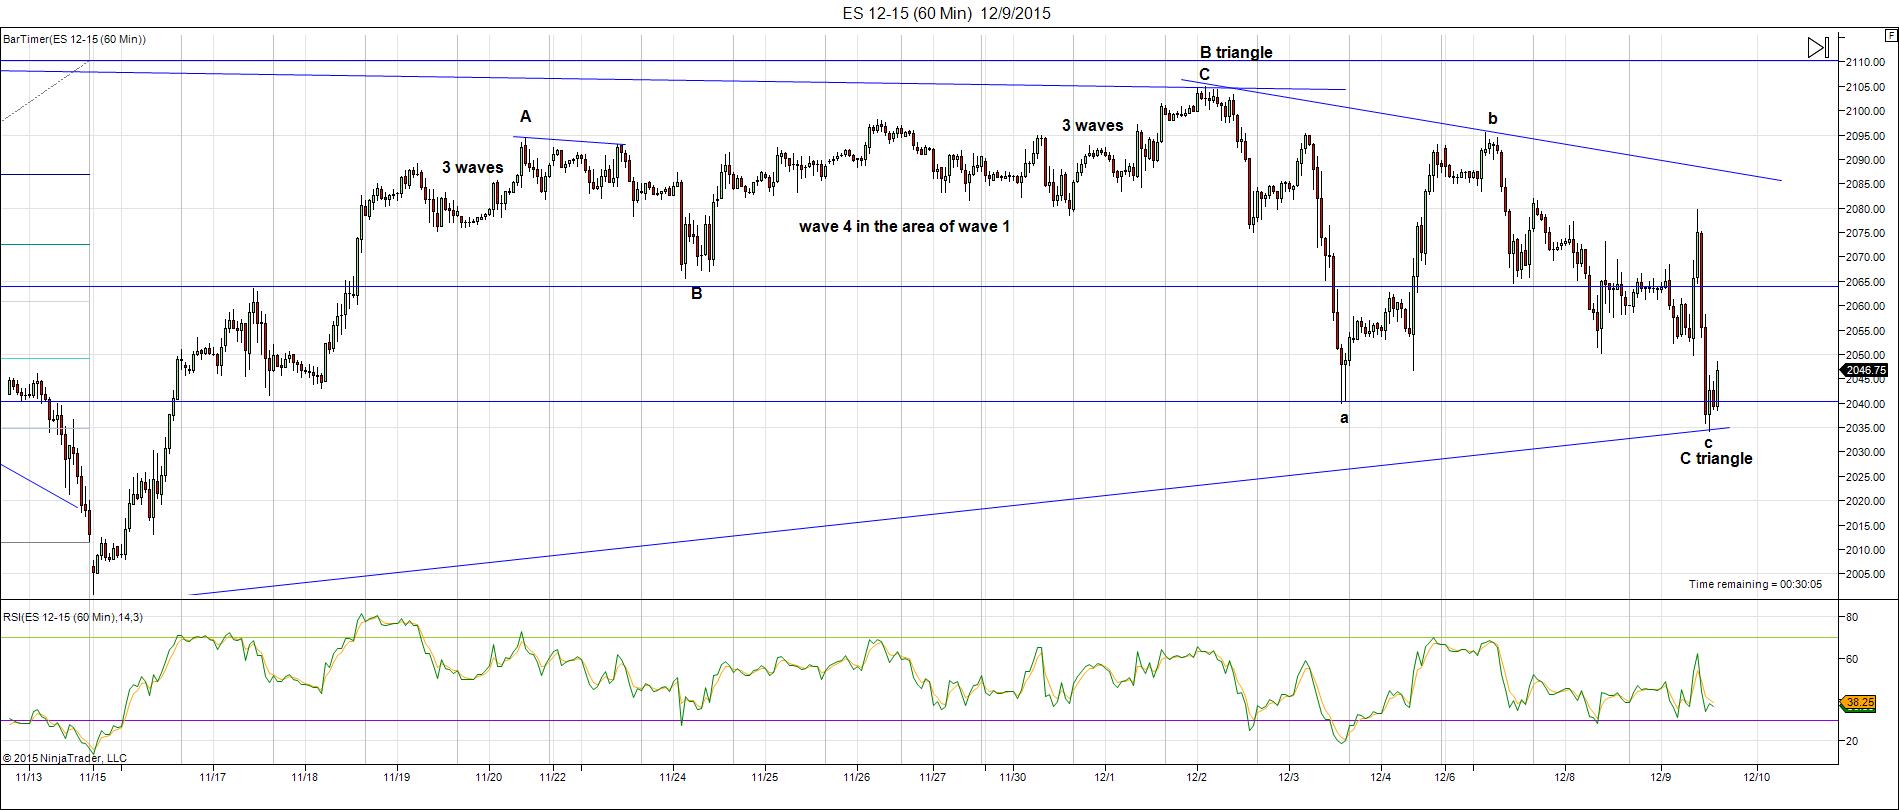
ES (e-mini futures) 60 min chart also shows the very large triangle. We’re currently at the bottom of the C wave. We should head up tomorrow in the D wave.
___________________________
Original Post Starts Here
The US Equities markets are running on empty. It’s only a short matter of time (days now) before they roll over for good. There are only about ten big cap stocks that are fueling what’s left of this rally.
And while I’d like nothing more than to see us head down, the wave structure in equities tells me we’re not quite there yet.
We are now seven market days away from the next FED announcement and it doesn’t take much imagination to envisage the market staying afloat until that announcement.
Almost all the US currency pairs have now turned up, dollar down. This is going to put a lot of pressure on equities to drop. Gold is also showing signs of life. It’s finished an ending diagonal and GLD, for example, looks to have completed one small wave of 5 up, and is working on the second wave.
Both of the above examples I’ll provide below.
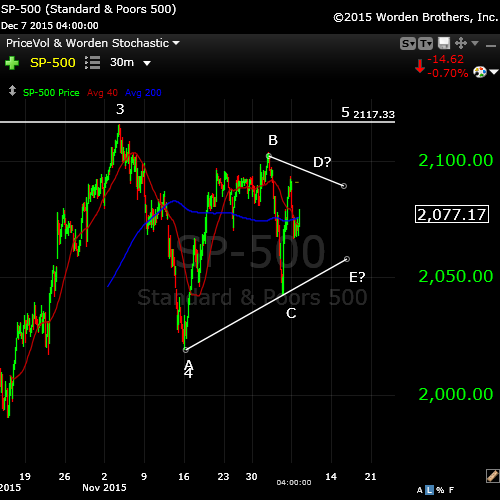
Here’s a look at the SP500 (30 minute chart) as at Dec 7 after the bell. You can see it’s tracing out a large fourth wave triangle. However, the D wave has not met the trendline and it should. So there’s some uncertainty at the moment as to the next short term move.
All the waves so far are in 3 and the remaining waves should be also. The final wave up (wave 5)will likely just test the previous high. It could go higher, but with the underlying weakness, my sense is that this market is dying very quickly.
A triangle in a fourth wave signals that there is one more wave to finish up this larger C wave.
The alternative. For all the skeptics out there that think we’ve somehow topped, there is one alternative. We may have truncated. There are two instances since 1932 that we know of at major degree (which this is):
- October, 1962 at the time of the Cuban Missile Crisis
- End of the year, 1976, after a large wave 3.
Typically, a truncation happens after a very strong third wave, which we have. However, I’ve never seen a truncation—that’s in ten years. They’re extremely rare, which doesn’t mean they can’t happen. But EW is all about probabilities.
Other than that, we had a wave up in 3 waves, which is not an ending wave. We’ve also have a wave down in 3 from November 4, which much retrace in its entirety. Those are Elliott Wave rules.
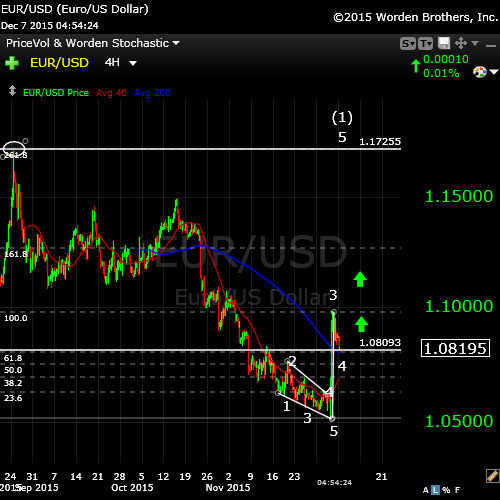
EUR/USD
With Draghi’s announcement of more easing, the currencies seem to have changed direction. The eur.usd have completed five waves up and should now come down 62% to complete a second wave and then head back up again.
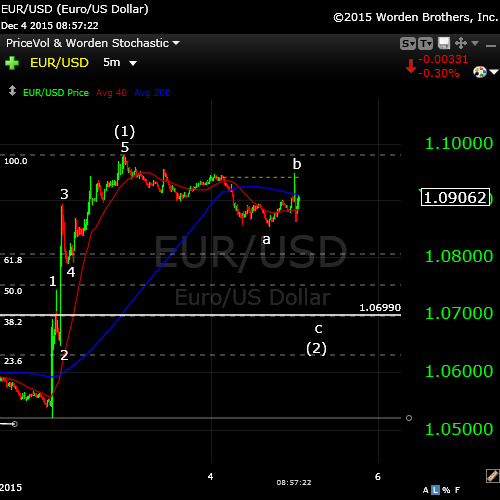
Above, a 5 minute chart of the eurodollar. You can’t quite see the ending diagonal complete at the bottom of the chart, but you can see the five motive waves up to complete the first wave up. It may back off 62% in a second wave before taking off again in a third wave. The horizontal line marks the 62% retracement level (the reciprocal of 38%).
Alternative: I am also reminded that this is a first wave (in 5) and as a first wave, it may only retrace to the previous 4th before launching a 5th wave up, which would likely take it up to 1.172 before doing a 62% retrace (SHOWN BELOW). Be on the lookout for a breakout up this morning.
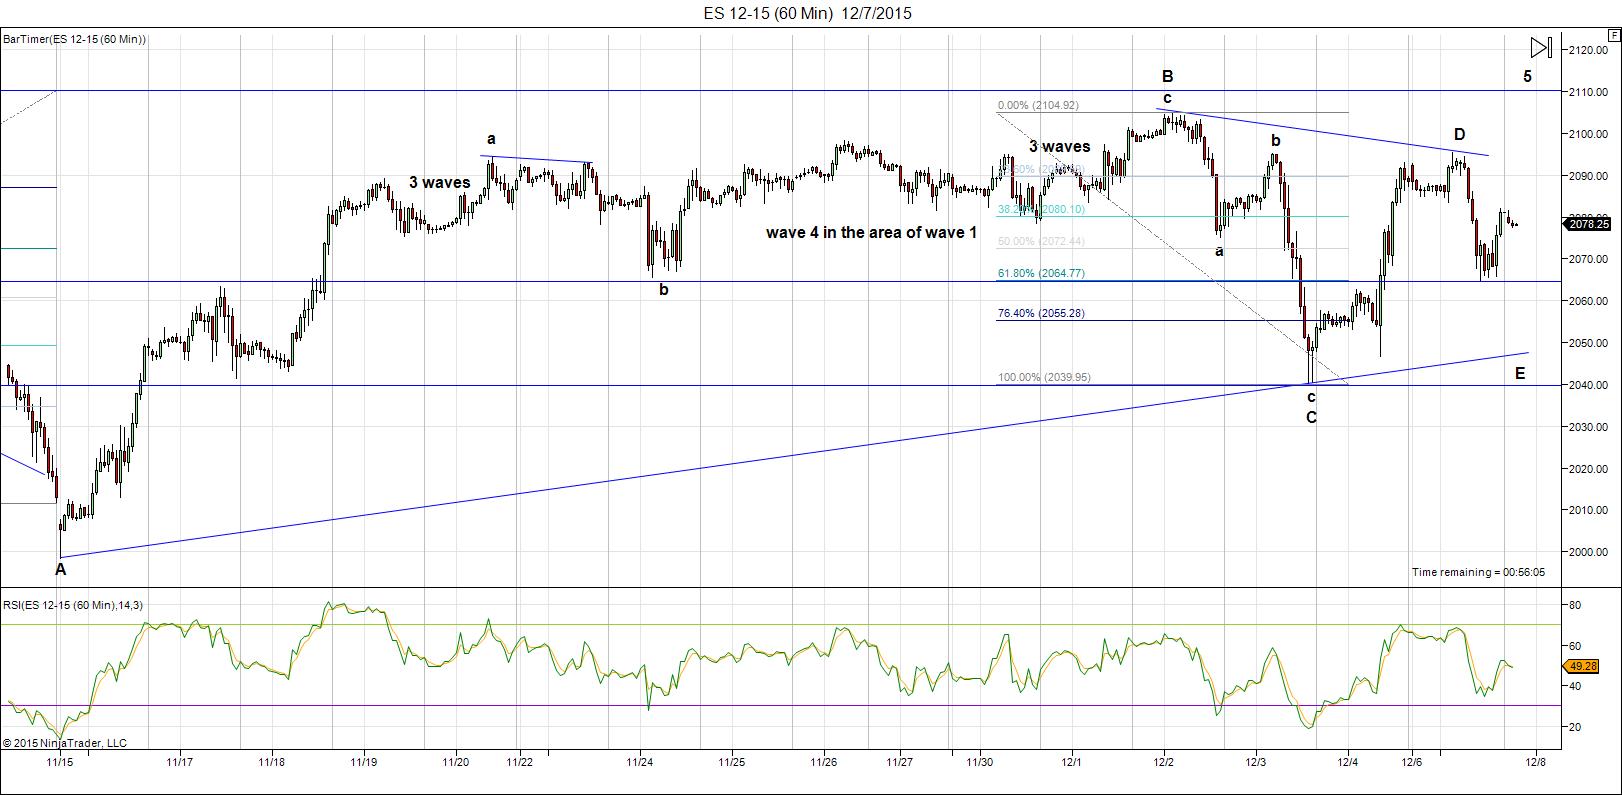
Above is the count on ES (60 minute chart) as of tonight (Dec 7). The configuration is a little different here than the cash indices, although we seem to both be in some stage of completing a D wave of a triangle. They appear slightly out of sync, so they will need to resolve that problem over the next day or so.
You can see on the above chart the issues with the 3 wave configurations. I pointed out the first one several days ago (the one to the left of the A wave). We need to test the previous high in an eventual 5th wave.
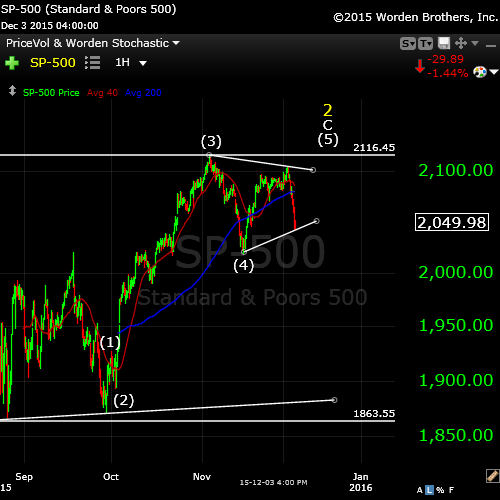
Above is a “wider shot” of the SP500 (one hour chart) showing the larger pattern. I would expect to see this potential 4th wave triangle finish up at a the previous high of 2116.48.
Gold
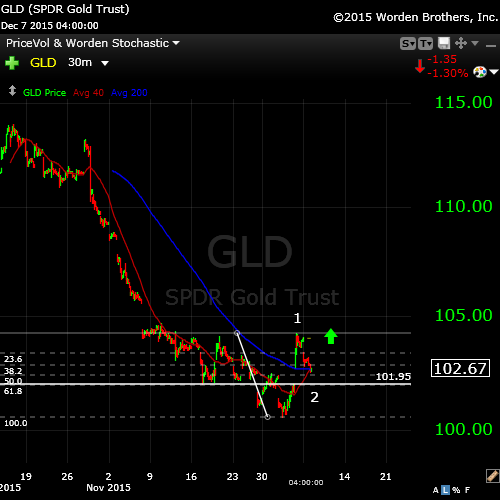
Gold (GLD) has a similar pattern to this ETF. It’s sporting an ending diagonal within a larger ending diagonal. We had a rather large jump over night. This wave up so far looks motive. We’re expecting a large rise from gold as the equities head down.
Here’s the US dollar:
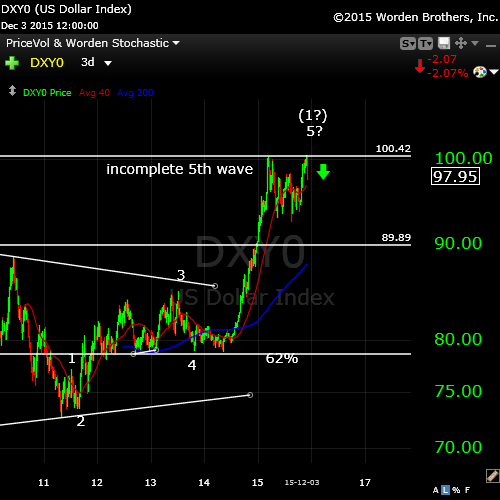
The US dollar chart (3 day chart) above is the interesting chart to me of any of them here. The fifth wave is not complete. I actually didn’t expect the dollar to reach a new high, but it did. So, while I have left the motive count on the chart, it’s a 3 wave configuration at the moment, which would mean the dollar would be expected to retrace right to the bottom.
Either the dollar heads back up to complete the 5th wave (the fourth wave also did not retrace a sufficient amount) or we should have a large retrace ahead of us. One to watch.
And finally, here’s a really super set-up, the British pound/dollar.
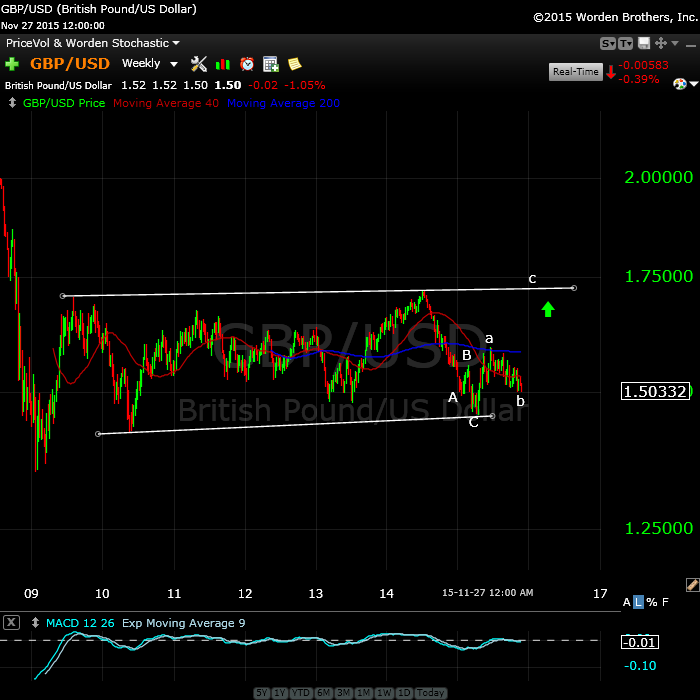
If you like trading currencies, here’s a no brainer. The GBP/USD weekly chart shows a large 4th wave triangle. We have a C wave left to go on the last leg of the triangle (the e leg) and then we should turn down into a fifth wave. I’ve been watching this one off and on for quite a while.
____________________________
The Question of Seasonal Bias
The Decennial Cycle (chart below) that’s tossed around without a lot of thought is not a “cycle” in the true sense of the word. It a short-term phenomenon, or pattern, perhaps. It’s interesting that most charts only go back a few decades to make the case for a continuing pattern.
The chart above goes right back to 1805 so you can see the issue I have with this phenomenon being anything other than a short-term pattern. 2005, in fact was ‘flat’ or negative, depending on who you listen to. So far this year, the NYSE is down one percent. I find the reference to the “decennial cycle” lacking in any kind of credibility.
You’ll find the article to this chart here.
In terms of seasonal bias, Santa Claus and end of year seasonal rallies show even a spottier performance. On the other hand, as a contrarian, I would much rather see rabid optimism in the market, as we have now. In my way of thinking, it sets up the perfect scenario.
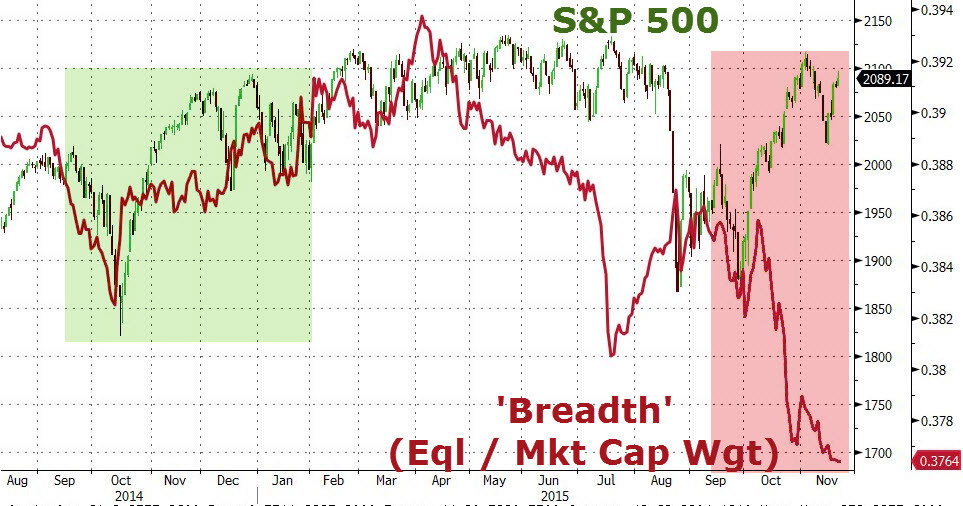
Above you’ll find a snapshot of market breadth, which continues to implode. This is from a zerohedge blog post.
Now on to cycles:
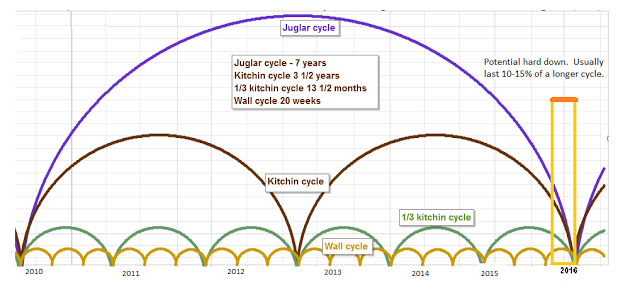
Here’s a chart of the Juglar, Kitchin, and Wall cycles which are harmonic. They’re forecasting a turn near the end of 2015 or very early 2016. More specifically, they point to the January/February time period as a bottom.
You can find this chart and a full explanation at http://swingcycles.blogspot.ca.
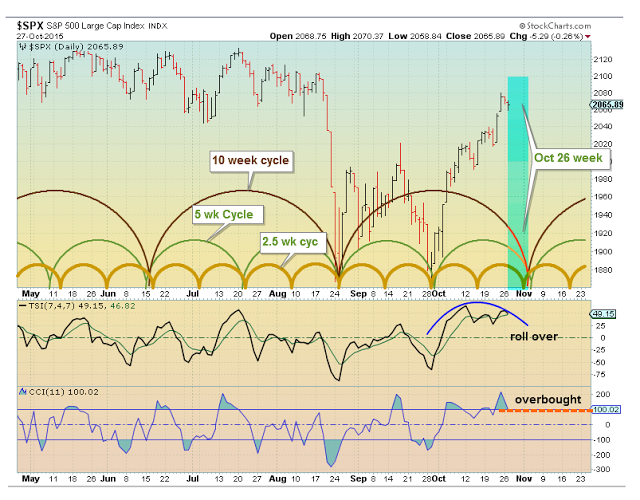
This is a similar chart of the recent past. You’ll see the end October/beginning of November forecasting a major top. In fact, we topped in wave 3 of C on November 4—a direct hit.
Andy Pancholi’s “Market Timing Report” forecasts November 23 as the major turn point for the month. I highly recommend it for its accuracy. You can find it here.
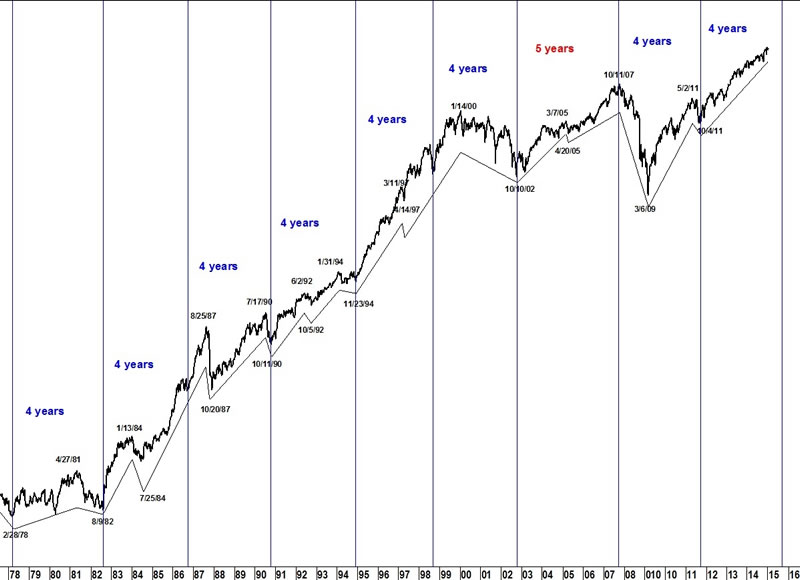
On a longer-term basis, here’s a look (above) at the 4 year cycle on the DOW. This cycles forecast looks to the end of 2015 for the turn. You can see how long-term and persistent this cycle is.
I was asked this week about the broadening market topping pattern (well-known market topping pattern—not Elliott Wave related), so decided to include it here.
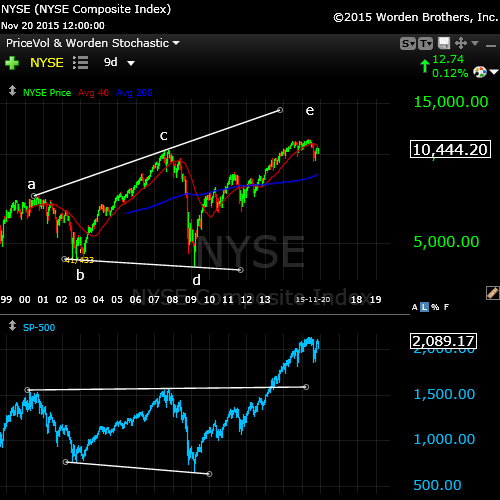
Above is the larger broadening top of the NYSE in a 9 day chart going back to 1999. This would be called an “ending expanding diagonal” in EW terms. It’s an extremely bearish pattern and seem to be failing in the final stages.
It’s interesting to me to note the difference in the NYSE as opposed to the SPX (lower blue chart). It speaks to the breadth of the market. It tells me the buying is concentrated in the big cap stocks.
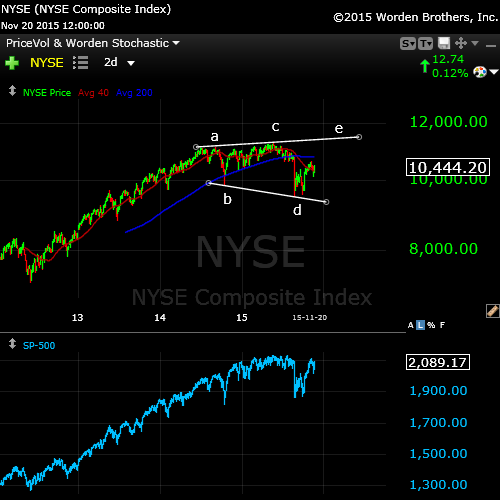
Above, we can see this same pattern on a short term scale in the final wave of the larger topping pattern. We have what appears to be a failing e wave in the NYSE 2 day chart.
There’s also a non-confirmation here, as well. with the SPX chart. This suggests the rally is narrow on even a short term-basis, with most of the buying in the big cap stocks.
DOW Theory (Transports and Industrials Non-Confirmation)
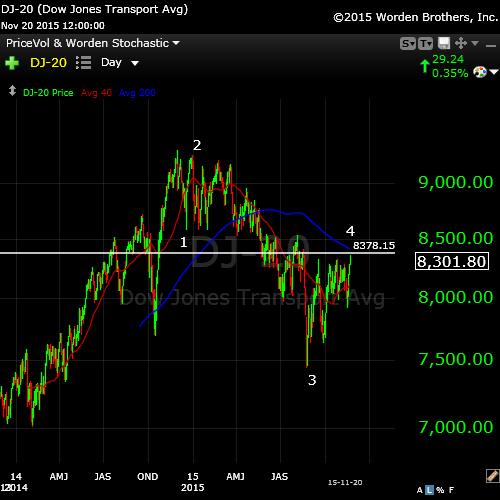
I haven’t brought up the Dow Transports non- confirmation for a while, but it’s been busy at work setting up for the next drop. The Transports Index (DJ-20) is tracing out a typical fourth wave (above), with the Industrial Index finishing off the 2nd wave (below). Both are setting up for a turn down in tandem. You can find background on the DOW Theory here.
For more confirmation, you can visit this article on the Baltic Dry Freight Index. Scary stuff!
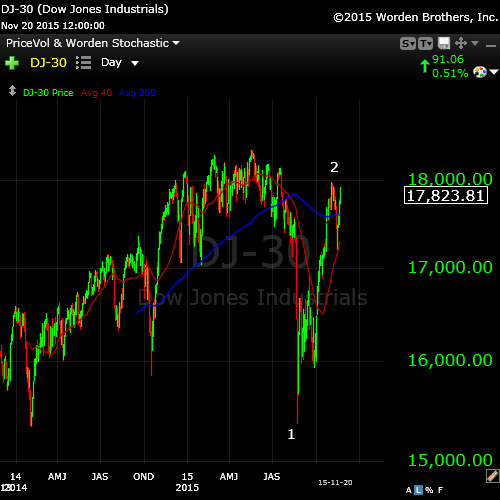
Above is the daily chart of the DOW, showing us at the top of wave 2.
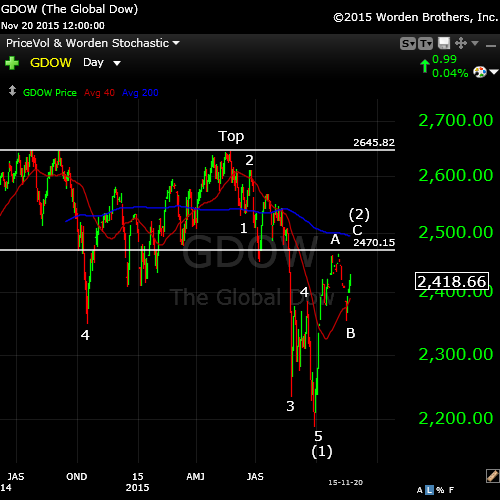
Next to last, here’s a daily chart of the Global DOW. Not much has changed here lately.
The Global DOW is like the elephant in the room, letting you know what’s happening on an internationalk basis. We’ve completed one set of motive waves down from mid 2014 and have retraced exactly 62% in a second wave, where we sit now. Actually, we’re completing a fifth wave up in this second wave rally, which should top at the same time as the US equities roll over. The writing is on the wall!


This is a re-post from the previous thread! Because gold has continued to spike from + $16 to + $24 in a few minutes, I wanted to be sure you all got to see this. It really does seem to be unfolding as expected.
#
This is an update to a similar post I made a few weeks ago.
At about the 13:00 mark in the video below, he mentions a “currency event”.
That event may have triggered yesterday.
The overall analysis based on cycles is unfolding as he describes.
https://www.youtube.com/watch?v=B5e56ISoJ7g
Gary G.
Well, US stocks are running alone.
Bonds are not buying. Europe is sold.
🙂 We wait. Equities should finish this pattern, top, and be done. Currencies will head into wave 3 at the same time as the top.
hi Peter
It looks like Wave A of d is for the most part complete yet the market may hold up into the close. key resistance for the cash dow 17999-17814.
this should become a 3 wave move to either 1 complete d as you posted above
or this will be a 3 wave rally up towards 18159 .
this A wave under the alternate scenerio would be labeled 1 of 3 of 5 .
1 2 3 into nov 3 wave 4 nov 13 -16th . wave 1 of 5 nov 16 to nov 20
2 nov 20 to dec 3 .
this would be labeled from the augs low as
a b c 1 2 a b c 3( nov 3) 4 nov 16 low and a b into yesterday .
this being the final C wave .
a b c x a b c .
Bottom line : to me this will become a case of selling the top of a 3rd wave
and expecting a 5th wave failure ( its all 3’s )
Joe
Back to fully hedged here, after letting go of my shorts yesterday. If you like swing trading, this is the perfect market for the next 2 weeks. Good luck to all.
Peter
im beginning to see more dec 9th time clusters showing up .
this dove tails with the dec 11 mars Uranus opposition date which is typical of a top .
The problem im having with the triangle is it is so very obvious and the market hardly
ever give the masses the obvious move with out throwing in a fake out somewhere .
im back to the a b c 1 2 a b c 3 4 a b yesterday and we are now into wave 5
which should be an a b c move . A completed now or shortly then B which is very short
live followed by C up to complete 5 3 wave moves up from the august lows .
a poke above 18137 satisfies my count and from there the decline to be textbook
calls for a drop from just above 18137 to just below 15942 . this would be a much larger
triangle in development . that said regardless of the wave count , i have 3 patterns
topping and all 3 point lower in what should become the strongest decline phase since this rally began on aug 24 . how far down is speculative yet the bullish triangle count
calling for a move below 15942 is still a very large drop .
short term i am suspect of this as wave D even though it is obvious
Joe
I appreciate all the updates. This is a momentous time in history.
Thks. And you’re certainly right about that. Problem is, not enough of us know it.
Peet!
If all would know it, we would not make money with our puts right???
Cheers,
W
Peter–Every time we get one of these short covering ramps….I wonder…is this the time we finally trap the longs with lock limit down? A great market analyst I knew, Ray DeVoe, used to say “if you treat a stock market like a commodity market….eventually it will behave like a commodity market.” The players are trading commodities at this point….problem is they don’t know it and therefore the logical conclusion….lock limit…. is not in their frame of reference. This is probably the most “thoughtful” mania in history. Gary (Denver)
Well, I’m a little nervous about this wave up, as is Joe. It’s more motive than I would have expected.
Currencies still have a corrective 2nd wave to do, which would suggest more upside for equities, but that may happen over the weekend. Just need a little more info from this market to figure out the next short-term move.
Peter—We should all be very nervous. We have been in an enormous B Wave since the March 2009 lows, central banker’s attempt to save the world, that’s what the behavior of the market suggests. Yesterdays action by Draghi was the pinnacle of B Wave behavior, if you think something is wrong it probably is. He tells everyone the EURO must go lower and we are going to help and what the hell they buy the EURO. As the general said in WWII when asked to surrender…..NUTS!!!!! Gary (Denver)
Well, I already knew where the euro was going, as I’ve been saying. Bankers have no power anymore. And politicians are clueless.
Equities and the dollar are heading down … the timing is the issue … just in the short term.
Nervous about where the world is going longer term … that’s a given.
Peter—Yes you did get it right on the EURO, but the damage done to those short the EURO and long the Dollar is very hard to assess. Volatility KILLS when it comes to hedging strategies and the like. Every time the central bankers, who always know better, manipulate markets the structure grows weaker….they are destroying confidence in trading free markets. Eventually this will lead to a forced selling episode. Gary (Denver)
Good call. You hit the bottom of this C wave just right ..Nick
Thanks, Nick. Bit of a no-brainer, actually. We went up in three waves and we came down in three right off the top, so I knew we weren’t going far. It was just a case of figuring out wave length. The highest probability count is to finish off the triangle in the equities.
Peter–IMO this is a must read. Gary (Denver)
http://creditbubblebulletin.blogspot.com/
As with climate, a fool’s errand.
Here’s a blog post from a lady I like reading. This is big picture astrology (warning!- haha) but I think gives a great picture of December. I see this all around me. http://vivacombusta.com/2015/12/04/cage-rattling-and-nerve-snapping-at-the-uranus-pluto-square-finale/
http://www.zerohedge.com/news/2015-12-04/correlation-may-not-equal-causation-divergence-looks-bad-news
Thanks André,
As I’ve been saying ad nauseam, we are experiencing a huge trend change in US currency pairs. The euro has established a new trend up (in 5 waves). The EW entry is on the completion of the second wave down (I’m short) which should end about 1.07 and then we’ll get a third wave up to 1.145. I will post these charts somewhere as it’s an excellent real world example of what to expect at the end of an ending diagonal—a dramatic move to at least the beginning of the pattern, which is exactly what we got.
Credit is drying up dramatically.
US equities are next—the last hold-out. 🙂
On marketviews.tv Stan Harley said that there are 5 major averages. The trannies and the ny composite are diverging and will not go to new highs. Historically, one average, likely nasdaq, goes to a new high about 150 trading days from the a/d top. That 150 days is about dec 22. Then the bull should be over.
Yes, I expect the Nasdaq (comp) to top either at a new high or test the previous. NDX is already at a new high. NQ has been in the clear for a while, and the Nasdaq indices are not aligned with the other US indices (in terms of ending patterns). It’s (comp) not tracing out a triangle, but rather looks like it did a first wave up to 5176 and change, then second wave down, and is in a third wave up (all of a final fifth).
Friday’s run was a bull trap; it was panick. Apogee 12/5 triggered this.
Mars will be opposite the April blood moon eclipse-point 12/6 and Mars will form a cardinal T-square with the Uranus-Pluto square next week. This will increase volatility.
So now down into 12/16-18 time frame.
For the longer term you know my mantra.
Cheers,
André
André!
Help me out here please… My system gives turns on: 9, 18 & 28 dec. I do not see 9 in your writing? The other two are matching. 🙂
Cheers,
W
Whazzup,
12/9 shows a tidal extreme, so something will happen there. Just think this will be a little retrace in the downtrend. 12/10 can also bring a change. So 7 high, 9 low,10 high and down again.
At least that’s what MY systems gives.
André!
Thanks mate!
Last question for now: what website is best in your opinion, to use for tidal information? I had one once, but lost it and not tracking the data now anymore…
Cheers,
W
http://tides.mobilegeographics.com/locations/4104.html
Thanks A!
New question arises: it is on Quebec now, I live in Holland so do the settings for the tides matter a lot or keep it like this?
Cheers,
W
P.s. After the 16-18 low I expect a retrace into Christmas. This confirms Roger’s timing. It’s just that I don’t think it will create a new high. But that date/timeframe will be tested.
André
Peter,
About the Euro. W2 can retrace deeply, but it doesn’t have to. My assement of the current situation is that the trend is very strong. So maybe the deeper retrace will have to wait until W4.
Whazzup,
You are free to pick your own station. Neuville works great for me. Remember, there is only one moon.
Haha, best answer ever. Only 1 moon. >< Okay, I will just keep the settings like this haha.
Cheers,
W
I’ve added a note this morning regarding the correlation of the eur/usd with equities and futures. I have also added an alternative chart for the eur/usd and added some charts to the page on ending diagonals (a link is in the post in the eur/usd explanation).
Peter,
Took a look at the article on the drought clock. I would like to add the heliocentric Saturn-Pluto cycle. This cycle made a conjunction in 1982, the bearmarket low. And the midpoint – 2001- coincides nicely with the clock. Next conjunction 2020. This would suggest one wave down into 2018 and a last 5 of 5 up into 2020. Then this Saturn-Pluto truns with Wheelers 100/170 year cycles.
Makes me think the real misery will come after 2020.
Just a thought.
André
Cool … thanks.
Peter,
it seems that ES has turned down without touching the upper limit of your triangle.
Is it already in the E wave and what is its target?
I show it has having reached the top. Target is the bottom triangle trendline, somewhere just under 2080 ES. Euro isn’t going to do what I thought it might, so it may just sit where it is until the triangle is over.
Peter, ES 2080 ?
It is already ten points lower
It might get under 2050. Hard to say.
Oh, sorry. One of my computers crashed. 2060. So we might even start back up today. We’ll have to see how this thing plays out.
I put ES in the C wave at the moment.
Peter-
Could you elaborate a little on this. I understand that the bottom of wave C of this flat was on Thursday. Are you suggesting this is Wave C of the larger Wave D or Wave E?
Ted,
We’re still defining the triangle. Where we ended today, we could go up or down. I was referring to wave C of the triangle in ES. Been out all day so I haven’t had a chance to dig any deeper.
I was commenting on ES, which is not necessarily in the same position as SPX. SPX possibly finished the C wave as you say. In SPX, what would have been the D wave did not rise to the trendline, so at the moment, we’re not following through. In other words, there’s not enough info to say for sure where we are.
This leads me to believe we might wander around until the Fed announcement on the 16th. We appear to be in a triangle. Until it properly defines the top and bottom trendlines, it’s unclear of the short term path.
The Nasdaq appears to be on a different path, so as is typical of a market top, indices are in a bit of disarray.
The shorts I bought Friday, Have just sold them. Back to fully long. Good luck every one.
$SPX now 23 days without back-to-back up days. One of longest streaks in history. $SPY
Hi Dave,
thank you for your gentile indication when your a long or short. Could you also give us your decision making process based on what filters or indicators you are taking your bets ?
Very much appreciate. Happy to learn everyday.
Best, Jaze
I updated ES and SPX charts tonight to better show the latest moves.
Hi Peter
Just a comment
Hot Rolled Steel HRC #F ( futures continuous chart )
Benner business cycle was calling for a low in 2011 and it was initially configure
for pig iron prices , the dow bottomed on time yet hot rolled steel peaked
march 2011 hot rolled steel 8800 , fell for 19 months into oct 2012 to 5900
it then went sideways for 19 months into may 2014 at a peak of 6850
it has now been falling for 19 months and is below the june 2009 lows
it is sitting at 3660 .a 59.31 percent drop over the past 57 months .
in a perfect world 19 months in wave a 19 months in wave b
and now 19 months in what looks like a c wave id say something is about
to change come January . ( this is a monthly chart )
SOX daily chart looking like 5 waves up from the august lows.
Crude oil continuous futures contract .
July 2008 to dec 2008 ( actual print low jan 2009 )
drop 77.45 %
dec 2008 plus 28 months peak at 106.62 april 2011
another peak 28 months later august 2013 .
the drop from august 2013 looks to have already completed
5 waves down in august 2015 so what ever is going on now
is probably noise of some sort .
Wave A was 77.45 % down
Wave C will equal A in the price range of 25.31-24.04
gold silver ration still not satisfied
xau still not satisfied .
Us dollar looks to be peaking yet indicators not yet rolling over
XOM completed a long term bear move in august
support in the range of 74.57-71.44 ( 92.97 C equals A short term )
DIOD, Massive 7 year triangle formation has been completed ( monthly chart )
Dow Weekly
the week of aug 24 was a high ,from the weekly closing high the dow went sideways
for 5 weeks ( bottoming on the 5th week ) it then peaked 5 weeks later into the week
of nov 2 , this week is 5 weeks from nov 2 .
dow daily , from the high on aug 28 to the low sept 29 the went sideways to down
for 21 trading days
from the high on nov 3 to the low dec 3 the dow went sideways to down
for 21 trading days ( i commented before about the comparison with the minor drops )
from the low on aug 24 to the low on sept 29 the dow had a bottom to bottom
count of 25 trading days , adding 25 trading days to sept 29 was the nov 3 high
adding 25 trading days to the nov 3 high is dec 9 .
the print low on aug 24 to the print high on sept 17 was 17 trading days .
the closing low on nov 13 plus 17 trading days is dec 9
dow hourly
the peak nov 3 to low nov 16 was 67 trading hours ( A )
the low nov 16 to the high nov 20 was 33 trading hours ( almost exact !/2 time )wave ( B )
wave C may or may not be complete yet here we go .
the drop from nov 20 to dec 3 was 67 hours , wave C equal wave A in terms of time
and Wave C ( if complete ) was almost exactly .618 of wave A .
Dow 5 minute chart .
there are no valid time counts i see intra day beginning dec 3 .
from the peak dec 4 to the low at 0745 ( 5 minute bars ) the dow fell
for 31 5 minute bars , the dow then bounced for 31 5 minute bars
making a minor high and then chopped sideways for an additional
31 5 minute bars into 1255 ( just before the close )
For tomorrow , if the dow is near 17541 around 135 minutes following the open
we would have a very minor price time match to consider a low ( if its a low )
this places 0905 pdt as a very short term timeline yet given the pattern
it may be worth the trade if it plays out .
the drop from dec 2 at 17901.58 to the dec 3 low at 17425.56 was 476.02 points
from nov 20 at 17914.34 to dec 3 at17425.56 was 488.78 points.
if wave E equals .618 of the move from B to C then the dow would drop
from its dec 4 17866.44 high about 294.18 to 302 points .
17866.47 minus 294-302 = 17572.29 to 17564.47 which is just a bit above
the 17541 C = A target . yet all of it summed up .
0905 ill watch the cash dow in the range of 17572-17541 ( 29 point range )
17525.81 being a key support .
target 17814 initially .
Joe
Hi peter
One last point on timing which is a bit mind blowing for me at the moment .
aug 28 high to nov 3 high 46 trading days .
adding 46 trading days to the sept 29 low was dec 3 low .
from the closing high sept 16 or the print high sept 17 to the nov 3 high was 34 and 33 trading days .
adding 34 trading days from the sept 28 low or 33 trading days from the sept 29 low
targeted the nov 13 closing low .
taking this out one degree further .
aug 24 th low to the nov 3 top was 46 trading days .
adding 46 trading days to the sept 29 low is dec 9 again .
this is the strangest cluster of time i have seen in a very long time where
all the swings are some how connected uniformly with time .
im getting carried away but here is some more
oct 22 low to the nov 16 low was 17 trading days adding 17 trade days to nov 16
is dec 10th , ( 34 trade days total is fibonacci )
the high on nov 3 plus 13 trade days is the high on nov 20 adding 13 trade days
is dec 10 ( 13 fib * 2 )
low to low to ( dec 10 ) and high to high to ( dec 10 )
what ever it is this is a very key time frame .
humor
aug 24 plus 76 is dec 10 , 7+6= 13 and 1+3= 4 🙂
Joe
Joe,
Really awesome posts, thanks man!
Will print this one and look for some of these connections myself. 🙂
Cheers,
W
We should be getting ready for a rally to a new high.
Hi Peter
Please what do you mean to a NEW HIGH ?? Do you mean above May 20th High ??
Regards
AZ
I mean 2116 and change in the SPX. Beyond that, we’ll have to see. But I’m only expecting that level.
This is a fifth wave so technically it has to go at least a tick above the previous wave 3 high.
Thank You
They are crazy these dip buyers.
SPX takes 1% up on the FANG back.
Netflix spikes 5% in one hour
Dmitri,
Further to your FANG comment: http://www.zerohedge.com/news/2015-12-08/going-fang-less
It’s just amazing how with a few popular stocks one can influence all the markets
Hi peter
Final thought on time .
in addition to what i posted above .
If we rally from todays lows this may not be a triangle even though it appears to be one .
the difference ? for another day .
Dec 15 2015 is 5 trading days from today .
dec 15 is 3 trading days from dec 10 ( i already touched on dec 10 before )
dec 15 is 8 trading days from the dec 3 closing low
dec 15 is 21 trading days from the nov 13 closing low
dec 15 is 55 trading days from the minor closing low on oct 27
dec 15 is 89 trading days from aug 10 swing high just before the crash
dec 15 is 144 trading days from may 21 ( where this market rolled over )
from the closing low on nov 13 the dow rallied for 5 trading days .
if the dow rallied 8 trading days from the dec 3 low that would imply
a possible wave C in terms of time .
C equals 1.618 times A
if C equals price that would imply a price target of 18129.47.
as a speculative thought to all this speculation on timing
options and futures expiry and the fed ( what ever they decide )
the market will peak and roll over .
maybe some index makes a new high yet for my work the Dow
should Fail and not make a new high .
I can make the screaming bull case but i just dont see it at this juncture .
if we break out to new highs were looking at 19000 – 23000 dow into as late
as august 4th 2016
the next few days will be important .
No NEW HIGHS PLEASE
Joe
What’s up with the $? My guess is the FED and the rest of the world wants it as low as possible before the fed announcement. Normally, it would be strong into the announcement, then sell on the news. Similar to Dragis news announcement. The mkt moved opposite conventional wisdom. The 9 trillion $ carry trade is still there.
Peter–The pressure is mounting, massive layoffs, dividend eliminations, credit spreads widening, someone or several someones are headed for the tank. Warning signs are flashing from every direction. Gary (Denver)
http://www.zerohedge.com/news/2015-12-09/glencore-cds-are-soaring-again-default-risk-rises-above-50
Yeah, but even up here in Calgary, where we were hit extremely hard in the summer, nobody “gets” that there might be a problem. Some do (our suicide rate is up 30% in the past few months, apparently), but the vast majority don’t notice anything particularly odd.
It’s as amazing as this market.
Peter–Yesterday the dollar is up….market down…today the dollar is down…market up??
It seems that the players HFT/Quants are just playing…as usual. Fundamentals do not appear to matter until we get a unexpected fracture…..then they will matter. Gary (Denver)
All the markets just jump strongly up and down.
Looks like shakes the markets trying to squeeze the bulls and the bears
In EW, that’s called a third wave and the second of the third. I’ve caught both so far … after a 62% retrace, we should head back up into the middle of the third. That’s in ES, whicnh is what I think you’re likely watching.
Well, I just see the US markets have lost any correlation with currencies and commodities last days.
They try to maintain the stocks and to dump the gold doesn’t matter what happens to USD or commodities.
I prefer not to play these spikes now. They are violant but unpredictable.
The market struggles. It may break down at any moment.
Europe has already lost 6% since last Thursday. So, I stay with my CAC Shorts.
Gold diverge much with gold miners which are 25% higher than month ago when gold was at the same level. It seems that those buying them don’t see the gold to go much lower.
Well then, you certainly haven’t bought into Elliott Wave …
Peter,
no, I really appreciate very much and like to follow your analysis.
But I prefer to take some longer-term positions when the count is not clear or is a real mess like now and to play shorter waves when the count becomes clearer
Well, I’m with you on that. This is extremely dangerous to daytrade in. You’re actually better to only take bear trades. My point was this morning was a good setup (for what it was! – or ended up being … 🙂 ) It turned over predictably. However, to your point, you were correct that from there, it didn’t do as expected. But then we’re in a triangle and it can go wherever it wants, cause triangle waves are all threes. Better to wait until it breaks up or down.
Everything down is in 3’s so far, so it can’t break down unless it truncates and the probability of that happening is extremely low. So, ES somehow has to get to 2110. How it does it is likely to be very painful. I think it will last until the 16th no matter what.
I rarely day trade and in fact, am sticking with currencies at the moment when I do, as they’re a bit more predictable.
So you’re certainly bang on in your assessment: Dangerous and tough to figure out the short term movements.
Now, NYSE just broke the previous 4th wave, and it’s dropped to 50% retrace from the previous low (but I think it will turn here). It bears watching. These tops are always scary as hell.
Peter–Your comment “nobody gets that there may be a problem”. All I can say is WOW, are folks really that insulated from reality? One thing I have noticed is that there seems to be an I’m hedged mentality these days. I hope these folks are aware of the fact that you can only hedge specific risk….not systemic risk. Can you imagine a life insurance company where all of their policy holders died on the same day? If we get a severe market dislocation hedging will be problematic at best….the dangers of derivatives is not a measurable risk. Liquidity will become illusive at best. Gary (Denver)
I’m with ya, but that seems to be reality.
Hi Peter
If the low of Dec 3rd was broken before the price reach 2117 , does this mean Wave 2 in completed , and we started Wave 3 ?
Regards
AZ
You’re going to have to tell me what you’re looking at … I will guess by the number that it’s SP500 …
In that case, the important break is at Nov 16, which is the fourth wave. If we break that, it’s a truncation, cause we only have 3 waves down and quite a mess to clean up.
Right now we’re still in a triangle in cash and the D wave may not be complete. I caught what I thought was the third wave this morning and then the second wave, but if the D wave is not complete, then we may have to complete it first. (so that means this morning was just an abc wave – I got lucky). The C wave hasn’t reached the upper trendline in SP500, or anything else, for that matter, I don’t think. So we have to wait to see if the next wave up breaks the triangle or we get an E wave. Much more than that, I can’t say at the moment. We still seem to be defining the triangle.
In ES, we’ve come down to so a fourth wave, so we need a final wave up. Futures are still moving, so I don’t yet know what’s going on there.
Cash indices all appear to still be in a triangle. I think this thing is going to draw out until Yellen’s announcement.
OK Thank You Peter
To all new traders. Watch how your emotions can under mind your trading. As of now the sp is at 2040 level. lots of bearishness on many blogs. This can influence you tremendously to trade in WRONG direction. I have witnessed many traders from 2008 up to 2015 wiping out their accounts from other PERMA BEARS opinions. Before you pull the trigger, ALWAYS check your emotions at the door. In other words, are you feeling calm and relaxed when you pull the trigger or are you emotionally being influenced by others opinions or other outside influences with world events. Notice how you are FEELING right now with the markets dropping, are you scared of missing out on the POSSIBILITY huge drop that may or may not happen. If you are, I would highly suggest you back away from the computer and go for a walk and clear your head.
I would highly suggest that you take one Bearish and one bullish account into consideration. Take one trader who is bullish and one trader who is bearish that you may have seen on a blog. Now FEEL into your gut. ( two inches above your belly button area) Ask your self, what is the best trade I could make? Is this a bearish set up for the next 2 to three weeks ? Is your body tightening up or a ping feeling in the gut? If so,STAY A WAY FROM MAKING THAT BEARISH TRADE. Your gut feeling is your intuition. This is the difference from a good trader and a trader who will lose their shirt. Do not give away your power to any one. Go with your Gut feeling before making the trade NOT your emotions. Strictly avoid making any trading decions if on pain killers or other medications. LOL, I found that out the hard way a few months ago.
Before you fade the above info, I would highly suggest you read about Jack Welch the former CEO of General Electric. He had mentioned many times how he made his decisions based on his gut feeling and not on outside influences. All the best everyone.
For the near future, I am looking at the possibility for a SHALLOW V shape bottom to form. into next week ( 2020 – 2030 ) before we blast up into new highs with the possibility of reaching 2143 sp by year end. All the best every one.
Big spike in equity put/call ratio yesterday. Previous six times were close to lows for $SPY. That does not mean the market can not go down another 20 -30 ponts ( 2020 )
EUR/USD. I put the target for this fifth wave at 1.09 or so. That will make the fifth wave 1.6 times the first wave. The first set of waves that I labelled 1-5 were obviously 1-3. The fourth wave retraced exactly 38%, so this caused a re-labelling.
If we turn over there, we’ll retrace 62% (second wave – a nice trade), which will put upwards pressure on equities and we should see the final set of waves up in equities start in earnest then, I believe.
US currencies pairs continue to run contra to equities. CAD still bottoming, as is AUD. GBP seems similar to the euro, but it could also see a double bottom.
Peter–As the last comments indicate, being a PERMA anything is not a good way to trade or be for that matter. To be objective is absolutely key as well as having a trading discipline. One of the best I have seen at pulling the trigger on trade at what seems to be the “wrong” time is Glenn Neely of Neowave. He shorted the market Friday Dec 4…..and he might be long tomorrow, that’s what makes him so good. Gary (Denver)
Yes, Dec 4 was right after three waves up, as I mentioned at the time. However, the short was not long term (because of the three waves). So it was the right time to go short, but was not expecting a huge reward. I ended up calling the bottom of that wave.
He should be long tomorrow because we’re going up, as I said in my last comment. However, it’s likely to be a choppy ride, as I put us in the C leg of the triangle. We still have D and E to go. It can’t be wave two down that we’re at the bottom of because of the first wave up being in three waves.
Updated SPX and ES at the top of the post.
Hi peter
If wave C throws us another twist id say 17310 is the critical level .
for tomorrow im watching 17386-17310 as key support range if the dow makes a new low .
also there is another time comparison .
the drop from nov 20 to dec 3rd was 8 trading days .
the high on dec 1 plus 8 trading days is dec 11 , so another consideration for a low .
your cycle low on dec 12 now plays a crucial roll in the bigger picture .
the 5 day adv decline line turned up today even though the market was down
the 10 has not yet .
the 5 day is into its oversold lower range , hence a bottom is due .
on a close to close basis , dec 11 at 17403.50 would be a time and price match
today’s low at 17403.51 did satisfy price yet im not so sure we run straight up just yet .
either way im looking for a bottom but im not so sure of the triangle as it stands today .
the dec 4 high may be an kind of X wave . in which case we are now only putting in
another A wave of a further developing triangle . the key will be how high this market bounces . it does dove tail with your wave count though .
the dec 4 high at 17866.47 is now the key resistance that may not get taken out if
we subdivide further . a poke back above 17767.69 yet the dow stays below 17866.47
would be the clue of this further subdivision going forward .
what ever low comes in the next couple days ( if not today ) would be the key support
for the bull bear debate .
a cycle low at this time has very bullish potential as i see it .
Bottom line : im open to what ever the market does at this point before making any longer term projections .
Joe
Peter
Last comment
wave A lasted 9 trading days
9 times 1.618 is 14.562 days from dec 1
thats targets dec 11-12th.
wave C = 1.618 times A .
this is becoming interesting
Nuff Said
Joe
Correction
this would be dec 11-14th
and the fibonacci cluster dec 15 is huge .
very interesting .
Joe
Joe!
I like this thinking. My turning date is 10 december with ±1 TD deviation. Next ones (more important) are 18 Dec and 28 Dec.
Cheers,
W
Peter
On SP-500 …. I know you think we are going up tomorrow , however if we do not go up but instead go down to the level of 2012 ( A wave is around 2002 on Nov 16th ) . Then would it still be ok to consider it as C wave of the fourth wave triangle ?
Regards
AZ
AZ,
I don’t understand your A wave number. The bottom of the A wave is 2019.39. 2012 would negate the triangle. It would become a straight fourth wave as soon as it met the 2019.39 level.
Peter
Here in the UK the trading platform I use offer only one product for the Cash S&P , a product called US500.I , which is cash S&P 500 but trade the same hours as the Future S&P ( ES ) , so this is the reason for the difference between our prices , which of course make it very difficult to compare waves .
Sorry to confuse you with my question , and please just ignore it , and thank you for your help.
Regards
AZ
Interesting. Many American stocks trade in Canada and the US and, of course, when you do an analysis, it’s often a bit different, but they typically point in the same direction with or without taking the currency into account. And they too, are really hard to compare, especially right now.
There are other reasons I think we’re going up. In both the DOW and SP500, the a & c waves of the triangle’s C wave are almost exactly the same length, although the c wave in the SP500 is slightly short, but only by a few points. So we might come down a little bit before heading up, but I don’t think it will be below the larger A wave of the triangle.
Peter
You made a very good point ( Thank You )
this wave C does have an interesting time count i didn’t see until you mentioned it .
The hourly spx are almost exactly equal in length .
yet wave A lasted 34 hourly trading bars .
Wave C lasted 55 trading hours.
i am looking at a continuous emini spx chart , 24 hour chart .
wave C lasted 1.618 * A yet price was barely less than equal
My concerns though still sit with the daily time lines the fed
futures and options expiry ect .
Worth the read even if its just someones opinion
http://finance.yahoo.com/news/jpmorgan-fed-could-trigger-massive-192321466.html
Clearly a few are concerned. Gary
http://www.zerohedge.com/news/2015-12-09/lehman-rerun-banks-are-buying-protection-against-their-own-systemic-demise-again
haha … of course, banksters!
Peter–The last paragraph is the most telling of all. Gary (Denver)
Yeah, I caught that.
Here’s how our little country is doing in all of this … (or will be) Here’s a chart of the amount of gold we have left. Stunning.
http://www.24hgold.com/english/stat_country_detail.aspx?pays=Canada&deid=19576B1670
We’re almost as in-debt as the US. This is actually an interesting site as it shows the gold (and other) reserves of most countries.
I don’t think much is going to move today. The euro needs to go up, AUD and CAD down … the equities up (which is against the euro). It’s a mess. A tug of war. I don’t expect I’ll be around much today based on the action.
OF course, as soon as I say that, equities take off. You’re welcome! I guess currencies will sit it out today.
Maybe we’ll get the D leg up today in the triangle.
Still looking for a v shape bottom into next week, possibly from 2020. Looking for 2143 close to into end of the year. My exit for my longs will be 2016. I have some hedges on for the moment. I will take them off when I see some kind of capitulation with volume. Good luck every one
Joel, if you are still around. I appreciate your perspective on the markets at this time. I always enjoy your insights. All the best.
Joe, thank you for all your insights on the markets. Lol, I can not imagine all the hours you put into in these cycles. All the best.
Dave
Thanks , I’m still around
seems every day this market throws a twist or 2 .
I have to say though i have not seen so many strange time correlations
all at once in a very long time .
as an example .
a dow 5 minute chart from today’s highs .
keep in mind my timing thoughts are a bit subjective so dont count on this
if you dig into it .it doesnt usually show up yet it certainly has alot these past few
months so i watch it .
the high 1140 to the initial low at 1150 or 1155 depending on how you count the wave
was 3 bars down, 2 bars up and 5 bars down in a 3rd wave .
wave 3 was both 1.618 times 1 in price and time .
for a 4th wave i like to see a .382 retracement of waves 1-3 as well as a .50 retracement
of just wave 3 . used together they create a band . this is usually just a price band .
yet today ? we have 1 2 3 in terms of Fibonacci price and time
wave 1-3 lasted 8 bars so far the minor swing high was 4 bars
the next timeline would be .786 of just the 3rd wave .
5*.786 = 3.93 ( 5 min bars ) call it 4 .
so if this is an impulse down we should be in a minor 5th wave
a close near 17560 or an open near that level tomorrow would
be a sign of something a miss for the bullish side of the market
very short term
Joe
ES makes every day new lower highs and lower lows.
Looks like a rounding top and ES is going to retest 2000 area
any opinion on the weekly dow or spx close only chart ?
a low close for the week will probably mark wave C
Finally
Joe
ES price now @ 2023 … I think it should stop around 2010-2013 IF NOT , Then much lower prices ahead of us.
AZ
Pretty ugly open .
being that this is the end of the week and the weekly close only chart
would look perfect right here on the close im not so sure we see much
of a bounce ,
a bounce then a close near present levels would be fine by me .
guess we will see how the day goes .
Joe
This website is for educational purposes relating to Elliott Wave, natural cycles, and the Quantum Revolution (Great Awakening). I welcome questions or comments about any of these subjects. Due to a heavy schedule, I may not have the time to answer questions that relate to my area of expertise.
I reserve the right to remove any comment that is deemed negative, is unhelpful, or off-topic. Such comments may be removed.
Want to comment? You need to be logged in to comment. You can register here.