
Update, Thursday, December 3, After the Bell
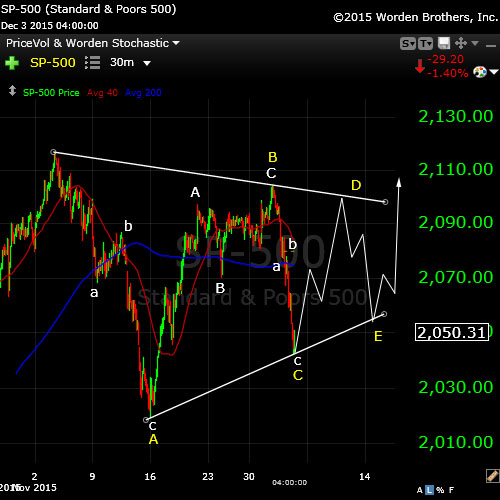
Here’s a quick look at the SP500 (30 minute chart). You can see it’s tracing out a large fourth wave triangle. All the waves so far are in 3 and the remaining waves should be also. The final wave up may either go to the previous high or may go up much further. I will do some measurements to try to find a range.
This puts well into next week to finish up the pattern. This fourth wave triangle signals that there is one more wave only after the triangle to finish up this larger C wave.
___________________
Update Thursday, December 3, Before the Bell
With Draghi’s announcement of more easing, the currencies seem to have changed direction. The eur.usd should now come down 62% to complete a second wave and then head back up again.
Meanwhile, futures have dropped without technical damage. They’re moving together with currencies inversely (as they have for a few months) so my guess is that during this second wave action in currencies, we may see futures and cash complete a double top.
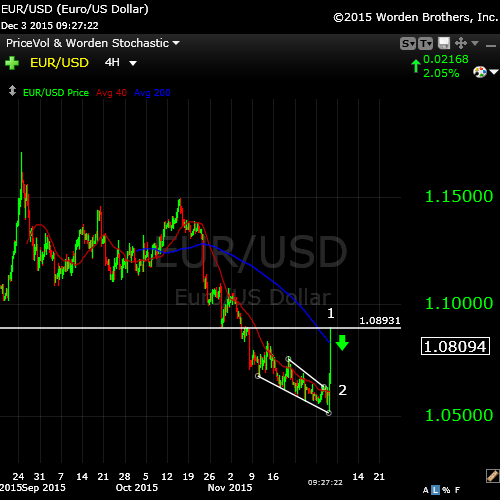
Above, a 4 hour chart of the eurodollar. You can see the ending diagonal complete this morning and the first wave up complete. It should back off 62% in a second wave before taking off again.
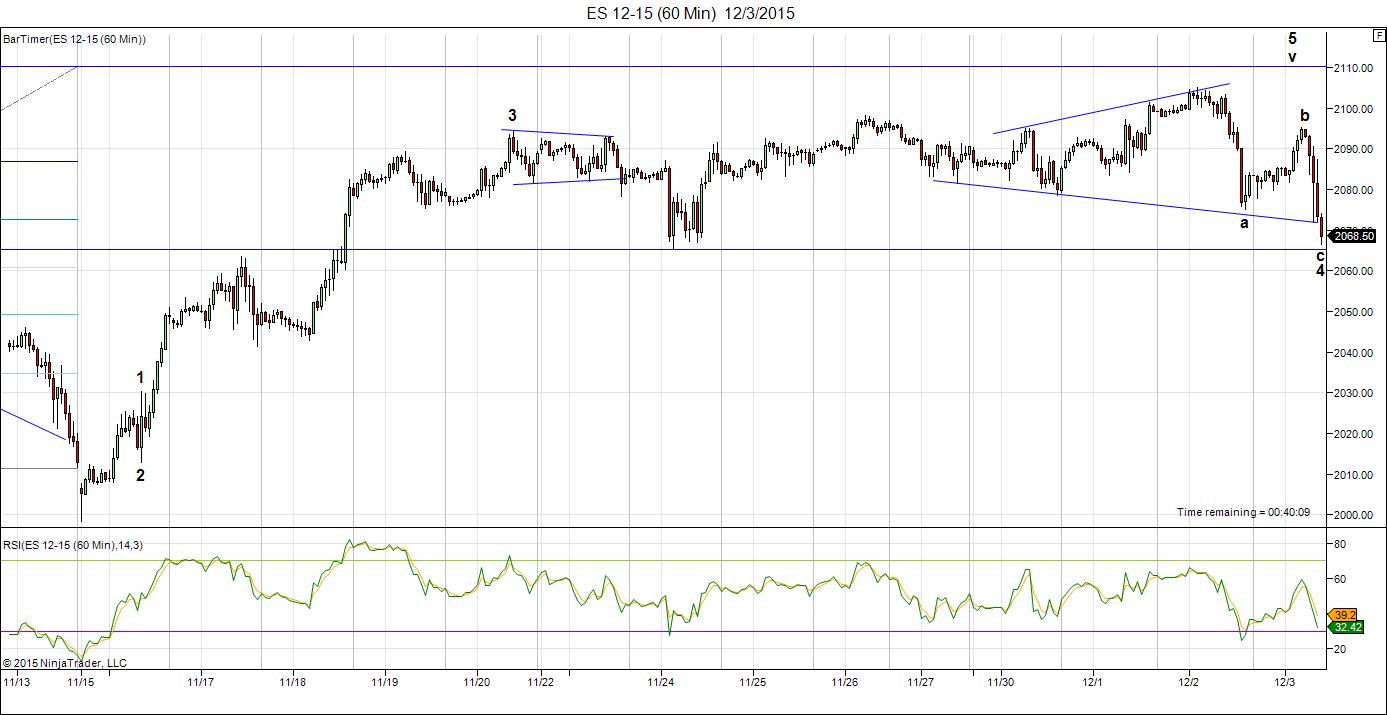
Above is the count on ES (60 minute chart) as of this morning. We have a second leg of a fourth wave forming, by the looks of it. This sets us up for the fifth wave up and the triangle disappears.
No more trying to update charts intraday. The problem is trying to label charts in transition—they’re still defining the pattern.
NQ appears in a channel and may have completed 5 waves up. They have all come down in 3 waves so far, so the target is still up.
Let’s see what happens.
_____________________________
Update Tuesday, Dec. 1 After the Bell
Tonight, I’ve updated the top two charts (SP500 and ES). There isn’t much point creating a new blog as very little is changing day to day. Currencies continue to work towards a bottom and the equities slowly trace out the final wave up.
Possible triggers this week:
- Yellen Speech: Janet Yellen, 12:25 EST, Wednesday, Dec.2
- Yellen Testimony Congress: Thursday, Dec 3, 11am EST
- ECB Press Conference: 14:30 CET (8:30am EST), Thursday, Dec 3
- Latest US Labor Report: 6:30am EST, Friday, Dec. 4
- Fed Meeting: December 15-16
The latest count for ES and SP500:

ES on the 60 minute chart (SPX futures) has traced out a 4th wave and we’re now working on the final 5th wave. I tossed out the triangle, as the final leg down ended up short. This pattern should result in an eventual test of the previous high at 2110. We’ve completed a small second wave within this last wave up and appear to be working away at the third wave.
It’s a similar count to the cash index of the SP500.
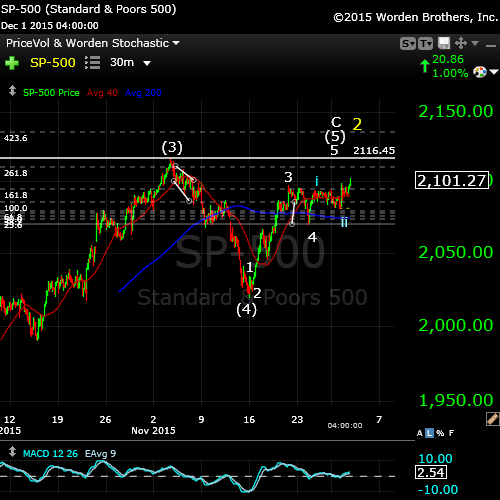
Here’s the 30 minute chart for the SP500. The final wave up continues to unfold … slowly. The SPX is in the same position as ES at the end of the day (Tuesday). We’re in a third wave of the 5th of the 5th. That would leave a tiny 4 and 5 after that up to the previous high at 2116.48.
Friday (Nov 27) was 97 days from the low of Aug, 24, which is 97 days from the all time market high of May 20, 2015.
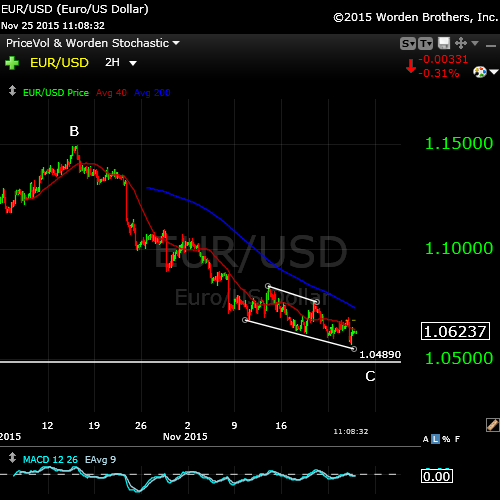
Above is the Euro/dollar currency pair. You can see the final patter playing out: an ending diagonal. The US dollar chart shows the same pattern. All the US dollar currency pairs are about the reverse at the same time the equities market tops.
An ending diagonal is a terminal pattern that ends a motive set of waves or a corrective C wave. It’s the “end-of-the-line” and results in a dramatic reversal.
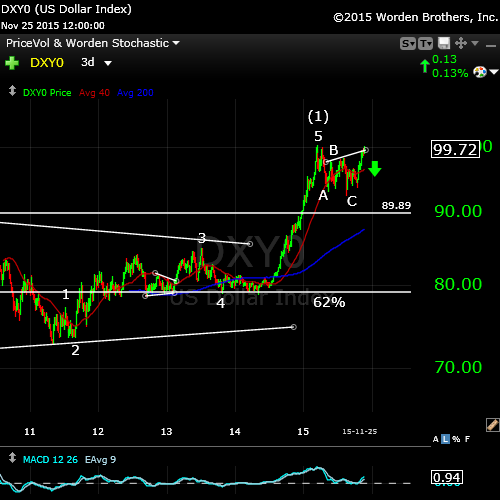
Here’s the dollar:
And finally, here’s a really super set-up, the pound/dollar.
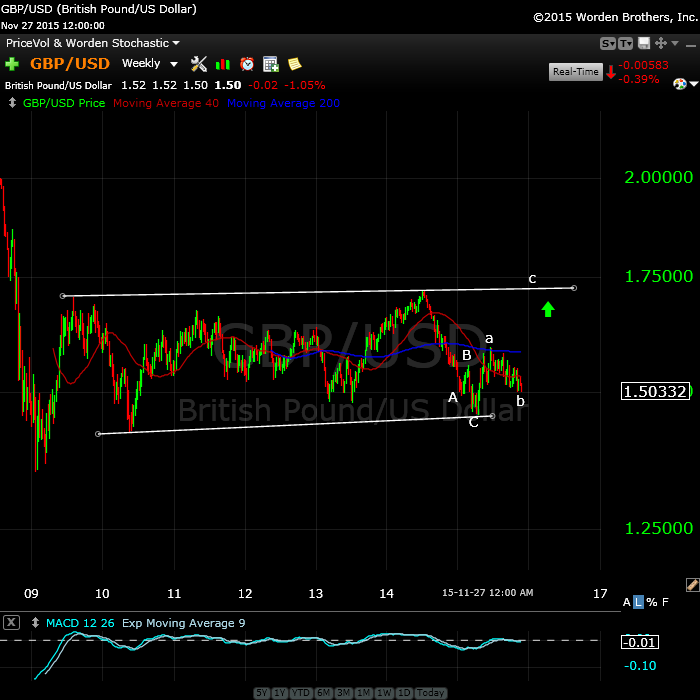
If you like trading currencies, here’s a no brainer. The GBP/USD weekly chart shows a large 4th wave triangle. We have a C wave left to go on the last leg of the triangle (the e leg) and then we should turn down into a fifth wave. I’ve been watching this one off and on for quite a while.
____________________________
Original Post: The Question of Seasonal Bias
I want to address a couple of issues here right off the bat.
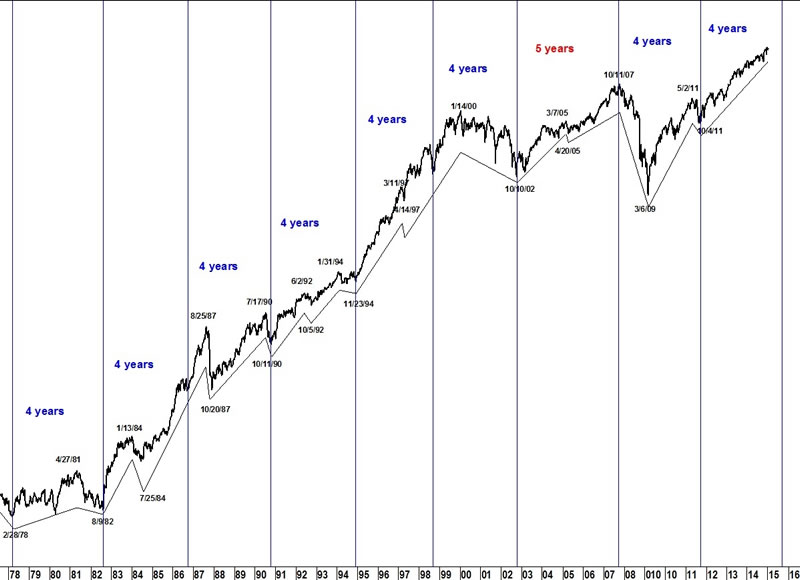
The Decennial Cycle (chart below) that’s thrown around without a lot of thought is not a “cycle” in the true sense of the word. It a short-term phenomenon, or pattern, perhaps. It’s interesting that most charts only go back a few decades to make the case for a continuing pattern.
The chart above goes right back to 1805 so you can see the issue I have with this phenomenon being anything other than a short-term pattern. 2005, in fact was ‘flat’ or negative, depending on who you listen to. So far this year, the NYSE is down one percent. I find the reference to the “decennial cycle” lacking in any kind of credibility.
You’ll find the article to this chart here.
In terms of seasonal bias, Santa Claus and end of year seasonal rallies show even a spottier performance. On the other hand, as a contrarian, I would much rather see rabid optimism in the market, as we have now. In my way of thinking, it sets up the perfect scenario.
A Wave-Following Fool!
That’s what I basically am. I haven’t found a time when Elliott Waves have lied to me. It always ends up being a weakness on my part if I get a count wrong. The waves always do the predictable thing, very often in an unpredictable manner.
Cycles are important for identifying turn dates. It could be argued that they haven’t been very predictable lately. There’s some truth to this, but keep in mind that we’re dealing with an unnatural market (influenced by central banks around the world). Cycles are natural phenomena. You can fight them only for so long. Eventually they’ll take control again.
We’re looking at November 23rd to 25th (full moon) as possible turnover days. The wave structure forecasts a turn. Converging cycles (I cover this below) are also pointing to the very near future for a trend change.
It’s interesting to note that the period between the May 20, 2015 market high and the low on Aug. 24 is 97 days. Taking that same timeframe from Aug 24 (97 days) takes us to Nov. 27 (this coming Friday).
Bottom Line: We’re in the final fifth wave up looking for a double top, turning over into wave three down.

Here’s 15 minute chart of the SP500 from the market close on Friday. There are a couple of ways of counting this wave up, but nonetheless, I put us in the final 5th subwave heading for the previous high of 2116.48. We may either be tracing out a traditional motive 5th wave or heading into an ending diagonal. There are signs in the futures that we’re in the midst of the latter, but the end result will be the same.

Backing out the chart of the SP500 (1 hour bars), we can see the larger pattern playing out. This is an expanded flat scenario, which is a set of corrective waves in an ABC (3-3-5) configuration. You can see we’re in the final stage of the C wave.
What’s particularly interesting about the ending of this wave is that the fourth wave dropped to exactly 1.618 times the length of the first wave, which is the usual length for a 5th wave. It also dropped to the previous 4th wave. It always amazes me as to how organized the market is.
This forecasts the probability that the fifth wave will stop at the previous high (2116.48) and turn down.
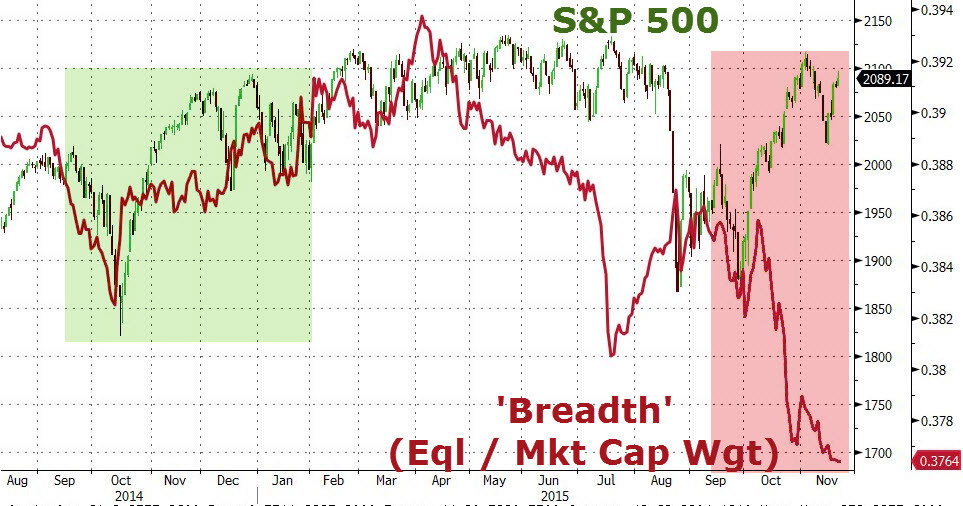
Above you’ll find a snapshot of market breadth, which continues to implode. This is from today’s zerohedge blog post.
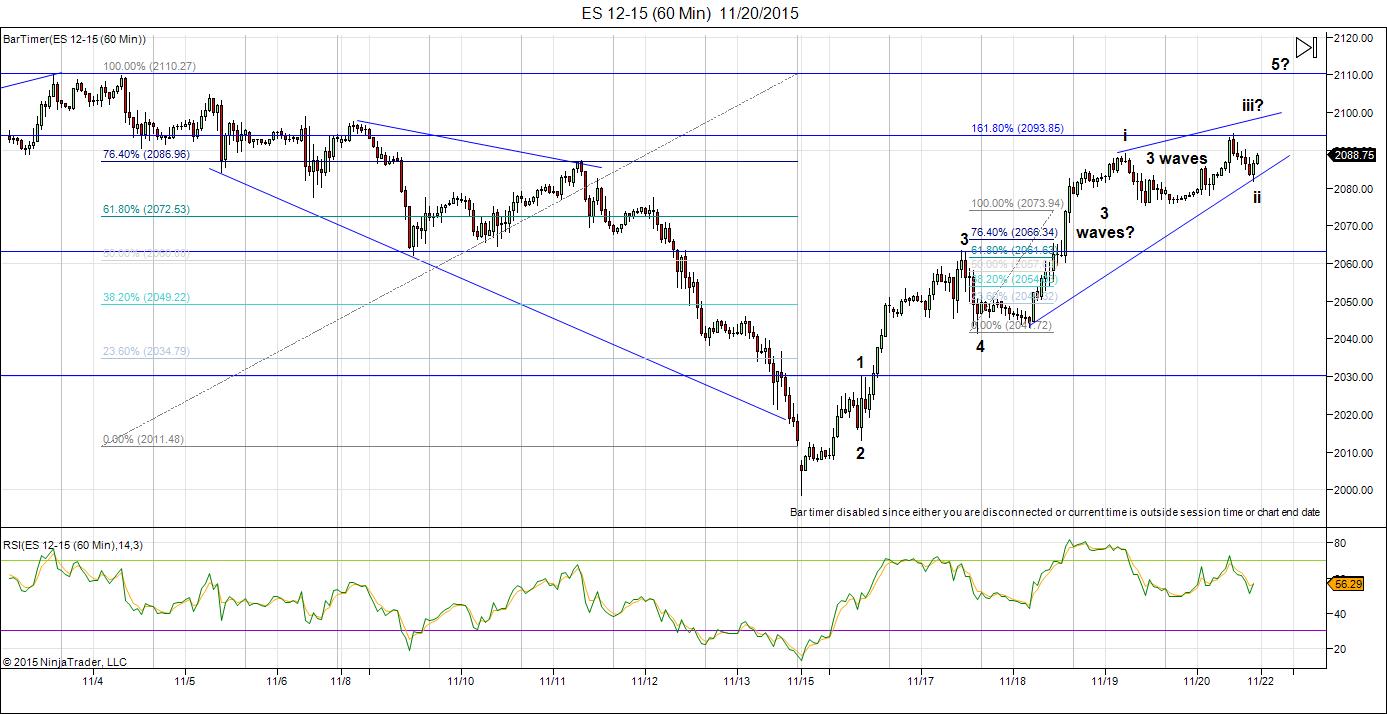
This is the one hour chart of the ES (SP500 futures). I’ve labelled the waves, which are much easier to decipher here than in the cash indices. Look at the final waves. The segment after my i label is definitely in 3 waves and the wave up before it also looks like 3 waves, but I can’t be as certain about that. This would suggest an ending diagonal, a wave in 5 subwaves, each wave of which is 3 waves (3-3-3-3-3). This is an ending wave and if this is what continues to trace out, it should give early warning of a top.
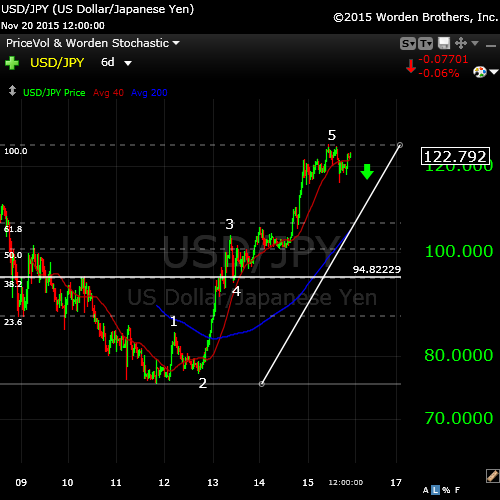
Currencies have turned, or are in the midst of turning. This is the 6 day chart of USD/JPY. It shows the first motive wave up from 2012. You can see that it’s complete five waves up. It needs to retrace in a second wave down and, in fact, has already turned. It appears to have completed one wave down, one up, and is set to start the C wave down. I would expect this wave to retrace 62% (the horizontal line).
This reinforces the “All the Same Market” idea that I’ve shown in previous posts. In fact, all the US currency pairs have either turned up or will do so in a matter of hours or days. There are some very good opportunities setting up here.
Now on to cycles:
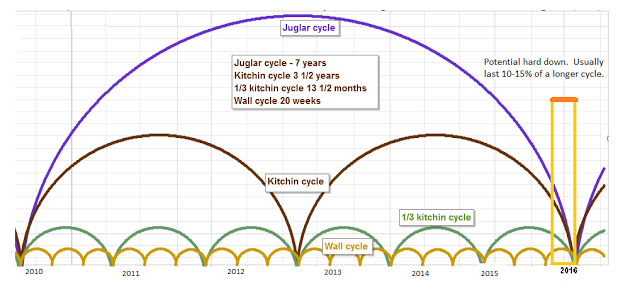
Here’s a chart of the Juglar, Kitchin, and Wall cycles which are harmonic. They’re forecasting a turn near the end of 2015 or very early 2016. More specifically, they point to the January/February time period as a bottom.
You can find this chart and a full explanation at http://swingcycles.blogspot.ca.
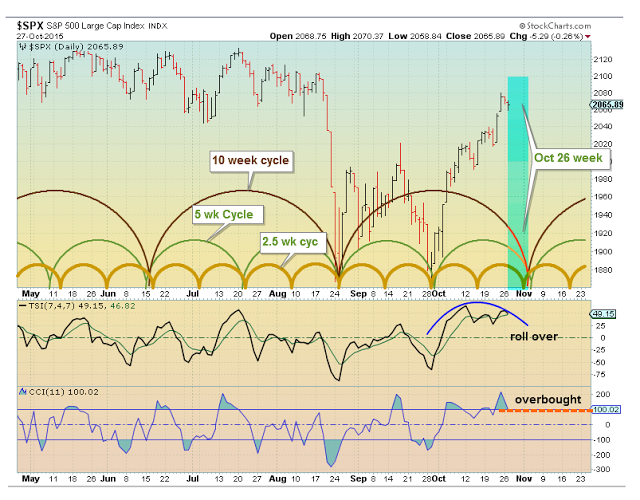
This is a similar chart of the recent past. You’ll see the end October/beginning of November forecasting a major top. In fact, we topped in wave 3 of C on November 4—a direct hit.
Andy Pancholi’s “Market Timing Report” forecasts November 23 as the major turn point for the month. I highly recommend it for its accuracy. You can find it here.
On a longer-term basis, here’s a look (above) at the 4 year cycle on the DOW. This cycles forecast looks to the end of 2015 for the turn. You can see how long-term and persistent this cycle is.
I was asked this week about the broadening market topping pattern (well-known market topping pattern—not Elliott Wave related), so decided to include it here.
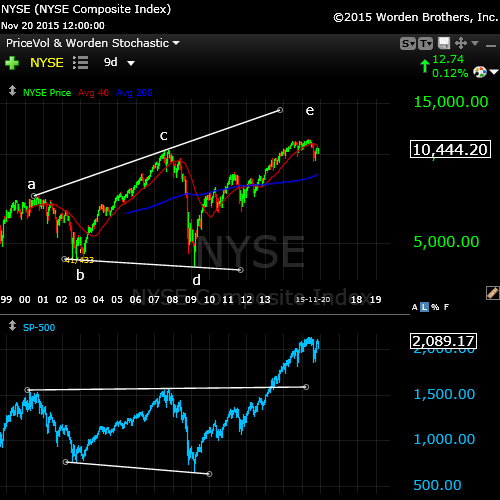
Above is the larger broadening top of the NYSE in a 9 day chart going back to 1999. This would be called an “ending expanding diagonal” in EW terms. It’s an extremely bearish pattern and seem to be failing in the final stages.
It’s interesting to me to note the difference in the NYSE as opposed to the SPX (lower blue chart). It speaks to the breadth of the market. It tells me the buying is concentrated in the big cap stocks.
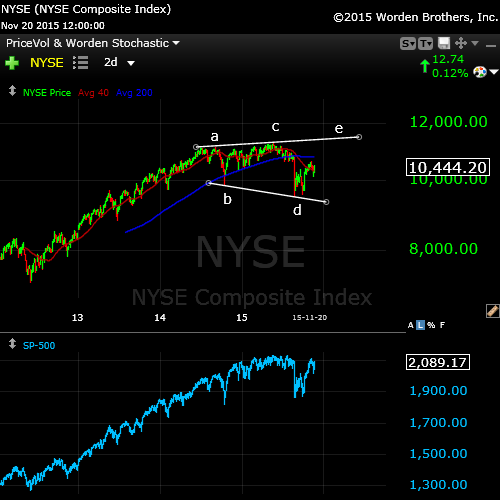
Above, we can see this same pattern on a short term scale in the final wave of the larger topping pattern. We have what appears to be a failing e wave in the NYSE 2 day chart.
There’s also a non-confirmation here, as well. with the SPX chart. This suggests the rally is narrow on even a short term-basis, with most of the buying in the big cap stocks.
DOW Theory (Transports and Industrials Non-Confirmation)
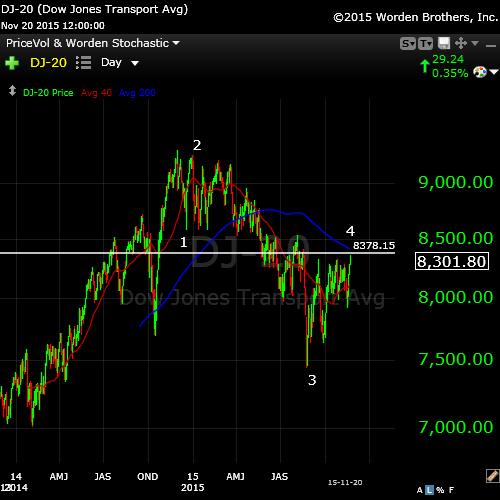
I haven’t brought up the Dow Transports non- confirmation for a while, but it’s been busy at work setting up for the next drop. The Transports Index (DJ-20) is tracing out a typical fourth wave (above), with the Industrial Index finishing off the 2nd wave (below). Both are setting up for a turn down in tandem. You can find background on the DOW Theory here.
For more confirmation, you can visit this article on the Baltic Dry Freight Index. Scary stuff!
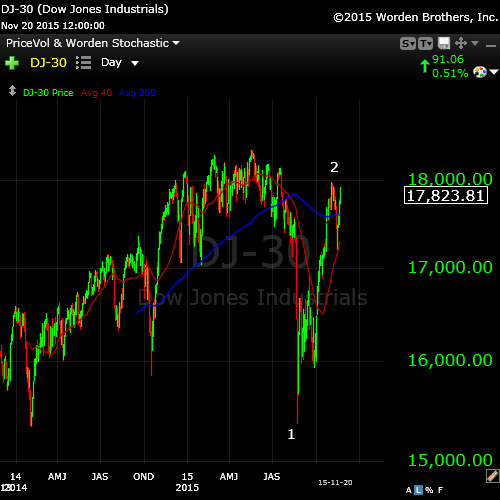
Above is the daily chart of the DOW, showing us at the top of wave 2.
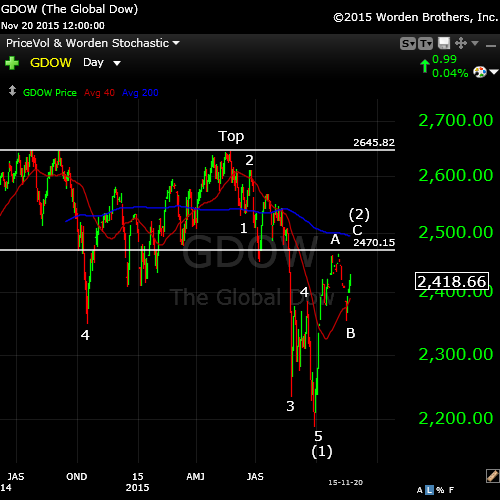
Next to last, here’s a daily chart of the Global DOW. Not much has changed here lately.
The Global DOW is like the elephant in the room, letting you know what’s happening on an internationalk basis. We’ve completed one set of motive waves down from mid 2014 and have retraced exactly 62% in a second wave, where we sit now. Actually, we’re completing a fifth wave up in this second wave rally, which should top at the same time as the US equities roll over. The writing is on the wall!
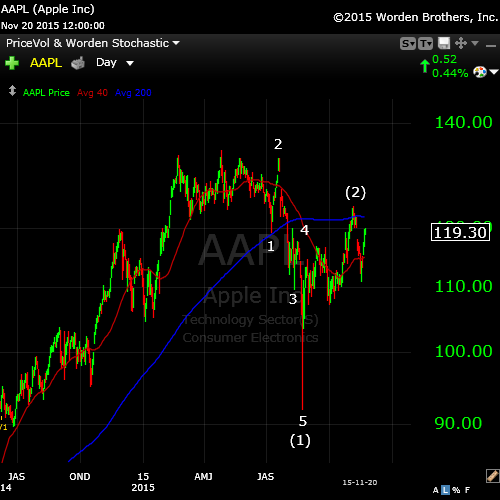
Finally, a daily chart of Apple Computer. Here’s a textbook Elliott Wave set-up, with absolutely perfect fibonacci measurements. We completed one wave down of 5 motive waves and retraced more than 62% bin an ABC second wave. The third wave down is 1.618 X the length of the first wave, which the fifth wave is a similar length. Nothing like hitting me over the head with an Apple bat!
The final small wave up will either turn over now or head up to test the top at (2) before rolling over into a third wave down.
There are a lot of stocks setting up in similar manner out there …
It should be an interesting week coming up, both with equities and currencies. Stay safe and profitable.


THE HALLMARK OF A GREAT TRADER AND A CHALLENGE FOR MOST IS THE ABILITY TO WAIT PATIENTLY FOR THE CORRECT SET UP. ; I CALL IT SIT OUT POWER ‘
Mark Minervini
All good traders have an exit point when the trade reverses. My bias for the short term is bearish down to the 2040 level. If we do indeed rise over the previous highs 2116 I will exit my hedges. Good luck every one.
I updated the two top charts. We continue to move like molasses, so there’s no point in doing a new post at the moment. Very little has changed.
VIX gaps – unfilled gap from 11/09 and a new one today. These suggest to me that the SPX needs to go higher to fill these gaps in VIX, before any significant downside in SPX.
VIX hourly chart…..
http://invst.ly/ku6f
12/3 LQ moon
12/4 Lunar declination cross equator south
12/5 moon at apogee,
Think this keeps giving some support. But for 2-3 days max. Get ready!
André,
That works with the count. We’re getting awfully close.
Peet!
Can.you help me out a little with EW labeling? When you look at AEX daily or if you like S&P500 daily, from October 2014 low to August 24 2015, how would you count the whole??? I struggle with the difference in top date (27 April vs 25 may) between the AEX and S&P and the choppy count that follwed ending with a huge upmove to 20 July… Hope you can shed some light on this bigger daily picture and compare the AEX with the S&P (daily).
Cheers,
W
Wouter,
Overall, it’s pretty close to the SP. I can’t drill down to the subwaves on that one, so that’a about the best I can do. Looks like the first wave down goes to may 8, then you have a double pronged second wave. The 3,4,5 waves are exactly 2.618 X the first and then the abc up larger second wave.
Hi Peet,
Thanks! However it is still not totally clear for me. I did send you an e-mail with my thoughts.
Cheers,
W
Have nothing from you. Won’t be here much today.
Peter–Are you familiar with the work of Glenn Neely? Thanks, Gary (Denver)
Yes.
Peter–I realize he is unorthodox but he has made some great calls over the years and won numerous awards. He has been a thorn in Prechter’s side since the 1987 crash, when Neely was one of the very few analysts that turned super bullish after the crash. He does not follow the dollar, trades the EURO and has some very interesting comments about the current set up for potential collapse. Have you read his 72 year forecast published in 1988? Some very interesting stuff, DOW 100,000 by 2060 or so. Gary
I tried to read his book on EW but it was so overly complicated, I gave up. I wouldn’t recommend it. The DOW is not going anywhere near 100K by 2060. We have a 100 year mini-ice age coming, unfortunately, along with a major worldwide drought.
Peter–Do not own the book, would not even attempt to second guess his calls. All I know is that the complexity of his work, seems to make his calls more likely to work. Classical EW lends itself to failure at times because the obvious count is often obviously wrong and the market fades the wave count. Gary
Of course I totally disagree with your description of the reliability of EW. That’s not my experience.
Hi Gary!
Gary from DC here…
What is Neely saying currently? Snp? Gold, etc..
Thx
Neely seems as uncertain as he has been in a long while. Still VERY bearish gold for the long term, too many still want to own it as a hedge. Deflation is the theme. Stocks, up in the air, he called for a new bear on the Aug decline, but the strength since has been somewhat frustrating….waiting on Mr. Market for more clues. Believes the EURO is setting up for a large down move, just not quite ready. I have learned never to fade his counts. Gary
I updated the SP500 chart above this morning and deleted the triangle. We’re going straight into a third wave of the fifth. It looks like ES has finished its triangle. Also looks like usdcad bottomed this morning (must have been an annc.). Getting closer.
I take my usdcad comment back. I hadn’t backed out the chart far enough. It hasn’t quite bottomed, imho.
Down into 2018 confirmed but start to think this will just be the first leg. After a low in 2018 and a high in 2020 further down into 2023.
2015 high comparable with 2000 high, so more significant than 2007 high. If you think 2007 was a crisis, think again.
One scenario even goes down into 2032, but have to do some more research on this. 2018 low is certain.
I just updated the ES chart, throwing away the triangle (as we didn’t quite complete it overnight) in favour of a simple, small 5th wave sequence up.
For anyone still contemplating another wave up http://www.zerohedge.com/news/2015-12-01/chart-too-ugly-comfort
I updated the two top charts in the blog post (as at the end of the day) SPX and ES.
beginning to fill the lower VIX gap, but not completely filled, yet. Need a bit more up in the SPX to close the VIX gap.
http://invst.ly/l0hk
Good catch Amb.
thx, Dave
the SPX going higher to close the VIX gap doesn’t necessarily mean that the SPX will be satisfied there and not go higher, yet. The SPX could still go higher and drive the VIX even lower, after the gap is closed. time will tell.
Peter,
in the count that you suggest for ES the wave iv has overlapped with the the wave i.
May be it is more reasonable to suppose your wave iii to be the wave i and your wave iv to be the wave ii ?
In this case we should be now in the middle of iii which should go to test ATH at 2130 and then iv and v.
But this will change everything.
Dmitri,
Good catch. However, there are a few ways to count this. I would just leave the whole upper level as a fourth wave triangle, which works and breaks no rules. It could also be an ending diagonal, but would need one more leg, so I’m not at all worried about it.
There’s also the note by Prechter (which I don’t necessarily buy) that small allowances can be made for futures. I’m more inclined to think that’s why their group has so many wrong counts—they’re too lax in the application of the principle.
Peter
Dmitri,
I also see that NQ missed the top by $1 and YM by 1 tick and backed off. So we could get an opening gap reversal in the morning in cash, or something along that line.
But in this case SPX may make a new all time high.
It should change all the count?
I don’t understand the comment. In what case?
The SP500 is finishing wave 5.
Well,
if the wave i was from ES-Dec 2066 to 2098 (32 points) and the wave iii has started from 2078 it should go up to 2130 (32×1.62=52). It is almost all time high of Mai 2015.
And we still have the waves iv and v that may extend higher or make the double top there.
Dmitri,
Measurements are simply guidelines, not rules. That’s the first point. Secondly, I’ve just said that a better way to label the last set of waves is as a 4th wave triangle, so measurements have absolutely no bearing. Third, if you remember way back, I stated that in the C wave, the 4th wave had backed off exactly 1.618 X the first wave. If we top here, which I fully expect, wave 5 will be 1.618 X wave 1.
So I’m not sure exactly what the concern is here.
Thanks, Peter
Watch for a top this morning.
Tomorrow in the best case
Well,
the FED is more important for the market than ECB.
At the same time it has not gone to its target.
May be Draghi will be able to do “whatever it takes” tomorrow.
Not any more. International debt and the dollar are driving everything.
Peter,
do you want to say that the market might not go to its target ES 2110 ?
No. Nothing has changed.
Up in 3, down in 3.
Well,
the triangle is broken.
What is the count now ?
Still the 5th of the 5th of the 5th. Nothing came down below the previous fourth, so nothing has changed. We’re still heading up. I’m still figuring previous highs are the targets.
Peter–Jesse Livermore used to say pay attention to underlying conditions. Gary (Denver)
http://www.zerohedge.com/news/2015-12-02/mario-draghi-may-under-deliver-tomorrow-mni-warns
Peter–Nice call on the Dollar, looked like a classic throw over and reversal lower. Gary (Denver)
Gary,
Been out, so just taking a look. My first assessment is that we’re not done yet. It may be REALLY volatile in the next 24 hours.
BREAKDOWN!!
With Draghi’s announcement of more easing, the currencies seem to have changed direction. The eur.usd should now come down 62% to complete a second wave and then head back up again.
Meanwhile, futures have dropped without technical damage. They’re moving together with currencies inversely (as they have for a few months) so my guess is that during this second wave action in currencies, we may see futures and cash complete a double top.
Let’s see what happens.
Peter,
the Europe is on sell on heavy volumes
I just posted charts at the top of the post, including ES.
ES has retraced today exactly 62% of yesterday decline
Hey Peter – Please reference this post from above –
“Peter Temple December 2, 2015, 4:32 pm
Still the 5th of the 5th of the 5th. Nothing came down below the previous fourth, so nothing has changed. We’re still heading up. I’m still figuring previous highs are the targets.”
I’m trying to figure out the fourth, to which you are referring. ‘Previous fourth of lesser degree in opposite direction’ would be in the C wave up? Does a C wave have a fourth if it is corrective? Are we still in the 5 of 5 of 5; or has it morphed into a 4th….again? I’m lost in waves, as I guess this post reveals. Can you identify the es value that is the fourth support you are describing?
Thx!
Well the market has gone under the previous 4th wave
I don’t know what market you’re talking about.
I updated the ES chart and description. However, no more intraday updates.
SPX has gone to 2067 today.
The previous 4th was at 2070
ES-Dec 2065 today
the previous 4th – 2066
As mentioned earlier in the post a few days ago, I was expecting a shallow pull back to the 2060 level. I am liquidating some short hedges here at the 2062 level. All the best every one.
If SPX confirms the break of 200 DMA it will head lower
You could be right, Dimitri. I still have some hedges here in case. We may see it come down to the 2050ish level.
Sorry, I meant to say 2040ish level.
investing.com 76% bearish on spx. I do not see a major correction here at all. Will have all hedges off by the end of the day.
I have completely out of my shorts. (sp 2052) Will be using the funds to go long shortly. All the best.
Dave,
I think until 2020 all the rips will be sold.
May be the market wants to make the pression on Yellen before the Dec FED.
Possible a small sell-off on Monday
Dmitri,
This 4th wave triangle doesn’t extend to the futures. They could be in a large fourth wave (I think more likely due to the wave structure of the wave going up) or a second wave. I’ll have to spend a bit of timing sorting that out.
Hi peter
Todays market action leave me with a few thoughts .
the drop from nov 3 to 13-16th wave A of what id like to all a developing triangle
wave b nov 16 to nov 20
this is where it gets tricky , closing prices versus print prices .
on a print basis this is a simpole a b c decline so far yet on a closing basis
using a 60 minute chart ( dow ) its an expanded flat B wave .
17587-17528 would be the support based on just the decline phases
in relationship to time . yet if this really is a true triangle formation
we should see the dow drop below 17451 .
this leave me with 2 scenarios .
1) a low now or early tomorrow followed by a 3 wave rise up into dec 9-expiry .
or more sideways actions which would begin from lower levels
( below 17451 ) into the dec 9 expiry time frame .
a low into mid dec leaves a more bullish set up and honestly im confused
right here today as to which is the more favorable situation .
a case can be made with the hourly chart that today is the bottom .
3 wave movements can be a pain in the neck at times to nail down in advance
joe
$SPX gap fill in sight 2050.44 (11/17 close). Otherwise, they want to test 50-day SMA 2038.9. 2039 previously a big breakout point, Oct W4.
Quick update chart on the SP500 top of post.
The c wave should be 61.8% of the a wave on the SP500, which would bring it in at 2044.72. If it drops below that, something else is happening.
What happened to all those that thought we were headed to the August lows in this cyclical time frame? Remember that chart Peter put up that showed the wave structure going to ~ SPX 1850 in the middle of December?
Trade what you see!
I see we are down almost 500 DOW points in two days : )
Gary G.
I agree Gary…acts impulsive to me. Gary (Denver)
Gary–What do you make of the triangle idea? The dollar clearly turned today and it sure looks to me like stocks did too but EVERYONE believes in the year end rally so you have to find a way to be bullish? Gary (Denver)
Not me Gary, I still see a positive year ending for the indexes. Just shallow pull backs.
This fourth wave triangle puts us well into next week for finishing up this pattern, but it makes the path for the next few days relatively clear. I will post some charts but it will be Friday before they’re up. I want to wait for confirmation of the triangle, but the probability is very high based on the three wave structure of all the waves.
Wave C came in very close to the target. It just has to hold.
I’ve updated the triangle at the top of the post for the SP500 to show the trajectory for the balance.
Hi peter
Nice update today .
my count slightly different yet were in the same thought process.
i have the nov 20 high as the top of B and the 9 day drop
is todays low . wave C equals A in terms of time .
nov 3 to nov 16 9 trade days
nov 20 to tomorrow 9 trade days .
last time , nov 13 was the closing low and nov 16 ( 9th day , print low and a reversal )
a gap down opening tomorrow would be perfect yet id like to see the market prove it .
nov 3 high to nov 16 low was 67 trading hours down .
from nov 20 high adding 67 trading hours equals todays close .
implies a gap up tomorrow yet id rather see the gap down followed by a reversal to the upside .
17977.85 nov 3 high minus 17210.43 nov 16 low was 767.42 points down
.618*767.42 =*.618 = 474.26 pts
nov 20 high at 17914.34 -474.26 = 17440.07
looking at a 1` minute chart today that level was broken yet the market was swinging
around it . hence ill keep an eye on 17440 as my key level .
wave C equalling .618 of A and the retracement breaking below 17451 satisfies a wave C
of a further developing triangle . lower support to a dap down opening
would be the .786 retracement at 17361 and 2.2 times the smaller wave a which was the drop from 17914.34 to 17683.51 , minor a wave b at 17901.58 . wave c blew past the 1.618
at 17528 so i go with the 2.2 because i’ve observed it many times .
Bottom line . Wave C is satisfied based on price and time yet a gap opening tomorrow
from 17393 to 17361 cannot be ruled out yet if seen im buying it .
the initial bounce in this wave D should test the 17663-17683 range fairly quick or id assume something is amiss with this triangle formation .
looks like im waking up early in the morning looking for a trade .
Joe
Good info Joe as always. I will be fully long here shortly, concerned about 2020 level perhaps. Either way by tomorrow morning I will be going long.
concur. before the close I sold my puts and bought a couple calls – for a short term trade.
Also $ES_F printed the highest volume since the crash. I would say we are within a nearby bottom.
Hi Dave,
Or the real downmove has started and volume confirms?
Cheers,
W
I am going to start putting on my hedges again. My main concern is that their is going to be lots of head fakes in the market into mid month. Great time for swing trading thou.
This is an update to a similar post I made a few weeks ago.
At about the 13:00 mark in the video below, he mentions a “currency event”.
That event may have triggered yesterday.
The overall analysis based on cycles is unfolding as he describes.
https://www.youtube.com/watch?v=B5e56ISoJ7g
Gary G.
new post: https://worldcyclesinstitute.com/running-on-empty/
Peter…In the Hmmmm category, has anyone noticed the action in the NYSE this morning. With the DOW up over 200 and the SPX up 20 the NYSE is up a whopping 40 points and is still below it’s 50day MA. This one chart clearly indicates to me that we are in a broad based bear market. Gary (Denver)
http://stockcharts.com/h-sc/ui?s=%24NYA&p=D&yr=1&mn=0&dy=0&id=p62668648438
The US indices are pretty much doing the same thing to me. Do you see it as being somehow different?
Peter–Not really, the NYSE appears far weaker and a warning of clear and present danger! While CNBS touts the DOW, SPX and COMP to keep the bullish juices flowing….the patient is actually on life support. Gary (Denver)
Gary,
I’m been saying that for months. I always go to the NYSE charts whenever the other US indices give conflicting or whacko signals. The NYSE always tells the true story. This is why I’m not expecting equities to reach much above the previous high. That and currencies.
btw, there’s a new post up.
Peter–Neely vs Prechter…..I have followed both gentlemen for a long time. When it comes to writing eloquent intellectual masterpieces about socionomics and the ramifications…Prechter wins hands down. When it comes to trading the markets Neely is far superior. The reason is as follows from the man himself…”Neowave is FAR more precise and reliable. The downside of NEoWave (which is actually a plus) is that you “know” what is going on less often. But, when you do, the specifics and details are stunning. With orthodox EW, you always think you know what is going on (which is very dangerous) and 50-75% of the time you’re wrong!
With NEoWave, you know what is going on about 25% of the time and can mostly avoid the financial disaster of trying to trade the other 75% of the time when you know that you don’t know.” I have found this to be true, for what it’s worth. Gary (Denver)
I agree on Prechter. But Prechter also admits he’s not a trader (to me, at least). His people are wrong a lot. I actually worry when I agree with them. I’ve stated many times here what I feel are the key issues.
I don’t agree on traditional EW. It’s the person who uses it that is typically the issue. The biggest problem EW has, as far as I’m concerned, is all the people out there that say they know it and produce the most ridiculous charts labelled in inappropriate ways. They break hard rules left and right.
I found Neely’s book so needlessly over-complicated that I put it down.
EW works for me. I have a very good record with it and it always gives warnings when something is amiss. You can see that on today’s ES chart in this morning’s post. And I don’t trade when I don’t know what’s going on. But then, I’m not a day-trader, other than occasionally.
So, you can’t sell me on Neely.
Peter–Won’t try…for educational purposes only. Gary (Denver)
Ha-ha. Somebody else tried to educate me a few months ago … :-). I’m way too far gone …
Peter–Perhaps your wife, if you have one. Mine has being trying to no avail for 44 years. Gary (Denver)
https://www.youtube.com/watch?v=R7en_MWDDjc
Sorry, don’t have one of those animals around here … 🙂
This website is for educational purposes relating to Elliott Wave, natural cycles, and the Quantum Revolution (Great Awakening). I welcome questions or comments about any of these subjects. Due to a heavy schedule, I may not have the time to answer questions that relate to my area of expertise.
I reserve the right to remove any comment that is deemed negative, is unhelpful, or off-topic. Such comments may be removed.
Want to comment? You need to be logged in to comment. You can register here.