The Last Spike

The “Last Spike” refers to the culmination of the building of Canada’s national railroad right across the country. It united the country by making travel across it infinitely easier than it ever had been before. The development of the railroad business led to an economic boom in both the US and Canada.
“The driving of the last spike may have been the great symbolic act of Canada’s first century, but it was actually a gloomy spectacle. The cash-starved Canadian Pacific Railway (CPR) couldn’t afford a splashy celebration, and so only a handful of dignitaries and company men convened on the dull, grey morning of 7 November 1885 to celebrate the completion of the transcontinental railway.”
It’s interesting to me that there are two stories surrounding the driving into the ground of the last spike. There as the official ceremony of the executive team (all for show) and the behind-the-scenes story, involving discrimination, racism, and extremely hard treatment of the workers overall. Fake news.
Fake news seems to be a phenomenon of market tops: Cycle tops tend to have lots of similar societal effects. You always find the highest building and largest construction projects culminate (or are suspended) as market tops.
“At the extremes, the herd is always wrong. One should not under estimate its capacity for stupidity.”—The Secret Life of Real Estate, Phil Anderson, p 329
The Last Spike ceremony marked the top of the market at that time in both the US and Canada.
Wikipedia: “Like the Long Depression that preceded it, the recession of 1882–85 was more of a price depression than a production depression. From 1879 to 1882, there had been a boom in railroad construction which came to an end, resulting in a decline in both railroad construction and in related industries, particularly iron and steel.[24] A major economic event during the recession was the Panic of 1884.”
We are in the last spike of this incessant bull market.
The last spike of markets around the world (the final five-wave rally we’ve now entered) will have an opposite effect on society. It will divide society to a degree we haven’t seen in five hundred years. In the coming decades, we’ll witness a complete breakdown in society. There will be a civil war in the US. Climate around the world will start to get colder and dryer. There will be food shortages worldwide. We’re going to see pandemics spread from their incubators (eg- the Black Plague in Madagascar) to affect areas now considered safe. The financial system will break down with hundreds of banks going under, credit will freeze up, government services will cease to exist in many jurisdictions. We’re going enter a period of spiralling deflation, which I’m explained here many time before.
It’s time to start considering your future, where you’re going to live, and how you’re going to ensure you have the necessities of life in a much more uncertain world.
To that end, this week I’m updating my “Navigating the Crash” webinar presentation and will be scheduling for the week after US Thanksgiving. I’m also putting together a webinar on basic Elliott Wave. More info on both to come next weekend.
Last Week Review
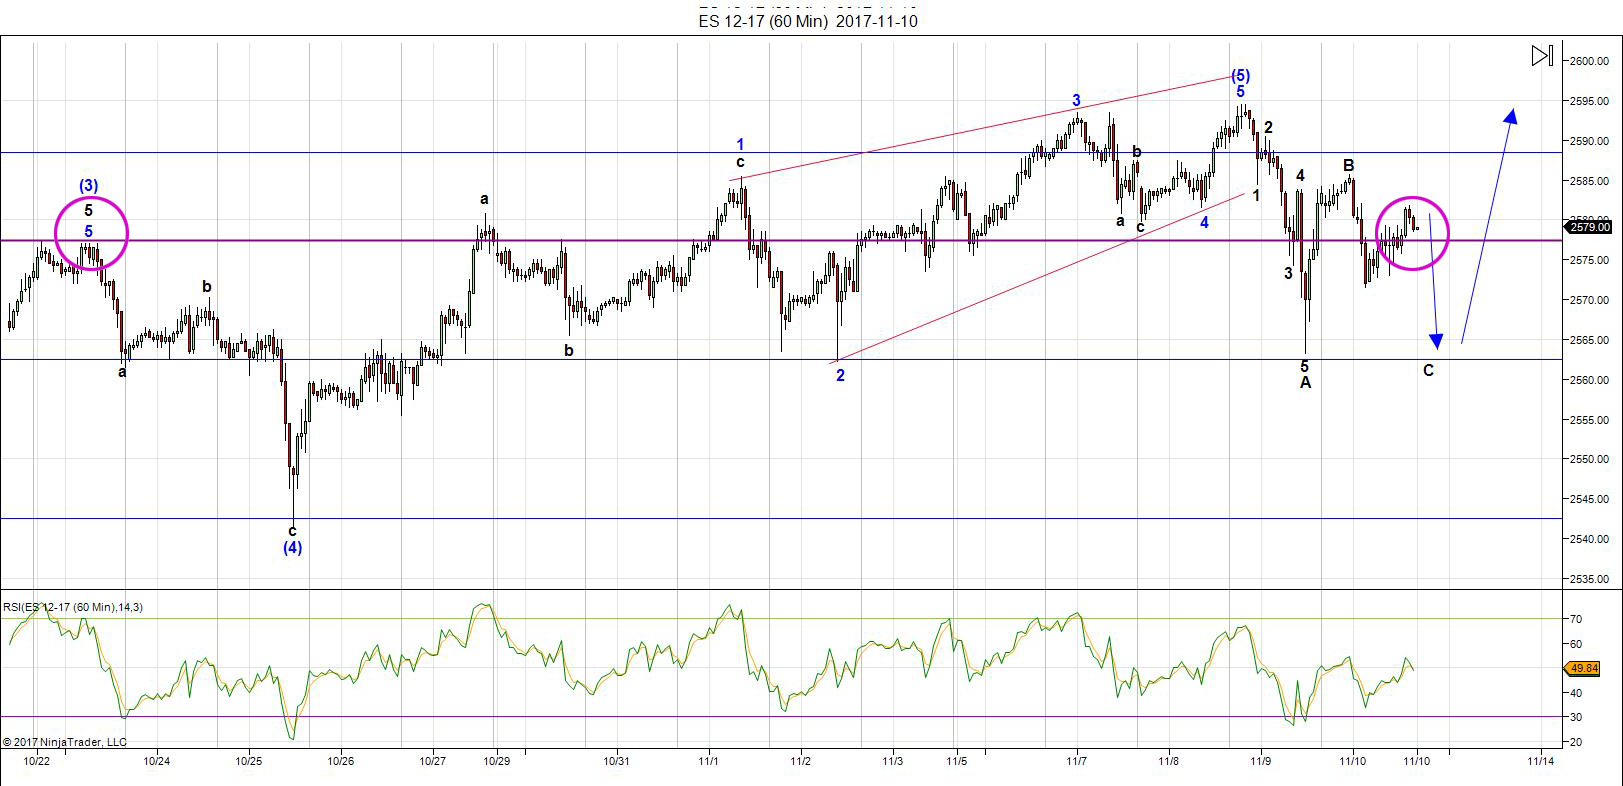
Above is the 60 minute chart of ES (e-mini futures). This is the hourly chart I provided here last weekend, projecting a drop in a C wave to 2563 and an immediate turn up to a new high. I had also cited the fact that we’ve gone sideways for approximately 3 weeks (the purple lines and circles on the chart).
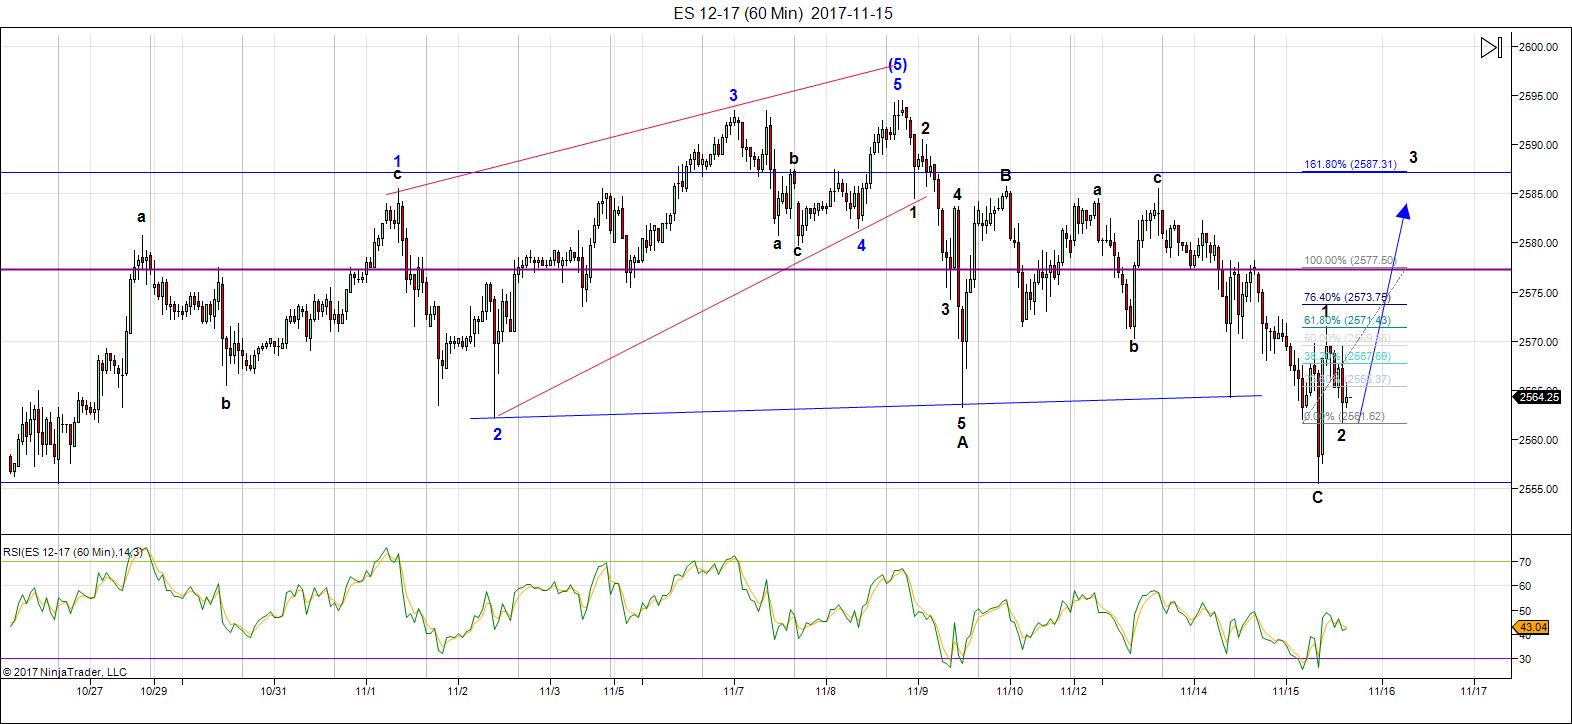
Above is the same chart, same time frame, from my posting to my Trader’s Gold group on Wednesday evening, Nov. 15. This showed we’d achieved the goal and had turned up with an impulsive first wave and a second wave down that had retraced exactly 62% before bouncing into what would be an impulsive third wave.
Now, my target for the drop was 2563, which would have achieved a double bottom. We dropped a little bit lower, to 2555, where the C wave down was then exactly equal in length to the A wave, a common fibonacci ratio.
There are other common wave relationship between the A wave and the C was of a corrective move. They are:
- the C wave extends to a distance that is 1.618 X the length of the A wave
- the C wave itself measures 1.618 X the A wave.
After the turn, I was projecting a final new high. That’s up next and will unfold across all the major US indices.
This is just one example of the power of Elliott Wave. I allows me to predict the market like this on a consistent basis, which provides a high degree of confidence in trades.
A Higher Tide Floats All Boats
 Whenever we get close to a major top in ES (emini futures), the comments start to flow predicting a top (or not). Usually these comments seem to come from those fixated one one index—the SP500. But, the market actually consists of more than one index, and the driver of the entire thing is the US dollar (the reserve currency).
I have always maintained that once one index tops, they all have to (so that they stay in sync). This is a “market rule.”
But it’s more than this that keeps the SP500 from not topping until the others top. The next wave down will have to start with five waves—across all US indices. So to get to the point where that can happen, the indices all need a “fresh start”—in other words, a new high.
The key, as I preach over and over again, is to watch the entire market, certainly indices that are related to each other. Both the SPX and DOW are subsets of the NYSE. They move more or less together. The wave structures have to be correct in order for the next wave down to start.
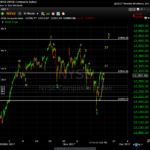
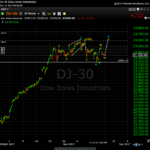
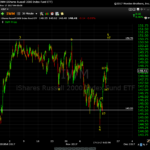
In all US indices (and USD currencies), we appear to have one more small wave up to go—ending in a major turn of just about everything associated with the US dollar.
| UPDATE: Other US Major Indices (click charts below to expand) | |||
|---|---|---|---|
 |
 |
 |
 |
| NYSE | DOW | Russell 2000 | Russell 3000 |
______________________________
The Market This Week
Here's the latest daily chart of ES (emini futures)
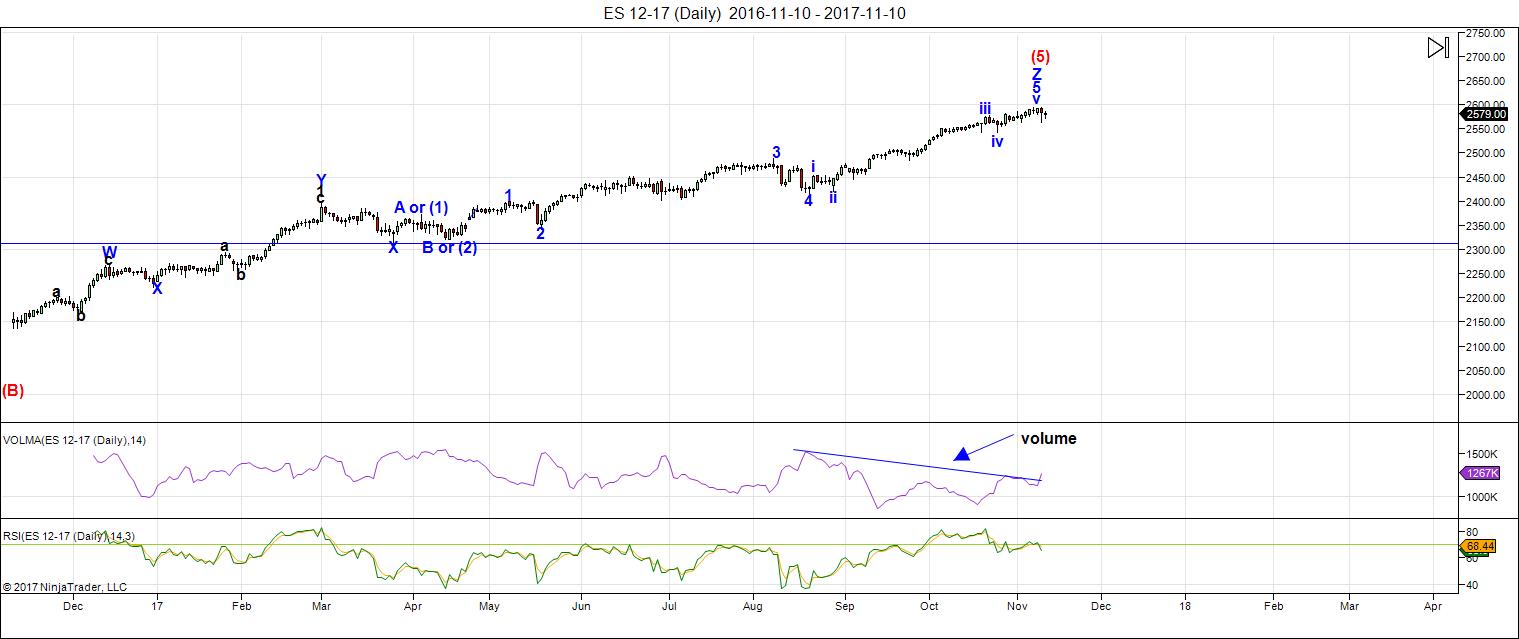
Above is the daily chart of ES (click to enlarge, as with any of my charts).
There have been no material changes to my prognosis. We are at the high. I expect this final wave to breach the previous high for the final time.
We're now down to hourly charts for all the action. It's been a day trading environment for the past few months.
Volume: Volume is expanding slightly as it does in a final wave to a top. RSI is already heading south, as we'd expect.
Summary: The count is full for NQ and ES, except for small subwaves that form the balance of a small fifth wave to the top. This final 5th wave up has to reach a new high, along with the rest of the major US indices ... and we're done. I'm looking at 2600 in ES as the potential final high (although the final wave could extend or compress)
___________________________
Trader's Gold Subscribers get a comprehensive view of the market, including hourly (and even smaller timeframes, when appropriate) on a daily basis. They also receive updates through the comments area. I provide only the daily timeframe for the free blog, as a "snapshot" of where the market currently trades and the next move on a weekly basis.
______________________________________
Sign up for: The Chart Show (**cancelled this week)
Next Date: Thursday, November 30 at 1:00 pm EST (US market time)

The Chart Show is a one hour webinar in which Peter Temple provides the Elliott Wave analysis in real time for the US market, gold, silver, oil, major USD currency pairs, and more. You won't find a more accurate or comprehensive market prediction anywhere for this price.
Get caught up on the market from an Elliott Wave perspective. You’ll also get Andy Pancholi cycle turn dates for the SP500 for the balance of the current month. There’ll be a Q&A session during and at the end of the webinar and the possibility (depending on time) of taking requests.
All registrants will receive the video playback of the webinar, so even if you miss it, you’ll be sent the full video replay within about an hour of its conclusion. For more information and to sign up, click here.



I seem to be having intermittent outages on my site this afternoon. Hopefully, it will resolve itself shortly.
Looks good from here!
Great read.. We have already started prepping.
i must “protest” MOST strongly – i DO see indexes other than the ES/SPX…… I see the Russell Futures too!!!
and speaking of the ES……………. we left off on friday with the following……..
https://invst.ly/5vvao
Since we’re now in ES wave 4 at 2575.75, and we can’t overlap with wave 1 (top at 2571.5), it looks like a nice entry point to be bullish for a very short ride up. Will be a very interesting week ahead!
Thanks for the great article (again) Peter!!
Peter,
In your “navigating the crash”, do you list recommendations for ideas that are not market related? Like owning gold, silver, barter items, food, etc..? Thanks for all your help.
Jeff T
The original is here: https://worldcyclesinstitute.com/navigating-the-crash/
The answer is yes.
Well ES just cancelled out this as being a W(4) of 5. I am only tracking 2 counts. 1 was just invalidated. I have no idea what this could be other then the leading diagonal and the last pop was a W(2) and W(3) has started to the downside.
Any thoughts Luri?
Unless that was just a W(2) if that is the case YIKES! 2623 for W(3)
ES 2555 and under and I will be comfortable the turn is finally here..
Big triangle with double combination for wave a. Wave c underway…
What is your target for W(C)?
If correct, we remain above the wave a low, back up for d, a higher low for e, then the final move up out of the triangle for a fifth wave swan song. I will be executing the biggest ball put credit spread of my trading life on e down and buying back short puts on the very first new high tick. I think the reversal after the wave up is going to be very sharp, and would not be at all surprised if it came during Thanksgiving break. We are very close people…I LOVE triangles!!!
Well folk, there you have it. I’ll be seeing ya around. Best success to all!
jody,
failed 5th as i have shown since friday………… a failed 5th would line up with the cash markets that have played out the unicorn leading diagonal, followed by a deep 2nd retrace……………
an alt count , is this still part of the previous wave 4 correction……….
https://invst.ly/5vw98
So the issue I have with that is if it is a big 4 then this C leg will run 100 or 1.618% of the A leg and if that happens it will throw the whole look off. I think we might have a unicorn on our hands..
jody, w2 option is ruled out, as that would make w3 the smallest wave….
https://invst.ly/5vwak
my top count, 5th failure [ in with a ‘bang’ on 3/6/9, out with a whimper on friday]
alt count, that this is still part of the 4th….https://invst.ly/5vwc5
anything below 2540’ish,,,,,,and this count starts to look REAL ugly – sorta “horsey face” with lipstick….
the speed/velocity of price decline will let us know if we are still in w4 or if we are ‘put a fork in it’…….DONE
here is a look at another type of 4th wave….. one that goes to 2520’ish
https://invst.ly/5vwee
and finally,
the “verne” triangle for a 4th………….
https://invst.ly/5vwfm
again…..we will KNOW based on price decline combined with the speed of the decline………. whether we are in “consolidation” of w4 of some kind, or we are DONE……………….. let’s be safe out there!!!
In SPX I had the a wave as the multiple and since in a triangle there can be only one, b through. e have to be simple zig zags. If they are not it is something else. Leading expanding diagonal perhaps? Not sure…
verne,
consider that the spx, had an ED, then a leading diagonal, then a deep retrace…..so w1,w2 to downside…..
the ES was on a different count, and has “POTENTIALLY” caught up….it had a w4 [which coincided with the spx w1 leading diagonal]…..ES had a w5 [coinciding with w2 of spx].
now the two have caught up in the count, with the w5 failure in the ES.
https://invst.ly/5w0di
BOTH es/spx are @ or finishing w2 to the downside…… we shall know in short order because either we have w3 or have NOT w3 to the downside……we will know….
be open to the potential that the top is in…….
I am. Curious about lack of downside momentum out of potential ED typically seen.
I signed up as a member and tried to access the 2-week free trial but no success. Even after I signed up I haven’t received any emails either. Are you having problems with your sign up process or is this just a temporary glitch. Tia
Clark,
You should have received an opt-in email that needs to be clicked on the confirm the subscription. I’ll go check it out and get back to you. Something obviously happened, but I’m never alerted unless the confirmation goes through. I’ll get back to you on your personal email.
Thank you Peter!
Thanks for the post peter! “USD currencies appear to have one more small wave up to go”, does that mean one small wave of weaker USD with eurusd to 1.21, audusd to 0.81 and gbpusd to 1.36?
Hi Chris,
This info is part of my Trader’s Gold service.
Ok no problem.. I merely meant that it was unclear how you worded it, “USD currencies one more small wave up”, if that meant up or down for the USD. I assume down, weaker USD, based on your recent posts, but one never knows! Am just trying to evaluate your analysis (and the evolution of your analysis) over several weeks or so 🙂
Chris,
You could just take the trial for a couple of weeks. I don’t post very much of my analysis in the free blog area.
yes, thats a good point, thank you!
jody,
we should know if the “primary” count is the correct one…… by the action of w2…. also, those pink vertical lines from the “apex” of the two wedges will be helpful.
https://invst.ly/5v-e4
there IS one more alternative……..of the unicorn variety…….lest i be beheaded for mentioning it……………..
an ED of the “expanding” variety………https://invst.ly/5v-m-
Thx Luri…
Weird that SPX still looks like a proper 5 count underway and ES looks like something else.
IKR!
“Bullish” five wave count to the top: https://invst.ly/5w26k
Bearish Alt Account (Much Larger Wave 4) https://invst.ly/5w28e
Is the bias becoming bullish this week ?
My my how some laughed last week when
I labeled the weekly chart 🙂
2632 seems reasonable on spx yet there are higher targets
but what do I know lol
🙂
Verne , no need for me to see your trades . Every trade once complete
Is history . Also you noted thanksgiving weekend .
My Dec 1 date is not that far away .
Sticking to my dates , Dec 1 Dec 13 14 th and Jan 2 .
Also standing by my ” topping process “
You are probably right my friend. I am trading as if we will indeed get a thrust (already underway?) out of some kind of triangle. So far so good. I now just need to time the buy-back of my short puts. No way I am keeping ’em through the week-end. lol!
I must say though Joe, if those gaps just above remain open, I will be revisiting that bullish thesis. If not closed by session end, I will be buying back my short SPY 258 puts…can’t be too careful you know… 🙂
Joe. Look for a email later on today.
We just hit resistance. It might not hold we shall see.
I have no problem posting my trades.
I just picked up 350 shares of UVXY @ $14.76 and have a stop loss @ 14.49
Sold 100 Dec 15 UVXY 10/12 bull put credit spread. Willing to take share assignment at 12.00 if below Dec 15…0.27 per contract
Hi Judy, the Dec 1 calls are bid at o.82. Selling covered calls another option to cushion your long position. Not telling you what to do but that has worked well for me when I did not want to get stopped out…we’re SOOO close!!!!!!
UVXY move back above 15.72 and it’s time to ROCK!
If SPX gets above 2583.30 I will sell out before I get stopped out..
VIX surrender of 200 d ma suggests a new 52 week low likely. Bearish engulfing candle today. Finding support at 10.50 so far….
Looks like your stop got triggered Jodi…
I am still in. Kept it @ UVXY $14.49 stop loss
Holding 350 shares of UVXY overnight with stop loss still in place @ $14.49.
Would love to hear any Bulls overnight position.
Oops! Forgot to mention that bid is for 15.00 strike so if called away you still do OK… 🙂
/ES charts doesn’t look right for me to be bullish. Stepping away.
Often the wisest choice…!
Zig Zag for c needs a small c down to complete I think…
Congratulations to all BULLS. The bears are getting frustrated, as you can read on many blogs by lashing out at the bulls for blowing up their own accounts. When ever you see the vetting by the bears, you know we will soon see new highs.
By Mark Hulbert
That’s the conclusion contrarians have reached after watching market timers react to the U.S. stock market’s pullback this week. Rather than remain stubbornly bullish, which is the hallmark of a major top, many of those timers quickly ran for the exits.
Contrarians have been waiting for a pullback to get a more accurate read of market sentiment. That’s because it’s harder to get a read when the stock market is successively hitting new highs, as it has done in recent months. During happy times, many will pay lip service to being bullish but not really mean it. The only way to know for sure is to see how they react when the market stumbles.
Now we know.
Consider the average recommended stock market exposure level among a subset of short-term market timers I monitor (as measured by the Hulbert Stock Newsletter Sentiment Index). This average currently stands at 44.1%, down from a high of 60.1% as recently as the end of October. That’s a strikingly large drop in bullishness, given that the Dow Jones Industrial Average DJIA, +0.39% is less than a half a percent lower today than at the end of last month.
Even starker is the drop in bullishness among stock market timers who focus on the Nasdaq stock market (as measured by the Hulbert Nasdaq Newsletter Sentiment Index). Their average exposure level now stands at 38.2%, half of its high level in October of 78.5%, even though the Nasdaq Composite Index COMP, +0.13% today is higher than where it stood when the Nasdaq timers were twice as bullish. (See accompanying chart, below.)
Assuming the future is like the past, the timers’ recent behavior is nothing like what we would be seeing if the market’s recent highs marked the all-time high of the bull market. At least from a contrarian perspective, therefore, the bull market’s final top is most likely still ahead of us.
To get an idea of when that top will be happening, pay close attention to how the timers react to market weakness. If they remain stubbornly bullish, then contrarians will suggest that we run for the hills.
To appreciate what stubbornly held bullishness looks like, consider how the Nasdaq-oriented timers responded in early 2000 to the internet bubble’s bursting. In just the first two weeks of that bubble’s deflation, the Nasdaq Composite fell by enough to satisfy the semi-official definition of a correction — more than 10%. And, yet, the Nasdaq-focused market timers treated it as a buying opportunity rather than as a reason to run scared. The HNNSI actually jumped by more than 30 percentage points over those two weeks.
That’s stubbornly held bullishness, and we all know what happened next.
For now, though, the average market timer is more eager to run for the exits than he is to remain stubbornly bullish. And that gives the bull market a continued lease on life.
By the way, this is the same conclusion contrarians reached in mid-September, the last time I devoted a column to stock market sentiment. The S&P 500 Index SPX, +0.19% has gained 4.5% since that column was published.
This move down if part of larger triangle should end just above a low…followed by d up…so far so good…
As the SPX puts in an outside reversal long red engulfing 30min candle that closed below the uptrend line from last Wed&Thursday… lol
Any move below 2557.45, by even a whisker, and I am buying back short puts…
Sounds good..
But what I want to know is what are these Bulls holding over night tonight??
Anyone??
I remain long on my long term account, which I do not trade.
As for my short term account, I am in cash after a today’s run up. From my past experience, the market may give back a few points after such a strong run up before heading up thru the 2600 es level. Plus I have a conference here in Vancouver I need to attend to, No trading for me this week after today. Best of luck to you Jody.
Often run ups ahead of OpEx are retraced. I expect that to be a leg down in the possible triangle.
https://www.youtube.com/watch?v=prRvGoodsa4
/www.armstrongeconomics.com/markets-by-sector/agriculture/the-approaching-famine/
I would highly suggest you read this article on the coming famine. I realize we all get fixated with the short time horizon playing the es, qqq ect. As mentioned earlier by both Joe and I, think in a longer linear time line for your investments. I personally will be dollar cost averaging into the agriculture area early in the new year. Its only a suggestion. Diversify.
the last spike = an ED [ending diagonal]……
shout out to ted……..
https://invst.ly/5wczf
peter has “insisted” that the last move of the uptrend will end in an “ending diagonal” – sometimes undeservedly to great ridicule….
i am happy to say – that it seems that peter will be proven correct! “peter” – much respect – great respect old boy!!!
https://invst.ly/5wdpa
I am still seeing a triangle with a complete d wave and one more wave down to go before a final thrust upwards. I will be attempting to scalp the final move up with short term calls on any move below 2577 in anticipation of the completion of wave e…these things are so typical of fourth waves it almost seems like a text-book finale…if this is right, the final move up is going to witness a brutal reversal, and anyone attempting to get comfortably long as suggested by a few wave counts I have seen, is probably going to experience some serious face-ripping unfortunately….
Triangles have as their purpose, a using up of time with meandering sideways movement and I was expecting this one to continue right into the holiday break. I would not be at all surprised to see this continue for the entire session today, with the possible break upwards coming toward the close tomorrow, like a honey trap for flies…
verne,
ending diagonals are triangles in shape, and do waste time….looking at the ES and the price move this morning…..how do you possibly”see” a w4 triangle ???
https://invst.ly/5weg8
verne,
i am seeing a very “exhausted” market, that will “squeak” a new high in an ED, and rightfully this should be the way the trend changes, with the perfect ED, that fails to break 2600…… :-)) …… we shall see……https://invst.ly/5wekc
hmmm……so verne, the ES has now hit the ED w3 target and is reversing?? help me see your triangle…….
https://invst.ly/5wesu
My! My! I am indeed going to get another opportunity to pick up a few hundred VIX 10.00 strike calls with VIX under ten once more. I am not going to get a visit from the SEC am I??! 😀
Triangle getting awfully close to being invalidated…interesting…!
Hi luri. My possible d wave has moved too high. Triagle kaput!
I will be hsppily buying back SPY 258 short puts of spread at the open…
Rocket engines firing today
Yippee! Buying back puts for a quarter of sale price. More than enough to be very nicely positioned courtesy of “da house”! 🙂
Sometimes i wonder how a market crash is even possible with these feeble attempts by the bears.
Verne
You should be able to look up the maximum contracts you can own
Before getting yourself into any regulation issues .
I know many years ago the limit was 300 on the oex .
It’s been a while since I’ve checked .
Joe
Thanks Joe. Some traders I know had them come snooping around after some big profitable trades we made asking about “inside information”. I was nervous since I was part of the posse but never got a visit. They had to show their charts and set-up triggers to prove they were trading based on TA and NOT inside info. OK. Now I spilled the beans about why I am so open about my trades…a nice paper trail! 🙂
Yep. Above a certain limit you gotta do more paperwork…man I HATE paperwork!!
I am assuming I had an incorrect triangle label. The thrust up was very predictable. I love ’em!
Buying Dec 13 10.00 strike calls for 1.60, 1/4 full position… 🙂
I really thought this ramp would come tomorrow…why the rush?! 🙂 🙂
Next on the agenda should be a close of this morning’s gap. Divergences abound!!
Call me crazy if you want to, but I swear it is almost like we’ve got algos front-running some of these wave formations. It really is quite amazing what has been happening..
Maybe it was a great big ED! And I am not talkin’ bout DYSFUNCTION! 🙂
Trying to pick up scecond tranche for 1.40 but no bites…yet!
Verne
Minor wave 3
Your probably safe yet here is what I found with quick search
http://www.cboe.com/products/vix-index-volatility/vix-options-and-futures/vix-options/vix-options-specs
Thanks Joe! 🙂
I have to say though, the all look like three wave moves to me…
Yep. I have seen a minor three count. In fact one I have seen has us in only minute one of minor three. We should get a 62% retracement either way….
If that gap gets filled today there is going to be a lot of turkeys on the plate this Thanksgiving…! 🙂
Spread on VIX 10.00 strike calls just got wider. OK, who else is bidding on my calls?! 😀
Raising my bid to 1.50. Spread at 155/175
New ath a no-brainier for DJI. What about DJT?
On closer inspection if we are in a minor wave up, I think it would be minor of a fifth….
https://invst.ly/5wh92
I like it! 🙂
Filled on second tranche at 1.50. Spread at 1.40/1.70
Third tranche bid at 1.30 GTC…
Is the market open tomorrow?
Multiple simultaneous exhaustion gaps?! (not DJT)
half day trading for cash market – futures open………
https://invst.ly/5whmo
Aha! Now I get it…! 🙂
VIX has not tagged lower B band yet. Holding last quarter just in case it does…
They clearly are not interested in selling me any more 10.00 strike VIX calls. Spread on them is now 1.55/2.20. How the hell do they get away with this crap?! 🙁
Maybe I’ll just get the 10.50 strike at 1.20/1.55…really ticks me off!
the RUT futures made a new and final high!
this IS the “last spike”………………………. BE WARNED!!
https://invst.ly/5wipu
Be warned Luri. More highs to come. Lol
It is entirely understandable why people loose reason in this economic bizarro world, created by central banks that we live in. I saw a recent statistic that really made me smile when I hear all the giddy talk about the “healthy” economy. Consumer debt has recently spiked higher, yet strangely enough there has been no commensurate increase in consumer spending. The implications are ominous. It looks to me like consumers are now going into debt just to be able to acquire life’s bare necessities!
On the market front. I am looking at a chart of DJI and what am I seeing?
Volume: Divergence
RSI: Divergence
Stochastics: Divergence
MACD: Divergence
Momentum: Divergence
On Balance Volume: Divergence
You get the picture.
Oh I know, I know. There are some who will argue that the usual technical indicators are no longer applicable in this brave new world, and that markets are going to the moon, no…make that Uranus!
Just because the whole world is becoming irrational, that does that mean that you have to…
As the poet says, “if you can keep you head, when all about you”…well, you know the rest! 🙂
BTW, negative divergence, many of which have been in effect for some time already, are not starting to show up on longer time frames as well, but don’t worry…we are gong to the moon! No…..URANUS!!! 🙂 🙂 🙂
Joe, sent you some info.
I am personally looking for 2620 es level on the next up leg. Hopefully by this Friday.
Mr Market, always has a way to humble the arrogance and ignorant traders
Good luck Bulls and every one else.
If we do get to the 2620 es level, I will be selling off some longs from my LONG NON TRADING account.
Historically, S&P 500 in the fourth quarter has ended higher 81% of the time with an avg. gain of 4.3%. The day before Thanksgiving is up 78.5% of the time and the day after is up 73.8%. The Monday following Thanksgiving, is only up 38.5% of the time and falls an avg. of 0.32%.
When a market advance becomes increasingly focused in fewer and fewer stocks, and this is what declining market breadth and all those Hindenburg Observations have been clearly telling us, the bears don’t have to do anything. The market eventually collapses under its own bloated torpidity. This is something people who are correctly bearish do not understand. They keep trying to short the market, and for all the right reasons, as opposed to waiting patiently for the inevitable!
I have decided to not waste another breath belaboring what should be clearly obvious to the most obtuse…but I do understand your frustration. What to do? Simply wait for the inevitable!!
When will it happen?
Don’t know for certain, but I think we are close, possibly weeks, but certainly no more than mere months. 🙂
No frustration on my part Verne
Waiting patiently is a strategy just like any other .
The technical back drop matters as much today as in the past .
There is nothing new under the sun 🙂
Spx / vix is worth a look .
I use a combination spx/ ( vxo+vix )
It still applies as does margin debt , the 10 day advance decline line
The 10 day trin as well as the 5 day trin sum .
Those divergences you mentioned ? They matter as well.
For me though it’s the wave count and time .
Verne you may consider setting up a second trading account .
My guess is you got played for a few pennies
Setting up a second account can help alleviate that by
Spreading trades accros both accounts
Sorry Joe that post was meant for Qwertyqwer26.
I thought I had replied to his message but it ended up in a strange place…lol! 🙂
I have three. One long term for trades intended for over a year horizon.
One medium term for trades six months or more, and one short term for more active trading, of late primarily scalping as even swing trades in a market that rarely corrects is tough. I have had a lot more success targeting weak sectors and the weak stocks in them for mid term swing trades. Great advice to have more than one account though! 🙂
Oh
It’s not just Uranus 🙂
It’s mercury Venus the sun and mars and Uranus
The moon comes after !
Equals —-> Euphoria !
JPMorgan Might Enter Bitcoin Trading Market
JPMorgan (JPM) wants in on the bitcoin-futures market that CME Group hopes to set up by the end of the year, sources told the Wall Street Journal Tuesday.
JPMorgan could potentially give its clients access to the market through its futures-brokerage unit, allowing them to bet on the rise or fall of the popular cryptocurrency.
JPMorgan CEO Jamie Dimon has been publicly critical of the viability of bitcoin, but its growing popularity is undeniable.
oh … bubblecoin. JPMorgan and sparkly things. No surprise there.
987*.25=246.75
610*.25=152.5
377*.25=94.25
233*.25=58.25
144*.25=36
89*.25=22.25
55*.25=13.75
34*.25=8.5
21*.25=5.25
13*.25=3.25
8*.25=2
5*.25=1.25
3*.25=.75
2*.25=.5
1*.25=.25
Future thoughts , playing with numbers .
365*.25=91.25
610/12=50.833
377/12=31.416
233/12=19.416
144/12=12
89/12=7.416
55/12=4.583
34/12=2.833
21/12=1.75
13/12=1.083
8/12=.66
5/12=.4166
3/12=.25
—————–
610/52=11.73
377/52=7.25
233/52=4.48
144/52=2.769
89/52=1.711
55/52=1.057
34/52=.6538
21/52=.4038
13/52=.25
8/52=.1538
5/52=.0961
3/52=.057
2/52=.3846
987/52=18.98
Joe,
What do all the numbers from the last 3 posts mean? What is the takeaway and reason for the post?
Fib sequences Ed…
This website is for educational purposes relating to Elliott Wave, natural cycles, and the Quantum Revolution (Great Awakening). I welcome questions or comments about any of these subjects. Due to a heavy schedule, I may not have the time to answer questions that relate to my area of expertise.
I reserve the right to remove any comment that is deemed negative, is unhelpful, or off-topic. Such comments may be removed.
Want to comment? You need to be logged in to comment. You can register here.