
 Ralph Nelson Elliott’s Work
Ralph Elliott’s ground-breaking book, Nature’s Law — The Secret of the Universe, was published on June 10, 1946. He died less than two years later, on January 15, 1948. He has been in ill health for over twenty years, an affliction that struck a couple of years before the 1929 stock market crash.
In 1932, having lost a large amount of his own money in the crash, at the age of 64, he was forced to turn to a new profession; he became intensely interested in the stock market.
What’s remarkable about his work is that he undertook it without computers and, in fact, had to invent his own ruler, called a “proportional divider,” the fulcrum of which could be moved to measure a 61.8% (the fibonacci “golden mean”) wavelength at various degrees of trend (as the market traces out the same patterns over and over again in a fractal manner).
Even at this early stage, Elliott was able to predict market moves with astounding accuracy and became somewhat of a sensation among a relatively small contingent of wall street brokers, most notably Charles Collins and Hamilton Bolton. Both had written books on various aspects of the stock market during the 1930s.
It takes some time to get comfortable with the quite unbelievable accuracy of this method in determining market moves. It took me about five years to master (I’m continually finding new subtleties within it), which included an intense study of the market during that period (over 20,000 hours). It has taken a bit longer to feel totally comfortable with its reliability; it takes time to buy into the fact that it simply never fails to follow Elliott’s rules.
If it fails for some reason, it’s the analyst who’s at fault, in my experience. Typically, the analyst allows some level of bias to get into their analysis and this results often in missing key measurements, or simply not delving deeply enough into the wave pattern.
In my work, I’ve discovered errors in the Elliott Wave Principle book and refined some of the rules, discounted others, to develop a system that seems to me to be almost infallible. The small number of errors I make have always been due to my own lack of discipline.
The Elliott Wave Principle has proven to me to be astounding in its accuracy and reliability.
Impulsive (Motive) Waves are Quite Rare
Thanks to the work of Ralph Nelson Elliott in figuring out how the market moves, we know that ending waves are always in five waves. Final waves of a trend can either be a motive five pattern, an ending diagonal, or a triangle of five waves. Those are the only choices; the final wave must be a fifth wave and it must consist of five sub-waves.
The other place to find them, of course, is in a trending market. At the present time, we’re in a countertrend wave (a fourth wave). Trending waves in a five wave pattern are waves 1, 3, and 5.
So, impulsive (motive) waves are unique patterns that are actually quite rare. While instances of these waves on occasion can look quite different than what you might expect, they must conform to a specific set of rules:
- (X) An impulse always subdivides into five waves.
- (X) Wave 1 always subdivides into an impulse.
- (X) Wave 3 always subdivides into an impulse.
- (X) Wave 5 always subdivides into an impulse, or a diagonal triangle.
- Wave 2 always subdivides into a zigzag, flat, or combination.
- Wave 4 always subdivides into a zigzag, flat, triangle, or combination.
- Wave 2 never moves beyond the start of wave 1.
- Wave 3 always moves beyond the end of wave 1.
- Wave 3 is never the shortest wave.
- Wave 4 never moves beyond the end of wave 1.
- Never are waves 1, 3, and 5 all extended.
These rules cannot be broken. If you were to analyze the current wave up from Dec. 26, you’d find it breaks the first four rules, which are arguably, the most important.
As a final fifth wave must be in five waves, this cannot be that wave, nor can it be the first wave of a five wave pattern. It is clearly a corrective wave.
Below is a visual representation of a five wave motive pattern.
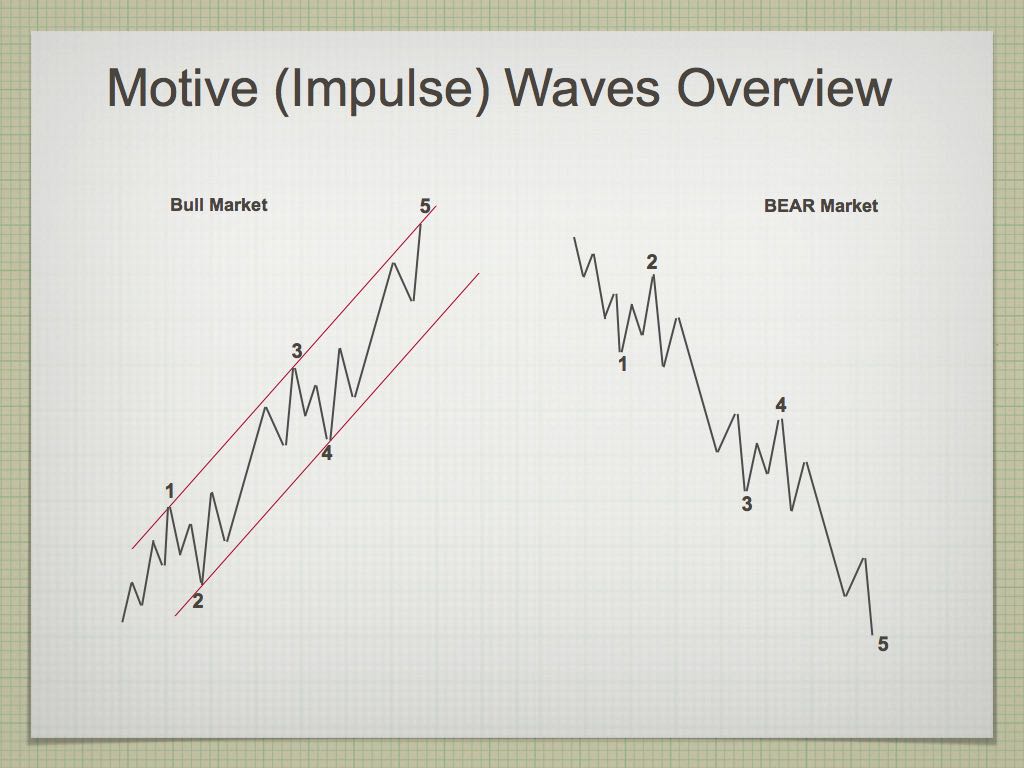
What’s as important as the actual “count” (five waves) is the look and measurement of the underlying wave structure.
Corrective waves (waves 2 and 4) must be balanced in terms of size, and all waves must conform to specific fibonacci-based wave lengths, in order to meat the “impulsive” wave test. What’s referred to as “the right look” is often ignored by many analysts, and the specifics on wave measurement are for the most part, undocumented:
- Wave 1 is measured as a length of one unit. Based upon this measurement, wave 3 will be either 1.618 or 2.618 times the wave 1 length. Wave 5 is usually 1.618 times wave 1 but, occasionally, can extend to 2.618 times wave 1.
- Wave 2 must retrace 62% of wave 1 and wave 4 must retrace 38% of the combined length of waves 1 through 3.
The current wave up from Dec. 26 doesn’t even come close to meeting these requirements.
So, when I continually run up against the skepticism that this system can’t possible work, I “get it.” Most people aren’t willing to put in the work to master this method of forecasting the market. Those who do know that’s it’s the most accurate method known. It’s very simply how the market moves.
_____________________________
Elliott Wave Basics
Here is a page dedicated to a relatively basic description of the Elliott Wave Principle. You’ll also find a link to the book by Bob Prechter and A. J. Frost.
____________________________
Registration for Commenting
Want to comment? You need to be logged in to comment. You can register here.
If you register, it protects your information. It also allows you to comment without filling in your information each time. Once you’re registered, simply go to the home page and click on the login link top right in order to log yourself in. Usually, you’ll be logged in for several days before needing to be logged in again.
______________________________
Problem receiving blog comment emails? Try whitelisting the address. More info.
______________________________
A true expert in Elliott Wave FL 2
A true expert in Elliott Wave …You are a true expert in EW analysis. What you provide is not available anywhere and is priceless. Subscription on your services is the best thing I have ever done. Many thanks for your effort to make me a better investor. I now have more trust in my investment decisions. I hope you will continue the excellent work! —FL |
The best of them JL 2
The best of them …Last couple of years, I subscribed to several ‘market traders’. You are by far the best of them and the personal contact is awesome. Daily and daily updates are very well written! Besides your expertise in EW, I also like your cycles analysis. Best investment I ever made! —JL |
Tops in your field DZ 2
Tops in your field …You are tops in your field. Tried to follow Elliot Wave international for years. They were always behind the market. After discovering you, I perceive that you are an expert in reading the waves, which puts you way ahead of the rest of your peers. And you can read the Waves like you are reading tomorrow’s financial section. I pray you stay healthy. —DZ |
Get an upper hand … JC 2
Get an upper hand in trading …Seeing all the different currency pairs and the wave structures and hearing you explain why this has to do that on a nightly bases gives one a upper hand when trading. Elliott Wave applies to all stock and indices and can be applied to any candlestick chart. If someone ask what you want for Christmas – Tell them a membership to Peter’s “Traders Gold!”—JC |
Couldn’t be happier … KK 2
Couldn’t be happier …The analysis and insight you provide is simply amazing! I’ve been trading the futures and equity markets for well over thirty years and usually average around 5% monthly. Since joining your Traders Gold Service two months ago, that number has better than doubled. I couldn’t be happier.—KK |
Rise above the rest … SM 2
Rise above the rest …I have only ever met a few people who, in their chosen fields (astrology, medicine, music, martial arts, technical analysis), rise above all the rest and you are one of them…you have ‘the gift’…and that’s why I’m a Trader’s Gold member. —SM |
the real deal SM 2
The real deal …‘Educational, insightful and thorough market analysis for all levels of traders. It’s Elliott Wave at its best….Peter Temple is the real deal’ —SM |
Have not had a losing week RW 2
Have not had a losing week …I have been with Peter almost a year. The only thing that matters is have I made money with his service. I think I have finally turned the corner using Peter’s EW. I have not had a losing week in the last 5 months. Thanks Peter, for your amazing amount of hard work. —RW |
US Market Snapshot (based on end-of-week wave structure)
Here's the latest daily chart of ES (emini futures)
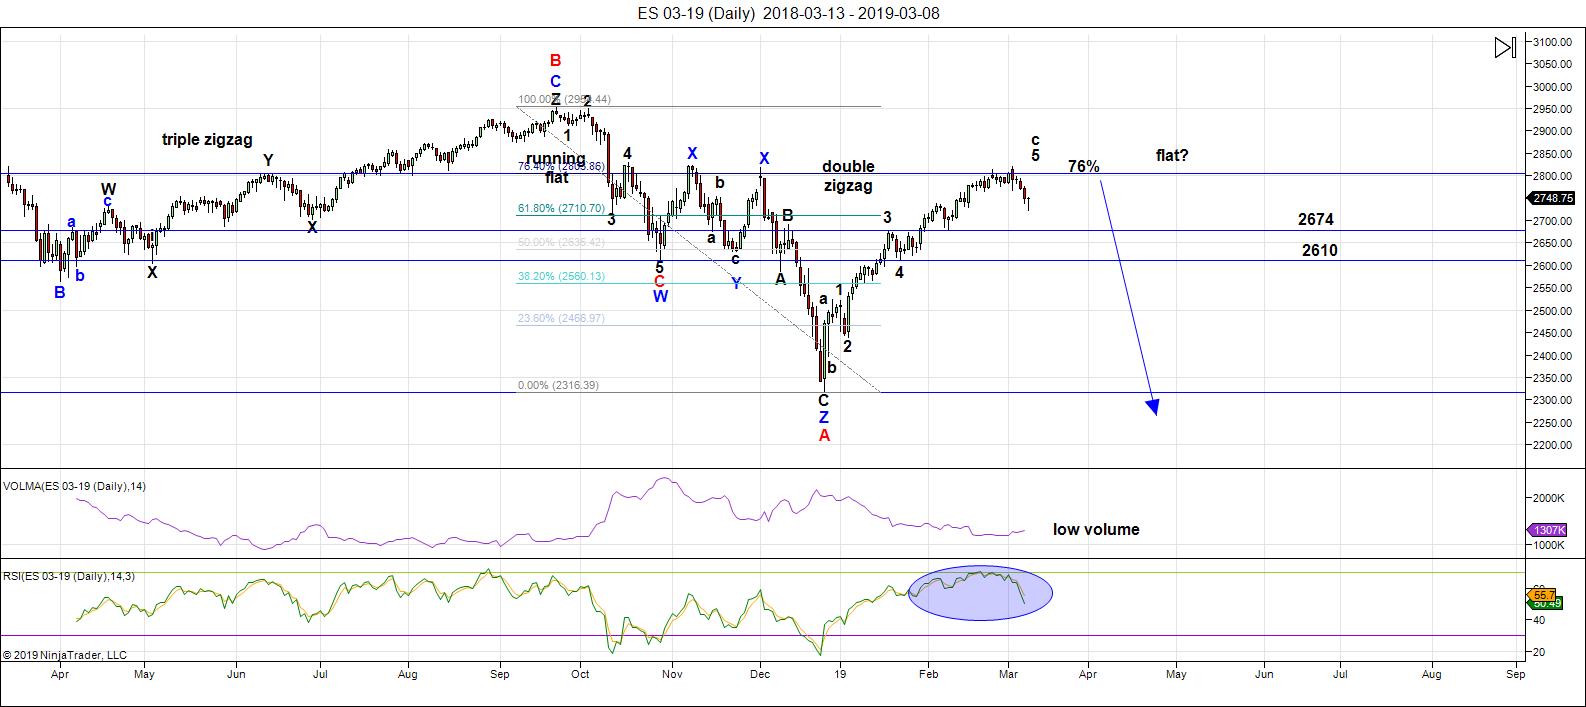
Above is the daily chart of ES (click to enlarge, as with any of my charts).
We're still sitting near the top of a B wave that's risen to about the 76% level of the height of the previous set of waves down from the all-time high on October 3, 2018. Almost all the other assets I cover on a daily basis are hovering at inflection points. The "greed factor" is at near an extreme; volume is at a low. It's past time to look for a turn down in a continuation of the larger fourth wave.
This week, we tracked a small fourth wave downturn that took the entire week, kicked off by a three wave move to the downside. The current move is not quite finished but I expect it to be on Monday morning. If we get a substantial move below 2717, something else may be happening.
Expect a move up from there to the previous high (around 2820) before the long-awaited turn down. The 76% usually contains a large corrective rally.
Because this "fourth wave" down took a week to play out, I'd expect this fifth wave up to take the same period of time. As a result, I'd be looking for a high either on Friday of this coming week, or the following Monday.
As I've been saying, the wave up from Dec. 26 is clearly corrective and, as a result, must fully retrace. This is supported by the US Dollar Index, the major USD currency pairs, WTI Oil, along with DAX and other international exchanges.
Summary: My preference is for a dramatic drop in a C wave to a new low that should begin this week. The culmination of this drop should mark the bottom of large fourth wave in progress since January 29, 2018 - over a full year of Hell. It may be a dramatic drop that lasts multiple months, and will target the previous fourth wave area somewhere under 2100.
Once we've completed the fourth wave down, we'll have a long climb to a final new high in a fifth wave.
___________________________
Trader's Gold Subscribers get a comprehensive view of the market, including hourly (and even smaller timeframes, when appropriate) on a daily basis. They also receive updates through the comments area. I provide only the daily timeframe for the free blog, as a "snapshot" of where the market currently trades and the next move on a weekly basis.
______________________________________
Sign up for: The Chart Show
Next Date: Wednesday, March 20 at 5:00 pm EST (US market time)

The Chart Show is a one hour webinar in which Peter Temple provides the Elliott Wave analysis in real time for the US market, gold, silver, oil, major USD currency pairs, and more. You won't find a more accurate or comprehensive market prediction anywhere for this price.
Get caught up on the market from an Elliott Wave perspective. There’ll be a Q&A session during and at the end of the webinar and the possibility (depending on time) of taking requests.
For more information and to sign up, click here.
| "I think you are the only Elliot Wave technician on the planet who knows what he's doing.” |
| m.d. (professional trader) |
All registrants will receive the video playback of the webinar, so even if you miss it, you’ll be sent the full video replay within about an hour of its conclusion.


Hi Peter and friends
the energy chart for this week is attached below
based on Andres comments about Monday being a low, high, low day and the 13th and Friday the 15th being a high day
I’ve done a little time shift on the chart which makes last weeks market moves fit much better than my original chart. We will see as this week progresses how well the time shift plays out. I did a time shift several weeks ago but didn’t mention it so this is not something new. Energy is very fluid and time (as we live it) is not, so adjustments in time (forward or backward) are sometimes necessary.
https://ibb.co/WGyyz91
don’t forget to press the GIF button
Andre
Your words just for a reference and a comment.
Sensitive degrees of the moon confirm we have 2 lows on monday. Logic dictates we need a high between 2 lows. I calculated the sensitive degrees also on the major turn years. In 1932 we had a neg degree around 13:00. This almost exactly the midpoint between 9:00 and 17:00. Anyway, 1932 confirms a high on Monday; the leg B up.
Ill look into the year 1932 and try to see what your saying.
March 14 mercury inf conjunction ? Farmers almanac
From what I understand about mercury :
Mercury conjunct sun should normally be a bullish day ( march 14 )
yet mercury is currently retrograde march 5th to the 25th .
The mid point being March 15 ( march 5 plus 10 days ) .
The historical norm for this typical mercury retrograde cycle is :
you look for markets to reverse trend from the mid point date .
March 14 mercury INF conjunct – Probable Low
Next date being april 5-10th Probable High
Peter T
Your words worth repeating :
THANK YOU
So, when I continually run up against the skepticism that this system can’t possible work, I “get it.” Most people aren’t willing to put in the work to master this method of forecasting the market. Those who do know that’s it’s the most accurate method known. It’s very simply how the market moves.
Peter, not sure if I am correct but is that chart from last week? Does it through the count off?
Thanks
Thanks, Charles
I guess I forgot to update it. It just takes a sec, so it’s correct now (not that there was a big change … lol).
Peter
Just a quick thought after I went through my daily and weekly charts .
Im not seeing enough oversold readings to label this decline so far
as anything that is close to complete .
Very short term signals showing minor oversold readings .
The mid march date is a typical low . March 14 merc inf conjunct.
Technically there is no way I can call this march 14 possible low date
based on indicators with todays readings .
this leaves the door open for a fair amount of points downward .
this is an if march 14 is a low and indicators are going to become oversold .
I see more downside risk . 24900 cash dow support probable .
Nothing more until march 14 – weekend following .
Thank you for your efforts and thank you for allowing me to post
Joe
Fascinating how the energy chart has a three wave look. Possibly heralding a final zig zag up of an ED?
Thanks Tom!
I am wondering about the designation of the move down last week as a small fourth.
It sure does appear to be bigger than the prior one higher degree fourth wave of C up.
What am I missing?
Gann’s Mass pressure on DJ is up into 9/15/19.
This confirms the high q3 2019. It also confirms what Merriman said (5-8 months up).
The countback sqr9 on 9/15/2019 gives 3/10 at 90 degrees and 3/17 on 45 degrees.
3/11 will be a high as 3/12 and 3/13. Mars (13 high) confirms Tom’s energy chart.
I have never seen such sharp futures divergence between ES and YM.
BA acconted for 30% of DJIA’s 2019 gains!
It will be interesting to see who follows whom…
Sold my SPY 273 calls for 4.20.
On the sidelines until I see how this inter market divergence resolves.
A nice pop..like we said..boo yeah!
Imma still long..targeting at least 2820 on spx.
March OpEx bullish. We could see even higher…
Spooked by DJIA gap down and left a LOT of money on the table…lol!
Has anyone ever seen simultaneous gaps in OPPOSITE directions by SPX and DJIA?!
I have never ever seen domething like that. Strange goings on…
Hi Everyone
The original energy chart (not time shifted)
appears to be playing out today
so I’m attaching it here for reference
https://ibb.co/JvM1hpq
Chart was spot on! Should have held those calls a bit longer lol!
Will reload if we close above 2770.00
Yeh..imma hanging tight in these calls..til at least 2820.
Flagging action pointing to much higher…selling big bull put credit spread at 274/275 three weeks out.
Will exit short call on close below 2750. Limit of 0.24 credit per spread.
Smart move..in the 5th wave now..needs a new high!
Massive spread. Keeping stops VERY tight. In fact I already bought back half my short puts.
Would be happy to get all long contracts at zero cost basis or close…
Buying back another 1/4 short puts. I do not trust this ramp one bit. All way too cute with that face-ripping gap reversal.
I think they are up to no good…lol!
Calls I bought his morning at $7..now over $30! Holding into close unless pullback.
Wow..cha ching!
Though closing in on 500% for the day.. limit order in at $36 for nice juicy 500% gain.
Didnt take..trying $34
Ok..hows $33?
They ripped me off..but got out at 32.90.. not a bad day!
In at 7.20..out at 32.90.. for 350% gain.
Haha! They do tend to do that don’t they?
Nice execution Sir Charles.
I sold the SPY 273 calls left over from my bear call credit spread too early but it was house money so can’t complain too much!
Yeah shouldve just taken the 4pm settlement price but hey it was only 40 pennies more. They r such crooks..snatchin my loot!
U hadda good day Mr Verne. Good job!
Why thank you Sir Charles. I do think we have yet more upside and will be waiting for a turn to buy back last 1/4 of short puts. If we keep going higher I will buy back at break- even and re-deploy spread at highet strikes. Here is hoping I have similar luck catching the top as I did the bottom!
Todays drop looking at the lesser weighted dow stocks vs the heavier weighted dow stocks .
Todays low in the heavier weighted stocks broke the feb 8th lows and tested the gap of jan 29th-30th . in doing so the heavier weighted dow stocks have come back to the previous 4th wave of 1 lesser degree .
The lesser weighted dow stocks however have not come back far enough to satisfy anything . The lesser weighted dow stocks have only just barily broken below the jan 2018 highs and now closed back above them again .
The march 14th date I have calling for a low may not work out and may indeed become a high yet it is to soon for me to change my mind on this .
Early april low against a march 14 high ?
I have doubts yet it is possible.
March 14th April 6 10th and may 26-27th into june 3rd key dates .
The late may early june period is the key and is an ideal LOW and end of
this bearish/sideways time period .
Still focused on the actual cash dow feb 8th lows as well as the jan 22 lows .
So far neither targets have been reached with the index itself
As many of you know, my own theory of market price action is that it is primarily central bank driven. When they are buying, and that includes stock buybacks, price goes up. When they are not, the market falls under its own weight. Every trader recognizes that there is virtually no selling pressure in this market. The nonexistent volume permits tbe kinds of freakish whipsaws so common these days. I also believe that CBs also employ substantial leverage when buying the market. The idea that retail investors are driving the kinds of intra-day swings we are seeing is beyond laughable. That notion is propaganda and makes very little sense when you consider the amount of money involved, and look at market volume. Any credible market analysjs has to demonstrate in my view, and ability to correctly predict, with some reasonable consistency, where orice is headed. This past week Peter T told us Friday’s low was a fouth wave and that implied a new market high. So far it seems that is where we are headed.
I know without a doubt that I persoally lack the skills to use EW effectively in any consistent way.
I knowe even less about lunar and astro cycles and the stuff the knowledgeable folk post on the subject for me is like trying to read a foreign language! Lol!
I have traded long enought however, to recognize CB buying and will make this prediction. The market will not head down unless and until they unwind LEVERAGED long posiions. We will know that is happening when we see an initial impulse down that smashes the 2700 level support/ resistance shelf. Above that level, shorting this market is a fool’s erreand imho. The smart thing to is patiently wait.
whipsaws
I agree whole..heartedly with u Mr Verne. My short entry point is below 50 day sma. IMHO i dont think we get there anytime soon..maybe this Fall..Till then imma buying stocks like theres no tomorrow. Bulls are still..well in control!
From the look of futures, Tom’s three wave move up this week seems to be playing out perfectly.
Somebody give the man a nicely aged Partagas!
Just for kicks, I will be throwing a few speculative SPY 275 strike calls expiring tomorrow at the pullback. I will post my entry price and try to catch the low of the dip by watching VIX and MAs on the 5 min chart.
Sir Charles? 😋
If we are indeed in a fifth wave up, unless it is a ZZ of an ED this pullback it seems to me would have to be counted as a second wave. If that is correct, we would still have a third wave up ahead. That would definitely take us past formidable resistance in the 2820-2850 price area…
I think..wave 1 of the 5th goes to 2950..then a 2nd wave pullback..
SPY 3/13 275 strike calls last traded for 3.82
I opened order to buy at limit price of 2.25 . Small position of just ten contracts to start. Will add to position if filled and we close above 2800.00 Stop a close below 2750.00
Let’s see how deep the dip…
One of the most important lessons I have learned from Peter T over the years is the importance of distinguishing corrective waves from motive (impulsive) ones. Even with my limited grasp of EW finer
points, I understand the importance of the fib relationships among the sub-waves of any wave designated as an impulsive wave. I have to say after listening to Peter stress this point over the years ad nauseam, I am completely stunned by how many would-be EW “experts” blithely slap impulsive labels on charts that are clearly no such thing, thus making their projection of price action complete hogwash. We have myriad examples of such B.S. in recent market price action. I feel sorry for folk trading those erroneous counts.
No fill on my SPY 275 strike order as price moved higher. Buying back last 1/4 of short puts of my bull put spread.
Will deploy another put spread two strikes higher if we close above 2800.
Either we get a violent leveraged move past 2800, which will signal the cabal is buying, or we head back to the 2700 area for another test of that shelf. Of course they could also do nothing and we simply drift sideways, as there are no sellers….!
Look alive people.
Shooting star on the boards.
We do not have a new high so they could be spoofing us.
I was about to deploy another 277/277 bull put spread and put on the breaks in a hurry.
Do we have a top?
It would be a failed fifth is last Friday’s low was a fourth wave.
SPLAT!
ES ran into a buzz saw on the move above 2800.
If we get a gap up or even a green VIX print I am grabbing a truck load of SPY 280 strike puts expiring manana! 😁
They are having trouble holding onto 2800 in ES.
No one is buying.
They are going to have to leverage it past resistance which would evidence in an intra-day gap higher. You just watch!
If that happens I will be shorting it…! 😁
Price coiling sideways ahead of a final spike higher methinks.
Trigger finger at the ready to short that puppy! Hehe!
I have added to my shorts @ 2800. Just being a little patient and hoping to see a small poke above 2820 to add the last 25%. It does seem like we will get another small down up sequence, but I don’t trade small time frames – so I will leave that for the more nimble traders. If we take out 2820-2840 zone with good momentum, I will stop out of my short trades for a small loss.
No thrust from the triangle today.
Perhaps tomorrow?
Or will the wily banksters take the plunge overnight?
Cheers!
Up..up..& away..to the moon & back. Imma long til imma not..hardy har ha!
No close above 2800, no Cigar!
I will make an exception for an Arturo Fuente Xtra Reserva Viejo! 🤗
Sun Conjunct Mercury Dates
29 January 2019
14 March 2019
21 May 2019
21 July 2019
03 September 2019
11 November 2019
10 January 2020
25 February 2020
Joe,
What is the implication of the sun being conjunction with Mercury? Any response would be appreciated!
Thanks for asking Ed. All those dates and info without some context and explanation of market implications I am afraid leaves mosf of us who are not experts in that area in the dark….so to speak. 😊;
Peter T
I think there is a 12 and 24 trade day cycle that has been in effect for a while now Based on this today was a high of importance and the downcycle accelerates.
Previous dates using a daily chart of the cash dow .
Today March 12 2019
Feb 22 2019 – 1 day Prior of print high and fairly close to print high considering.
Feb 5 2019- Closing high then 4 days negative.
Jan 17 2019- sideways mkt of 7 days followed ( general bullish sideways )
Dec 31 2018 – 1 day prior to print and close high- 2 days of neg followed .
Dec 12 2018 – Reversal day to downside 8 days of downside
Nov 23 2018 – Swing low before ( both dates about same price level )
Nov 23 2018 close price: 24,285.95 , March 12 2019 close : 25,554.6
Im now using todays print high as my ” Timed Based Stop ”
Jan 22 2019 Close – 24404.48 should be tested before any new highs come .
Same dates as above yet add 36 trade days , so 12 24 and 36 trade days point to point.
jan 17 2019 feb 5 2019 – 36 trade days low to high –
Feb 5 2019 – feb 22 2019 – High to higher high –
Feb 22 2019- March 12 – Higher high to Lower High —
I used a 240 minute chart for these 36 trade day dates .
If the mkt rally’s from here k by me , im just not seeing it
March 14 April 6-10th and then may 26-27—June 3rd .
Oil ????? a High ?
We Are now into the mercury retrograde mid point where mkt trends tend
to reverse . my observations have been to just add 10 days to the start and end dates. From the start of the period you look for a swing high or low and a trend
to move directionally from start date to mid point date ( plus 10 days )
When that mid point date is a high in stock prices , my observation has been this
is a rare event yet not so rare that it doesn’t come enough times to build some guides around it .
Example in theory yet I could put some data together and back up what im saying.
The move from the start date to the mid point date is typically a high to low .
The rarity is the mid point date being a high yet when it is you look for a strong
downtrend into 10 days following the end point date .
March 5 to march 25 mercury retrograde .
March 5 plus 10 days equal march 15 .
Mercury inf conj march 14
the 12 day 24 day 36 day dates .
My Thought’s are simple
The mkt is not oversold enough to technically make a bullish case .
Short term swings aside I think today was an important high .
The weekly dow chart needs decent pullback .
After the mkt finally becomes oversold ill change my bias
This may end up being more of a time gap of a few months with
a market that’s gone No Where .
March 25 Plus 10 days equals April 4 ( April 6th 10th included )
I’m Short 2 ym —
Going Quiet now ——— : ))
Last post on this :
More to research here because the mkt tanked —–
The April 4 … 6th-10th should be an important swing time period .
That’s the best I can do at this time .
Previous —-
Mercury goes direct at 9:22 pm UTC* on December 6 in Scorpio (27o16″). The Post-Shadow ends on December 24, 2018 at 11:26 am UTC*.
Dec 5 plus 10 days was Dec 15th -Mkt Bottomed 9-11 days later .
So this present observation as we move forward will help to define
what to expect with the others posted above .
Its about trying to definitively define an odd cycle in terms of short term
and medium term stock market cycle ( Social mood swings )
I can see many conflicting yet generally longer term bullish into aug 13th sept 3rd .
Note the mercury conjunt dates above . these are coincidences that my dates calculated one way pin points a specific planet . yet when it does I tend to attempt to define what it is doing historically and project that out from today.
Mercury is kind of but not entirely doing its norm .
Standing by my march 12th today date as a high based on this and other work.
short term those highs maybe tested yet must not be broken by a single tick or early a[ril becomes the next swing high . its 2-4 different cycles all wrapped up .
The larger cycle being Bullish .
February 19 to March 5 –The first shadow phase from Mercury entering the retrograde zone until Mercury stationary retrograde (16° to 29° Pisces).
March 5 to 28 – The Retrograde phase lasts from Mercury stationary retrograde until the Mercury direction station (29° to 16° Pisces)
March 28 to April 16 – The second shadow phase lasts from Mercury stationary direct until Mercury leaving the retrograde zone (16° to 29° Pisces).
ED
look up some of the up coming solar and lunar eclipse date
then add these to the mix and ask yourself if you see any correlations
Sun Conjunct Mercury Dates
29 January 2019
14 March 2019
21 May 2019
21 July 2019
03 September 2019
11 November 2019
10 January 2020
25 February 2020
Futures higher. At the open I will be deploying the SPY March 22 expiration 276/277 bul put credit spread. Based on Tom’s energy chart I expect to buy back short 277 puts no later than Friday. Will exit sbort puts on any close below 277. Here is hoping we head just a bit higher, Brexit or not! 😎
In hindsight, I sold my 273 strike calls way too early. I should have paid more attention to Peter’s call for a new high.
I really need a better method for determining reasonable price targets. It make all the difference in the world between good option trades, and great ones. Fib relationships have been unreliable of late and I am not sure why that is.
Filled on spread for 0.28 per contract.
Plan is to buy back back short 277 puts when I can hold 276 put as close as possible to zero cost basis.
No oppitunity to buy 275 calls at high enough reward to risk ratio so took a pass going outright long the market.
Not so bullish as Sir Charles. I still think wave up is corrective.
Buying back 1/4 277 puts on thrust from triangle. Next 1/4 if we move past 2810
As u know..imma long & lovin it like micky ds!
My SPX calls up 50%..in at $6…now over $9.
Now $11..ye haw..giddee on up. Bulls on parade!
Out atta $10.50 for 75% gain..boo yeh baby!
Nimble strikes my man!
I like your style!
Sticking with spreads for now but those calls I was eyeing would have paid some nice coin! 😀😀😀
Yeh Mr Verne took the 2800s for chump change @ open. Ride em up and raise stops @ 25% then 50% then 75% then 100%. Got up to 80% then out at 75%..works like a snake charmer most days. A lot of quick 25%ers but some days like Monday i hit it outta the park & dont sell until close or take daily settlement.
I am holding til 15th to see what happens..tempted to buy oil up. waiting to see move with gap in USO this am..
Tom C’s energy chart continues to rock!
Buying back another 1/4 of 277 short puts.
Will buy back remaining 1/4 on any move below 2800.
If we close above 2820, will hedge with sale of 278 strike puts and roll up remaining 1/4 to 278 strike.
BTW Sir Charles, I know you sometimes take grief for your views but I for one really appreciate the fact that you do put your money where your mouth is. Very few talkers do….very few indeed!!! 😊
Yes sir..Thank you Mr Verne..i wake up evryday & go long or short. Typically 1-5 day trades a day..and long term positional trades. I do pretty good with it.. use SIR PETER along with a few other EW analysts for macro view & use my trusty TA tools for the day yo day..if it aint broke dont fix it..this strategy gets her done!
It looks like we tested the 2820 mark on SP. If it closes above, does that change the count in any way?
Not sure what Peter T’s view is but for me it would be a heads up.
I would be personally inclined to view that development as auspicious for the immediate bullish case and change my upside target to around 2875.00
Thank you! It is right there, so we shall see shortly!
Close above 2820..means could go to at least 2880..this is def 5th wave now so how high she goes before she blows is the only remaining question!
Thanks Charles!
Ur welcome Mr King. If this is a flat..spx could retrace up to 90% which is where the 2880 comes from..just enough to entice peeps to let go of hard earned cap with expectation of new high. My cue to switch from bull to bear is drop below 50 day sma which right now is jus below 2700. FWIW imma only 25% long on my longer trend trades. Been locking in profit above 2800..playing wit house $ at this point with stops near 2700 level.
Accdg to Joe:
“From what I understand about mercury :
Mercury conjunct sun should normally be a bullish day ( march 14 )
yet mercury is currently retrograde march 5th to the 25th .
The mid point being March 15 ( march 5 plus 10 days ) .
The historical norm for this typical mercury retrograde cycle is :
you look for markets to reverse trend from the mid point date .”
Today is 3/13 and at a high. SPX shooting star. Similar to 12/12. Long puts after hours. Due your own due diligence.
Thanks for the explanation Liz. That really helps.
Came close to rolling up spreads but held off owing to sub 2820 close. Still short 1/4 of 277 short puts but will buy back if we close below 2800.00
latest updated energy chart attached below
https://ibb.co/CHLCYcn
Thanks Tom
Hi Tom, I haven’t seen you posting in a while. Hope everything is alright with you.
I emailed you but learned that your email address is not valid any more. Can you email using your mailing list so that they can have your current one?
Thank you so much!
Thank you for the chart show Peter..it really helps me confirm things on my charts…especially when the counts get reallllly confusing.. :))
thanx tom!
This website is for educational purposes relating to Elliott Wave, natural cycles, and the Quantum Revolution (Great Awakening). I welcome questions or comments about any of these subjects. Due to a heavy schedule, I may not have the time to answer questions that relate to my area of expertise.
I reserve the right to remove any comment that is deemed negative, is unhelpful, or off-topic. Such comments may be removed.
Want to comment? You need to be logged in to comment. You can register here.