
The turn is in.
The Summer Solstice was on June 21 (Wednesday of this past week). The Nasdaq topped on June 9. For my Trader’s Gold subscribers, I’d predicted a turn for ES/SPX on that day at 2446, which it hit (and I called the NQ top as it happened).
However, I also predicted one more top after that for ES/SPX (last weekend, in fact). I predicted that top for SPX at 2452, but I missed by two points, as it went up to almost 2454 before turning over. That was the final high on June 19.
This weekend, the SP500 is in the second wave of the fifth (of the larger fourth wave), with more downside to come, and the Nasdaq is at the top of the second wave (of the fourth). We may take the rest of the summer to finish the fourth wave.
The second wave of the current daily chart sequence took ten weeks to complete. I would give the fourth wave at least that amount of time to complete.
Andy Pancholi’s major turn date was on June 22. Note that we had secondary highs for both indices on June 23.
I decided to do a bit of research on the probabilities of a turn on the Summer Solstice. This is what I found out:
____________________
From Market Astrologer’s Blog
Of the past 53 years, the US stock market has turned 74% of the time at the Summer Solstice.
“We’ve been back-testing the last 53 times this event has happened, and have found that the Summer Solstice has previously triggered a trend reversal down roughly 44% of the time, a trend reversal up 30% of the time, and no trend reversal at all 26% of the time. (more on this on the Market Astrologer’s Blog).”
____________________
From Signal Trend (find more on this on their site)
Historical Summary: The 50 Year, 100 Year and 4 Year Record
| Spring / Fall Equinox Cycle – Compounded Returns. |
|
* These are not annual returns. They represent 6 month DJIA returns.
Analysis:
From 1950 through 2004, ALL of the stock markets annual gains are concentrated in November –
April. The average compounded return for the 55 Nov -April periods was 7.62%. The average
compounded return for the 55 May – Oct periods was – 0 .1%. Dividends were excluded.
From 1900 through 2004, 86% of the stock markets annual gains are concentrated in November –
April. The average compounded return for the 105 Nov -April periods was 4.27%. The average
compounded return for the 105 May – Oct periods was .68%. Dividends were excluded.
___________________
The Bottom Line on Summer Solstice
The US stock market usually turns on the Summer Solstice (74% of the time). The returns over the summer months historically are negative. All this fits with a turn down now and a fourth wave lasting through the summer.
______________________________
Rise above the rest … SM 2
Rise above the rest …I have only ever met a few people who, in their chosen fields (astrology, medicine, music, martial arts, technical analysis), rise above all the rest and you are one of them…you have ‘the gift’…and that’s why I’m a Trader’s Gold member. —SM |
the real deal SM 2
The real deal …‘Educational, insightful and thorough market analysis for all levels of traders. It’s Elliott Wave at its best….Peter Temple is the real deal’ —SM |
A true expert in Elliott Wave FL 2
A true expert in Elliott Wave …You are a true expert in EW analysis. What you provide is not available anywhere and is priceless. Subscription on your services is the best thing I have ever done. Many thanks for your effort to make me a better investor. I now have more trust in my investment decisions. I hope you will continue the excellent work! —FL |
Couldn’t be happier … KK 2
Couldn’t be happier …The analysis and insight you provide is simply amazing! I’ve been trading the futures and equity markets for well over thirty years and usually average around 5% monthly. Since joining your Traders Gold Service two months ago, that number has better than doubled. I couldn’t be happier.—KK |
Get an upper hand … JC 2
Get an upper hand in trading …Seeing all the different currency pairs and the wave structures and hearing you explain why this has to do that on a nightly bases gives one a upper hand when trading. Elliott Wave applies to all stock and indices and can be applied to any candlestick chart. If someone ask what you want for Christmas – Tell them a membership to Peter’s “Traders Gold!”—JC |
The best of them JL 2
The best of them …Last couple of years, I subscribed to several ‘market traders’. You are by far the best of them and the personal contact is awesome. Daily and daily updates are very well written! Besides your expertise in EW, I also like your cycles analysis. Best investment I ever made! —JL |
Have not had a losing week RW 2
Have not had a losing week …I have been with Peter almost a year. The only thing that matters is have I made money with his service. I think I have finally turned the corner using Peter’s EW. I have not had a losing week in the last 5 months. Thanks Peter, for your amazing amount of hard work. —RW |
Tops in your field DZ 2
Tops in your field …You are tops in your field. Tried to follow Elliot Wave international for years. They were always behind the market. After discovering you, I perceive that you are an expert in reading the waves, which puts you way ahead of the rest of your peers. And you can read the Waves like you are reading tomorrow’s financial section. I pray you stay healthy. —DZ |
The Market This Week
Here's the latest daily chart of ES (emini futures)
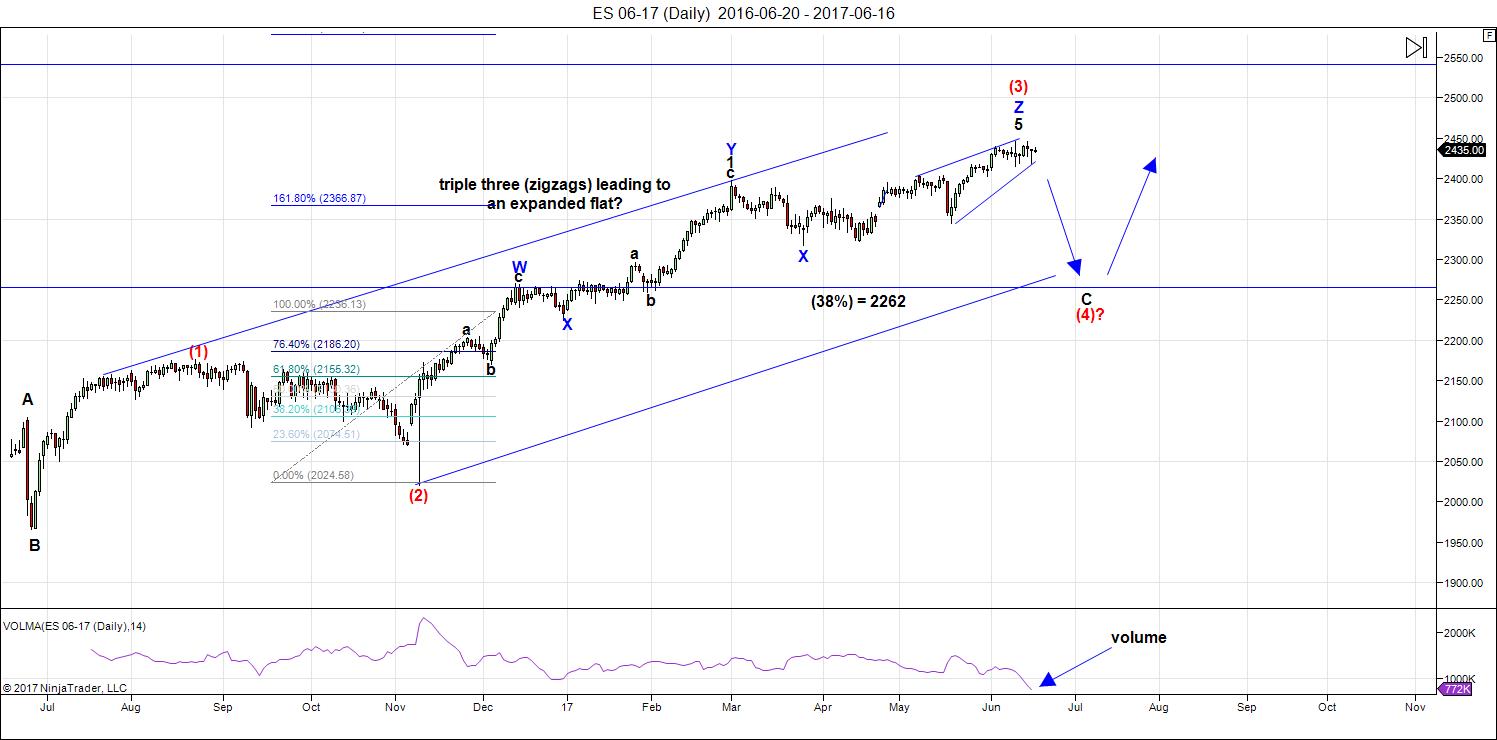
Above is the daily chart of ES (click to enlarge, as with any of my charts). The count has not changed. What appears to be a third zigzag of the third wave (you can only have three patterns within a corrective wave—this third pattern starts at blue X on the chart) continued slightly higher as predicted last week and continued to build a potential very large expanded flat at the top of the circle red third wave. This past week, we finished the topping process.
The USD currency pairs look like they've all turned, but the countertrend moves in some of them may not be a fun trade. My Trader's Gold group knows the ones to concentrate on.
Summary: We've completed the third wave in ES at the top of a possible expanded flat. NQ has also turned, but the configuration of the waves down should be different then ES. The first wave down in NQ appears to be the first leg of a zigzag.
Volume Head's Up: Look at the relative volume at the bottom of the above chart. At the ends of waves, the volume tends to drop to extremely low levels. We certainly have that happening at the top of this wave. Volume will pick up substantially as we start to move further down in the fourth wave.
After completing the larger fourth wave, we'll have one more wave to go, which could be an ending diagonal as a fifth wave. The long awaited bear market is getting closer.
______________________________________
Sign up for: The Chart Show
Wednesday, July 5 at 1:00 pm EST (US market time)

The Chart Show is a one hour webinar in which Peter Temple provides the Elliott Wave analysis in real time for the US market, gold, silver, oil, major USD currency pairs, and more. You won't find a more accurate or comprehensive market prediction anywhere for this price.
Get caught up on the market from an Elliott Wave perspective. You’ll also get Andy Pancholi cycle turn dates for the balance of the current month. There’ll be a Q&A session during and at the end of the webinar and the possibility (depending on time) of taking requests.
All registrants will receive the video playback of the webinar, so even if you miss it, you’ll be sent the full video replay within about an hour of its conclusion. For more information and to sign up, click here. NOTE: the weekday and time have changed - to Wednesdays.


Beautiful! 🙂
🙂
Thank you Peter. I really appreciate the effort you put into the posts.
🙂
There are still a few things about the way these markets are trading that is truly perplexing. NDX unfolds downward in a clearly impulsive wave, wiping out weeks of upward gains in just two days, and doing so on massive volume. A possible second wave now lasting two weeks after a trend change signaled by an impulse down lasting just two days is something I have never seen.
SPX also frankly remains a puzzle. There is nothing at all impulsive about its initial move down, and that is underscored by the fact that no impotant support levels have been taken out on the initial move down. I generally look for the third wave of an initial impulse down to confirm a trend change at this degree by taking out at least one well-defined support level. No wonder I have been totally confused by the recent price action. T he one clearly bearish sign was the exhaustion gap from Monday, but price has climbed back like a magnet toward the gap area and is sticking around, instead of characteristically falling away. It now remains to be seen if the HO is signaling the severity of the current decline, or pointing to what comes after the fifth wave up. If the decline continues to unfold as painstakingly as it has so far, it is going to take a very sharp fifth wave up to have the HO play out by the expected September date.
The more I look at the charts, the more it seems to me that I am missing something…it must be just me…
ES/SPX waves are impulsive so far; NQ is not, I don’t think (subwaves are hard to make out, sub I consider it for the moment to be a zigzag). Nonetheless, it doesn’t change the outcome.
What’s confusing to many is due to the fact that the larger sequence up is corrective. The final pattern up was an abc sequence leading to a top, not a five waver. That’s what makes it unusual.
Thanks Peter! It is really great to have an expert eye for these challenging markets. That’s what I get for missing this week’s chart show! ?
Peter,
In reference to NQ, is that the Nasdaq composite? Also, how would you describe the 4.1B volume on the Nasdaq of Friday? Still part to a zigzag?
Great post, thanks for your wisdom!!!
Never mind, got the answer above
A few tidbits from this week’s Barron’s regarding the Summer Solstice. The S&P 500 is up 8.9% this year, with 24 record highs. The maximum drawdown over these six months never exceeded 2.8%, making it the second smallest first-half drawdown in 89 years. Also, in the past 20 years, the VIX volatility index has closed lower than 10 on a total of 11 days; 7 of these were in the past month. (Surely we’re near a turning point).
One would think so, but this market keeps surprising. I was very certain the huge wave down in Nasdaq was the start of a major five wave impulse down. I now think it extremely unlikely that a second wave would last two weeks after a first wave lasted merely two days. If the Nasdaq has not topped, it makes for a very strange situation in the overall markets as that breakdown on massive volume June 9 would have been a false breakdown. A very possiibility when it comes to trying to gauge market signals and how reliable thsy still are.
Peter T,
So if I understand correctly you don’t expect any more ATH this week and probably we start our downward 4th wave journey.
On a different note, whats your thought on land/house prices in rapidly expanding places like Dallas. What are the major reason you would consider not buying one. 500 year cycles can be easily off by 5/10/50 years, so it could be waiting for a life time.
Thanks
Bill
Real Estate is on an 18.5 year cycle. Fairly well known. See my video on the site: https://worldcyclesinstitute.com/the-eighteen-year-real-estate-cycle/
The year 2000 was the bottom. I’ve expecting a top right about now.
The debt to household income in Canada is higher than it was in the US at the start of the great recession. Carney did a spectacular job of inflating the housing bubble up there, and the pop is going to be something…
Yup. Toronto and Vancouver. Look out below.
2000 bottom? The bottom was rather clearly in 2012.
Futures confirming last week was consolidation and not the start of a new down ttend. Looks like new highs ahead. The failure of SPX to break the support shelf in the 2420 area apparently was significant. The market continues to surprise to the upside with wave extensions. Amazing!
I have said 6/23 was a low. So now it’s up. What is surprising about that?
Looks like you were right, and the Bradley and Pancholi turn dates were either wrong or mis-interpreted by those of us expecting a change from up to down. A trend change can also be from sideways to up, and that looks to be what we have.
I did have serious doubts that we had started a new down trend so hats off to you for calling it. I must have missed your post as I don’t remember it. I know Joe did expect the rest of June to be positive and so far that seems to be playing out.
Early july is heavy. The end of july will bring a low.
You were right Andre. On June 17 on the Tringular Oil thread you did confirm Joe’s call for z June 30 high and said June 23 woul be a low. Thanks for the reminder.
Good call Andre thanks.
Andre is the high of the year already in as per your previous posts?
Did he say that?
If so do you remember what thread it was and when? It would be nice to see the context as I assumed from his comments today that he expected new highs into the month’s end. Thanks!
I carefully re-read everything you said in that post. Your comment on a re-trace into October is to me intrresting. The six observed HOs point to a possible steep decline sometime before September 30, 2017. Since many crashes come in the Fall,and are third waves, it has long been my own contention that a Fall crash would require an initial first wave down with time enough left for a second wave correction prior to the start of a third wave down. That is the primary reason for my own expectation that the last major turn dates would mark a market top. I was wrong, you were right. Nobody”s perfect.
NQ breakdown after the .768 retracement this morning. Nice call Peter T.
Yep. It made a valiant attempt to clamber back inside the rising wedge and now has only a fat red candle to show for its efforts. Looks like the breakdown from June 9 remains intact after a two week re-trace. I have never seen anything like it.
I took the short this morning because there is a high probability of going from the .786 retracement to the 1.272 extension.
I held onto an IWM bearish call spread albeit with some concern. My line in the sand for SPX remains 2420.
yes, the SPX loses 2416 and its look out below.
IWM working on a 1 hour hammer, so be careful. It gets through todays high, and i am selling put spreads 4dte.
They are fighting the decline in NDX. Impulses down, rising wedges up. We had a green candle today, then a red candle. then a green candle sporting a lomg lower wick….
ES target 127.2 extension has been reached. 161.8 could be next.
Tks, but don’t think we’re quite done yet. We may have one more high.
Makes sense to me. I cannot imagine we have been in a second wave for over two weeks after a two day wave one…
Taking 1/2 off NQ short contracts from 5837, since we hit 61.8 extension. Still looking to hit 1.272 extension before exiting other half.
ES 1.272 extension from the .786 retracement comes in at 2417.
Extension short broke, so exited out the other half at 5720.
andré June 17, 2017, 6:32 am
I agree with Joe that june 30 will show a high. In the first days of july many cycles turn. Remember that big moves almost always come after a lunar square as this brings low gravity/neap tides. 7/1 is first quarter. After this date it gets interesting. The end of july/august 1 will bring a low. So july looks very bearish.
Due to the holiday weekend the turn will come after 7/4. 7/5-7 are strong dates. But the strongest date is 7/13; this is the crash cycle. After a low 7/10 7/13 must be tested.
It is very likely that in the first week of july we will start a decline into spring 2018. In between we will see a retrace into early october but this should be a lower low.
For next week I expect a high 6/19, then a low 6/23 and up into 6/30.
Cheers,
André
Thanks Andre.
Interesting that you see a decline into spring 2018. I see a final Wave 5 high not till after Sept 2018 so that will allow the decline and rise.
Expecting the near term high July 3 in between the weekend and holiday. The Jupiter/Neptune 150 quincunx makes for important reversal….
I sure you like to see your wave map of that scenario whitemare. Any price targets? How deep a wave four correction do you expect?
Do you also expect an extended (sub-wave 3 or5) fifth wave?.
What do you think of the Hindenburg Omens?
The amplitude between high and low tides is a proxy for gravity.
6/19 the amplitude crossed the average upwards; a bearish signal. 6/23 the amplitude gave a high. This gave the low in the market.
Next low in the amplitude comes 7/3. Low gravity is bullish so this will bring a high. But the amplitude stays below average until 7/7.
We have tidal inversions 7/3 and 7/4.
Combined this suggests a low 7/4 and a high anywhere between 7/4 and 7/7, From what is see now 7/6 seems to be the most likely date.
Another strong date is 7/13. This is likely the most significant date of the month. So I expect some consolidation with increased volatility into 7/13. Should be a 3rd wave and we all know what that means.
Thanks Andre.
My conceptual anchor is that W5 top not till after Sept 2018. In between–
more conjectural. Let’s say a August eclipse window first leg down about 2340, then a big correction followed by a second leg down to 2295.
When for that low, is vague as yet. Then a long diagonal wave 5 into the 2018 autumn and the final high — no price projection.
For July 3 I am wanting to see ES pierce or tag the 2454 Neptune line and from there turn down.
The Hindenburg Omen is interesting, but I don’t closely follow fundamentals, am more about cycles and types.
Given today’s selloff, we could be delaying the Wave 3 top till Andre’s July 13. On July 14 there is a triple 150 degree aspect: Jup AND Mer quincunx Neptune from different signs while Sun does the same to Saturn… a rare formation.
What NDX does tomorrow is critical to the immediate term I think. The 50 day SMA has so far provided strong support to previous declines. Nasdaq Comp remains above it; for the first times this year Triple Qs penetrated it today. If this is a major decline, they will both close below it tomorrow, if not, they will both bounce off it once again on the way to new highs- simple it seems to me.
Perhaps futures will clue us in as to what’s in store.
Peter G: You posted a link a few weeks back to a graph showing instances of double HOs. The graph is now gone. I was hoping you saved it and can repost.
SPX finally broke 2020 with NDX confirming breakdown from two weeks ago. Futures pointing to more downside. I have never seen a trend change so vociferously opposed as this one. They expended an awful lot of buying power so thing could end up being a runaway to the downside. Good luck to all!
Verne,
Maybe a Freudian slip…and we are heading to a close below 2020. Very prescient!!
Oops! Indeed! 🙂
http://docdro.id/YhLC8Vo
Peter G I think this was the link you provided for the article on the double HO but it no longer bring up the article.
They are only temporary links, Verne… Try this https://www.docdroid.net/wmNt2uT/double-hindenburg.docx.html
Thanks Peter. I was quite surprised at the dearth of info on the web regarding double omens. I was hoping to find a statistical workup for double omens as McHugh did for omen clusters. As you posted, a picture is worth a thousand statistics (or something similar). 🙂
I’m back home yet busy today so wasn’t able to dig to much into the market .
From looking briefly yesterday though I’m guessing today’s initial drop was not
Much more than 2 equal drops where the point loss of C = A . That leaves me
The impression of a possible minor triangle formation ( no data to back this up yet )
I am in agreement with Andre of a high June 30 – early July and I do question this
Last decline . Something is a miss yet for me it’s about the timing more so than the wave
Count . The recent new moon as well as the previous one in May are similar and both
Showing signs of lows vs highs . The next one around July 20 May end up as a low as well
If this pattern persists . The tricky part comes in August 21 which is the solar eclipse which
Is another new moon . We do get a lunar eclipse as well Aug 7 th I think ( need to check that )
If we do see the cycle high June 30 th day July then July 20 th becomes another swing date
Which targets the lunar and solar eclipses in August . Mars Uranus is in a bearing cycle
July 1 into September and we also will have a mercury retrograde cycle to deal with .
Bottom line I’m expecting more volitility going forward and a lot more confusion .
My trading thoughts are more simplistic .
Stay .nimble and do not marry your positions . Get in with a defined realistic price target
In mind and get out at that targeted price .
No need to be confused with money on the table .
Trade both directions .
I’m guessing that we have a few months of sloppy moves yet
A few scary declines in the mix .
Great update Peter
Joe
Welcome back Joe!
AT&T ( T ) looks like 5 clean waves down .
I’m using phone so can’t say it’s true for sure
But it looks impulsive at first glance .
Joe,
Glad to see you back safe and posting again! Weren’t you caught in some really bad storms?
ED
Its good to be back ,
yes we had a winter type storm this last time up the coast.
its pretty nice weather out now though.
AT&T something else going on from the looks of it .
that stock peaked last year and has been trading sideways
to down .
the dow looks like a triangle yet if the cycles are correct id expect
a break down . More data to dig through before i can make a bearish case.
10 day trin gave a sell signal may 22 ( id watch the may 18 lows as key )
NYA made a new high today ( gives some validity to the june 30 cycle high )
5 day advance decline line is near its upper range yet 10 day is not
and has slight upward bias .
Mixed signals .
NYA 11,500 now support
i have to view the month of june as a sideways month . from june
2 to date . sideways and possible running type triangle formation.
Note to self : i always watch for triangles and even if the triangle fails
by looking at the swings i usually get the timing right .
A B C D E or series of 1’s and 2’s or A’s and B’s .
June 14 to june 21 was a mini bear cycle from the looks of it
and the low was on june 21 ( odd but thatts what im seeing on a 60 minute
NYA chart ) the recent rally from june 21 to this mornings high was a separate
mini bull cycle .
what is going on now is something new and probably ties to the june 2 high
in terms of time.
June 2 June 14 June 21 June 29
12 days 19 days 27 days ( moon )
7 days 15 days ( 1/2 moon )
8 days .
June 27th low was another hourly time count for a low .
if it holds then a high would be due in about 10 trade days .
option expiry July 21 ? is 30 days before the solar eclipse.
if the typical holds true , July 21 to aug 21 would be down.
New moon to solar eclipse down.
aug 7 lunar probably would therefor be a high to low as well .
rough thought, Full moon june 9 July 9 aug 7 .
new moons
June 7 low june 21 low next is wed july 5th ( full moon july 9 )
Going to dig into NYA daily chart more .
watch shorter term support at 11678 and 11635 .
11635 should hold on NYA if this is some sort of running triangle .
the 11635 low was hit on june 7th , 2 days before the full moon .
Im not convinced we have seen the swing high to be short against
yet i am going to keep my bearish bias for now .
Transports
monthly chart looking at it with a broad simplistic view .
wave 1 through 3 from jan 2016 completed in dec 2016 wave 4 has ended
and we are in wave 5 to new all time highs . the may lows are the 4th wave
of 1 lesser degree and should not even be tested until after new all time highs
are printed .
wave 1 lasted 3 months and reversed on the 4th month
this 5th wave is in its 2nd month on a print basis yet its 3rd month
on a closing basis . implies a july or august print high and a reversal .
again not convinced the swing high to be short against is in yet .
10191 looks like a reasonable target for the TRAN index .
the may lows cannot be tested let alone touched if this is whats going
on .
spx
strongest support 2376 – 2364 range
2399.62 is a mini crash target extreme .( just a short term target though )
2408.52 another short term target
2408.52-2399.96 1st support
2399.62 next
2376-2364 ill look to buy if seen for a minimum short term bounce.
again the may lows look important.
8 month cycle pattern to follow yet ill get to it tomorrow.
we may be in a sideways trend from the looks of it .
this implies a shorter term trading style of get in and out
rather than get short and hold .
thats it for me today
dow
21052 is the closing support i view as the KEY support level
going forward .if that level holds there is a possible bullish
take to be followed up to 21074 and if that is taken out
then 22356 becomes the target for an august high .
look at the dow daily close only chart the 21052 level
has been meaningful .
The june 30 high i have been looking for may turn out to be a
low of sorts . to soon to say . but were going to find out next week.
21230 is the major pivot on the dow as i see it as long as the dow
is below that level i consider the trend Down .
we poked below it today yet have not closed below it ( market not closed )
21075 on july 6th is the 80 year historical model projection .
that said 21230 is the july 12th swing high projection followed by a
deep projection down.
the common theme is bearish . whether sideways or just down.
expecting surprises to the downside .
more work to be done over the weekend .
correction
if 21052 holds upside to 21704-22356 into an august peak
Last thought
weekly chart of entire market indexes
from week of dec 26th 2016 we have been in an extended 5th of wave 3.
this is an ending diagonal im guessing ( ill need to re read the details
associated with this pattern )
week of
dec 26 4th wave over
wave i of 5 of 3 ended wk of feb 27th 2017
wave ii of 5 of 3 ended wk of march 27 2017
wave iii of 5 of 3 ended wk of June 26 th ( ended this week )
hence today’s new high in NYA has merit as does the june 30
cycle .
wave iv should therefor overlap wave i
bottom line : if this is true we are only in a minor wave IV from
what began dec 26th ( week of dates )
so again nothing to give the extreme bear case from what im looking at.
the week of July 17th is the next week of date . id rather see that as a high
vs a low yet that is only my preference . it actually makes more sense that it
becomes a low .
back to the moon lol
Final thought . the overall market using all the indexes together
made a new high today , 1 day before the cycle high date of june 30th .
nothing individually or as a group is giving a huge warnings .
the ending diagonal is becoming my front and center pattern
it needs to complete minor wave 4 then head back up to yet another
new high ( above todays high ) in wave 5 and then i will take my bearish
position .
i would like to be able to make a solid bearish case but im not seeing it
at this juncture.
ill assume 2408.52-2399.96 1st support wavers yet holds on spx
2376-2374 may or may not even be tested . if so though ill look to buy
heading out to the sun and going to enjoy the day .
2376-2364 typo
that is the major support which i doubt gets tested
but ill leave it as a possible considering todays highs
june 9th was both a high and a low
today june 29 is also both a high and a low
the june 9th low overlapped the wave i high which
can imply we have been in wave 4 of a triangle since june 2.
this implies a bullish market next week and a further subdivision
of this sideways market action .
im using all the indexes added up so it shows something different
then just dow or spx .
i still cant make a bearish case from this .
todays lows matter and the june 9th lows matter .
breaking below those date swings id say something more
bearish going on . yet untill that happens this is considered
a minor wave 4 and new highs should be coming and todays lows
should not be broken ( based on everything )
more divergences i guess. and transports need to complete the
5th wave that that index is in .
the june 30th date isnt the date , i wish it was but its not .
will begin overlaying models over the weekend to fine tune
all of this .
Something is a bit strange about the way volatility is acting. it put in very long upper wick typical of the end of a bearish move and Bollinger Bands remained quite compressed. The start of an extended downside move should have seen the BBs expand with the size of the move down today.
Very interesting price action into the close. Obviously a lower high in what is most likely a low degree second wave. Market makers executed a great feint into the close to dislodge short positions. Did you buy it?
I tracked the feint on the one minute chart all the way up to SPX 2432.15 and added to short positions on the second red candle at 2431.15 and sure enough it gave it all back in the last two minutes. Next week should be revealing. Have a relaxing and safe weekend everyone!
Long lower wick and VIX action portended second wave correction up today. Surprised in lasted all day.
http://www.caseyresearch.com/articles/doug-casey-on-the-illinois-debt-crisis
So 6/30 was a low. The Daniel cycle gave a low 6/30. But other indicators suggested a high.
I said last week gravity is bullish into 7/3. I should have realized that this could produce an inversion. With a high 7/3, 6/30 can’t be a high.
Still, this doesn’t change my outlook; next week will see a significant high. 7/5 and 7/6 are both strong, so a high 7/5 late is likely. And the end of july will be a low.
Cheers,
André
Hi Andre;
I am a bit puzzled by what you mean that 6/30 was a low. Since is was not a low on the daily, weekly or monthly time scale, I am concluding that you mean it is some different way than I thought- that it just means you expect upward movement from today’s close.
From an EW perspective, it looks to me like the market is starting to decline in a series of nested first and second waves. I am still not comfortable with the time proportions of the initial decline and almost two week long correction upwards but unless we are going to see new all time highs, wave one and two is the only way I can see to count it. More upward movement next week will result in the same thing with the current upward correction in terms of the time dis-proportion to both the previous wave down and the size of the preceding possible second wave one degree higher. Maybe someone with more EW expertise could weigh in?
I guess we both think a third wave down is imminent. 🙂
The S&P made a low thursday night/friday morning. European markets made a low Friday. Not sure what puzzles you. Next week significant high. 7/4 is key date but US markets closed. So 7/5-6 high. This could be a third leg down.
We must be in different places. In my time zone the index made a monthly low on Thursday June 29, with a higher low and a higher close on Friday June 30.
Both 29 and 30 were lows. Us markets turned 29, european market 30.
Not such a big difference. Message stays the same; a more significant turn next week. The more I see the more I think 7/6 is the day,
Aha! I had not thought of the European markets. Got it!
I thought it was my phone but the website seems unusually sluggish today in loading pages, even from a desktop.
On this we can agree 😉
Yeah, somehow SSL got turned on on the server and it wreaks havoc. It’s off now but it may take an hour or two to change over on the net and caching.
Andre’,
Just attempting to understand…You are perfectly clear on a high to come 7/5 or 7/6.
In reviewing you posts both this week and previous weeks you have eluded to 7/13 as a “crash date” in your work…Is that still on the table?
Finally, you have mentioned that 7/30 will be a low…perhaps pushed out to early August i.e. 8/1. Am I even close in my interpretation of your views on the “twists and turns” going forward? Thanks!
Ed,
7/13 still on the table; very significant date. Could be a higher or a lower high. Expect a low 7/10 before the test on 7/13. Will leave the wave structure to Peter.
Great job peter
🙂 Thks.
Quick EW question for Peter T.
Your second wave of this move was labeled as a zig zag, so alteration rules suggests wave four most likely to be some other strucure like a flat or triangle. Since the b wave of an irregular flat can move past the initial a wave, isn’t possible we could see new a new high if wave four turns out to be a flat correction?
Verne,
I’m not sure I understand the question fully. I’m assuming you’re talking about ES. “of this move”? What move exactly?
If wave four turns out to be a flat, the C wave of the flat heads down. We’ve already done the first two waves, a & b.
I was assuming the a wave down was still underway. Remarkable it completed so quickly. It does solve the problem of a weird second wave. I guess the correction may not last as long as I anticipated if c down is already underway.
7/13 is also a squared number midpoint on the 2000 high. This got me thinking. The standard rule is that midpoints (=180 degrees) do the opposite. As 2000 was a high, 7/13 should be a low by this rule. In 2015 7/20 was a high. What is 13 is a low, 20 a high and 31-ish a low?
7/13 is the day. Period. But an alternative scenario is always possible. In 1911 7/13 was a low. But in 1942 we had a new moon 7/13. This suggests a high.
Will do some more analysis. Next week a high is certain. By the end of the week we will know more. So at least down into 7/10 and possibly 7/13.
The tidal sum will be above average as of 7/8 until 7/29. That is bearish.
We’ll see. Have a distinct feeling next week will be very significant.
Congratulations to Peter on the 150th anniversary of Canada.
Cheers,
André
As traders, it is often easy for us to get mired in day to day, or even week to week minutiae.
I seems to me two things are reasonably certain at this point.
1. We have had a recent trend change from sideways/up to down and are still in the early stages.
2. The degree makes a test of the 200 dsma a high probability, which is just a bit higher than Peter’s target.
My approach based on this perspective is to maintain short positions with stops just above the recent highs until we approach the target. Also, keep some powder dry for trading the sharp counter trend rallies so typical at the onset of a significant downside move.
This is extremely counter-intuitive and very difficult for most traders. It can actually be even more effective than riding the move down if done nimbly. We already have had two great opprtunities to do just that and there will be more. The neat thing about this is you can usually book profits quickly on these moves. Of course the BTFD crowd will continue to buy on this move down, as they always do.
We should thank them! ?
Im thinking we will see a sept or oct low .
not what i was expecting yet we will see .
Oct is the pivot able month and if its a high
we go into a huge bear market yet i cant state that will happen.
more likely aug to oct becomes a low and we get a huge rally
which extends into the year 2018.
we are presently in a jupiter uranus oposition cycle
this link below shows the previous dates .
to add to this we are also in a saturn uranus cycle
as well as a mars uranus cycle .
the venus bull cycle runs into year end .
from what i can tell so far is ,
we enter a venus bear near year end or possibly january 2018
we run into more difficulties come april 2018 from both sat uran
and jup uran .
mars Uranus turns down hard following June 12 2018 .
Bottom line:
Im only short term bearish until the market proves me wrong .
https://cafeastrology.com/aspects/jupiter-opposition-uranus.html
left side translation implies a weak decline
right side translation implies more choppy
and a run higher and a crash .
the solar eclipse lunar eclipse mercury retrograde cycles
must be inputted for a shorter term view.
that all said even an august high followed by a crash
would not change this view .
the market should be higher in march 2018 then it is today.
indicators ill touch on later , i maxed out ram and need to reboot
to open the spread sheet .
fun fun
Higher in 03/18? Wow! That is bullish!
this is a pdf file i found online from raymond merriman
which was written in dec 2016 about the jup uran cycle
just posting it for a further read since he goes into a bit of
history.
joe
https://cafeastrology.com/aspects/jupiter-opposition-uranus.html
this is the correct link .
its a pdf file just so you know
http://files.constantcontact.com/6c600f5f201/41195aa0-edb5-4346-8e24-cdd02f8210dc.pdf
A new blog post is live: https://worldcyclesinstitute.com/ralph-elliott-natures-law/
This website is for educational purposes relating to Elliott Wave, natural cycles, and the Quantum Revolution (Great Awakening). I welcome questions or comments about any of these subjects. Due to a heavy schedule, I may not have the time to answer questions that relate to my area of expertise.
I reserve the right to remove any comment that is deemed negative, is unhelpful, or off-topic. Such comments may be removed.
Want to comment? You need to be logged in to comment. You can register here.