
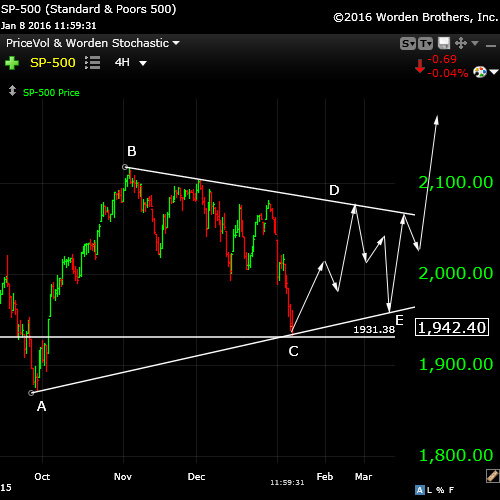
A Fourth Wave Triangle (Jan 7, 2016)
Here’s a big picture look at what seems to be at play for the US equities. Based on current wave structure, it’s the only pattern that fits what Mr. Elliott’s waves are telling us. With this triangle, you’d expect waves in 3.
The recent challenge has been the bearish nature of the market without any motive waves down. That’s led to a look at any alternatives to a possible truncation. I believe this is only one left.
After the e leg, we’d get a brief ride up to the top.
This market has been difficult to trade of late and keeps spitting out wave after wave that has a three wave structure. Triangles are the only pattern that fits that particular wave criterium. It would put a top towards the end of this month possibly.
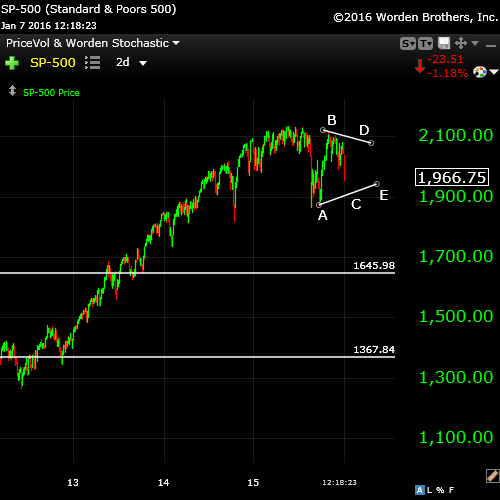
A closer look. I think the bottom of this wave is somewhere around 1931 SPX. This would make wave a and c (not shown) of the wave down the same length. ES and NQ give essentially the same stopping point on a relative basis.
However, it’s difficult to pinpoint the bottom until it actually gets there. When it does, it will define the stopping points of waves D and E. Note that wave C is almost always the most complicated wave of a triangle (which looks to be the case here).
__________________________________
Update Tuesday night, January 5, 2016
This market just continues to amaze. It seems like every time I get it figured out and post a chart, it figures out a way to completely change everything!
In my earlier post (yesterday), I warned about the structure of this wave down and while it looks motive, there’s an issue with a fourth wave that makes me uncomfortable. It turns out that was for good reason.
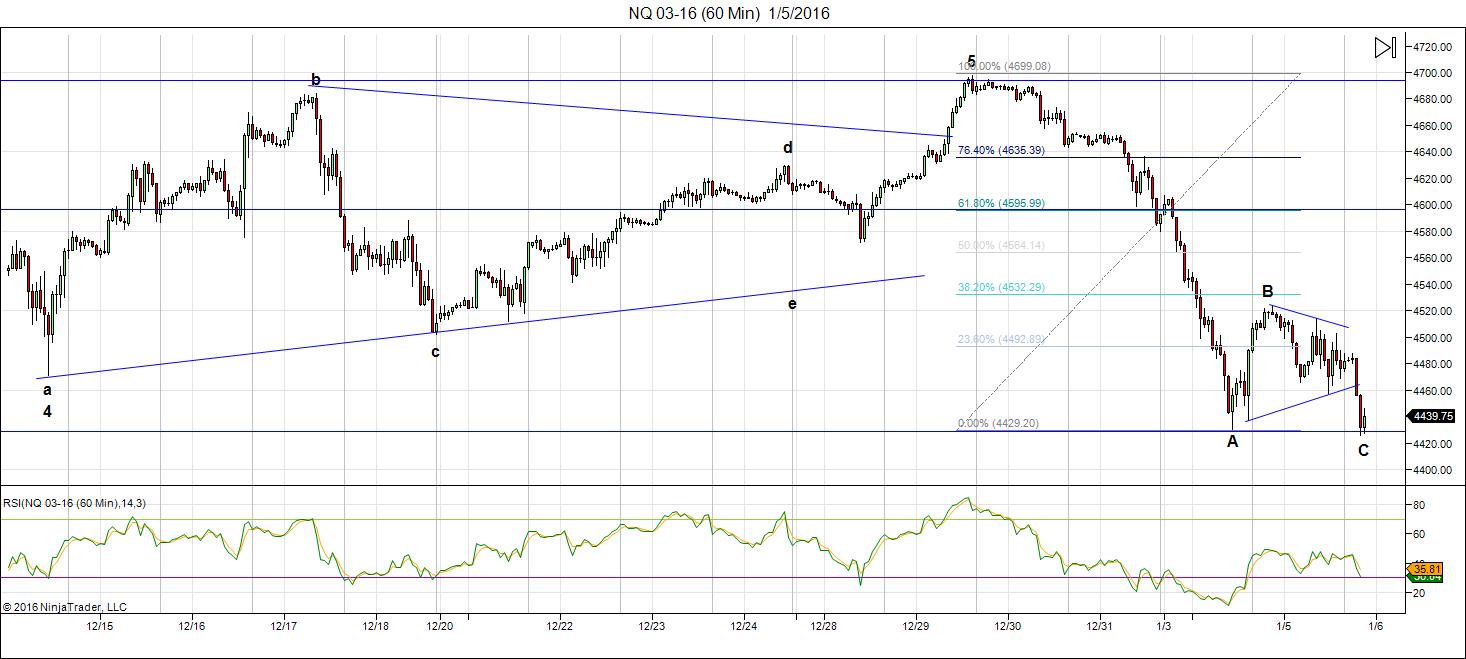
Above is a 60 minute chart of NQ (emini Nasdaq futures). We just now came down to a double bottom after wandering around today in what appeared to be a triangle. This completes an ABC wave and as a wave in 3, means we’re going back to the top. Even if we drop slightly below the previous low, it will still be an ABC (in 3 waves) from the very top. Waves in 3 retrace.
(All the waves at the bottom of the charts are in 3s, so it can’t be the start of a motive continuation down.)
Summary: This wave down has morphed from a potential first wave down into a second fourth wave.
______________________________
Update Monday, Jan 3, 2015, 1am EST
Last night, we had a big drop in what was likely the fifth wave of the first (of the third). Tonight I’ll show you three charts all revolving around the SP500. The other indices have similar configurations.

Above is the 10 minute chart of the SP500 showing the EW numbering scheme for the full wave down. The extension of the wave last night removed my concerns about the wave structure, except for one point. Wave 4 (which is really difficult to see in this chart as it’s so small) did not retrace 38% of the distance from the top of the wave, which it should have done. It was close, and this is only a guideline, not a rule, but it concerns me.
Otherwise, this is a typical wave 1 configuration, although not textbook (as wave 5 is HUGE compared to the rest of the wave). However, the fibonacci wave length relationships hold.
If this is indeed the first wave down, we should continue our retrace to the 62% level (the horizontal line at 2046.16) and roll over into wave 3 of 3 down close to that area. It would also confirm the wave C truncation and determine the path for the next few years.
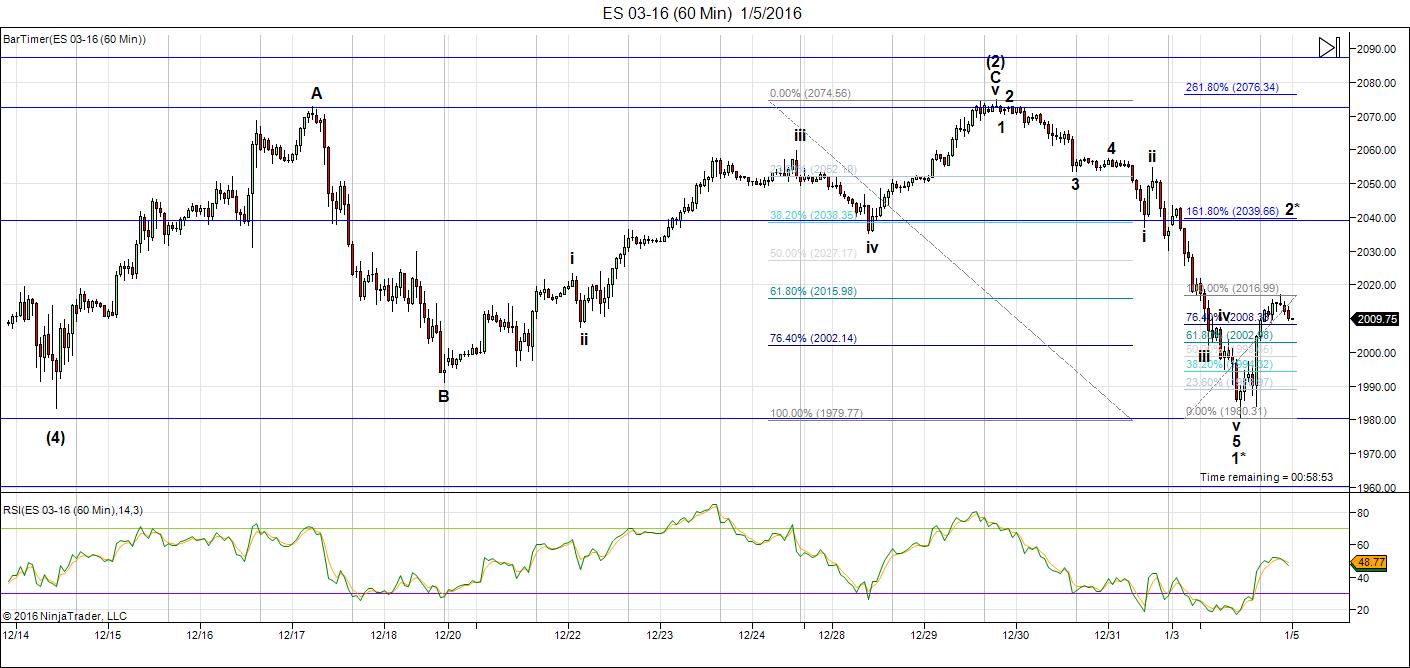
Above is the 60 minute chart of ES (emini futures SPX). Even though I’ve attempted to label the wave down from last night, the upper part is difficult to decipher.
I included this tonight for a couple of reasons:
- The 3 waves up ABC) from (4) were a flat (a 3-3-5) configuration and I’ve labelled the five waves of the C wave.
- The wave that we’re in as I write this (wave 2*) boasts some interesting measurements. Typically, if you measure the first three waves of a sequence and extend the fibonacci tool to 1.1618 that length, you will get the end of the entire sequence. It’s interesting to note that in doing this, you can see on the chart that the end comes to exactly the 62% retrace level (or the reciprocal 38%, as shown on the chart). This reinforces the probability that the wave will end at that point rather than retracing back up to the top.
Because of the concern I have for the 4th wave, I’m staying alert to the fact that we could retrace to the top, but my preferred count is a rollover at approximately 2040 in ES.
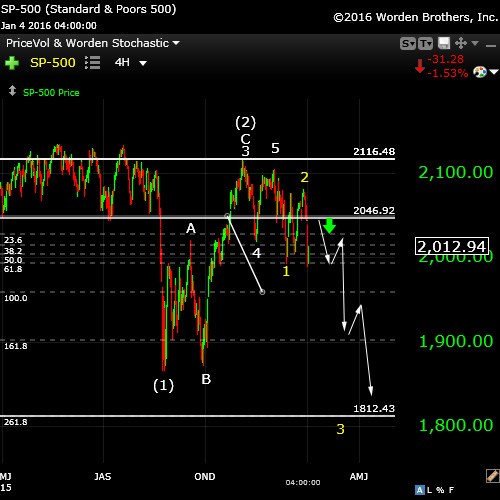
Finally, here’s the 4 hour chart of the SP500 showing the projected path if we roll over at 2047 (approx). We should head down in 5 motive waves to at point around 1812. This is projecting an overall length of the third of third wave of 2.618 times the first wave. In a bear market like this, the third wave tends to be twice the typical length. We’ll should be able to gauge how we’re doing along the route and adjust our projection accordingly.
After wave 3 of 3 is complete, we’ll rally about 38% in wave for and then roll over into wave 5 down. Much more to come after that!
________________________________
Original Post (January 2, 2015) So, here we are … the beginning of a new year. Happy New Year to all! It certainly will be if you’re short (the market, that is).
Bottom line: We’re in a bear market getting ready to rolling over in a very large third wave down. While the short term charts suggest a retrace up to the most recent high (wave 2), the larger trend is down. I’m anticipating a rollover in the coming week.
The “year ending in 5” cycle failed this year. It wasn’t really a cycle anyway, as it hasn’t manifested its prescribed outcome consistently for a long enough period (according to Dewey, as least) and, more importantly, the year number is a man-made phenomenon, not a natural one. Cycles are natural occurrences.
There was also no “Santa Claus Rally.” In fact, the December performance, particularly in the last few days of the month bolsters my assertion that we have experienced a truncation. If you missed my video on that, it’s here.
From The Elliott Wave Principle, by Frost and Prechter:
“Elliott used the word “failure” to describe a situation in which the fifth wave does not move beyond the end of the third. We prefer the less connotative term, “truncation,” or “truncated fifth.” A truncation can usually be verified by noting that the presumed fifth wave contains the necessary five subwaves. A truncation often occurs following a particularly strong third wave.”
We certainly had all of that! As a result (as I stated in the video), I put the truncation date at December 2, 2015.
In the same video, I explained why the major indices cannot go to a new high. This has been a very large, corrective wave up from August 24, a position I’ve taken from, well … August 24.
My projection for 2016? Down. Big time.
Today, I want to do a short recap of where we are in the SP500 (an update of the wave on Friday, in particular).
On Sunday, January 3, we may get a continuation of the move down. I could see us dropping to 2023 in ES before turning back up.
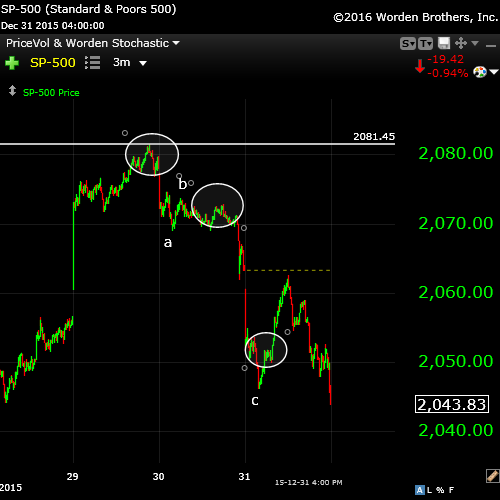
Above is a 3 minute chart of the wave down in the SP500 on Thursday and Friday. There are three areas that are of interest in what eventually ended up as a corrective wave.
The first was at the top of the first wave down. I had mentioned in a comment that the first wave was in three waves. If you look carefully, you can see that’s so. EW, being fractal, requires waves of 5 at each level of a motive wave, which is the kind of wave we’re looking for to mark the start of a downturn. This signalled early on that we were probably looking at a corrective wave. However, it continued down.
When it got down to the c point, I had thought (without the time to measure) that we might be looking at a first motive wave down, as at first glance, it looked like a typical first wave configuration to that point. However, the middle circle shows what would have been the fourth wave. The problem with that potential fourth wave is that it must retrace 38% of the first wave down, which it did not (that’s a hard EW rule). It was short.
When I caught the bounce wave up, I noticed that it only went up in three waves (the lower circle shows the b wave) and once it rolled over, that was a signal that it would likely come down to at least the previous low, which it did. Waves in 3 retrace.
For a wave to progress, it has to be in a motive wave of 5 waves. Otherwise, it’s going to retrace.
That wave up from the c position also negated any chance that it was a motive wave, as now we have no large second wave to balance off what would be a fourth wave. So, the conclusion (for a number of reasons) is that we have a corrective wave down and we’re heading back to the previous high at approximately 2081.
I had mentioned in my video of the previous day that I expected the current drop to return to the top and cap off a second wave. That’s still my expectation and supports my count in that video.
However, I would expect a turn there to be the start of a third wave down.
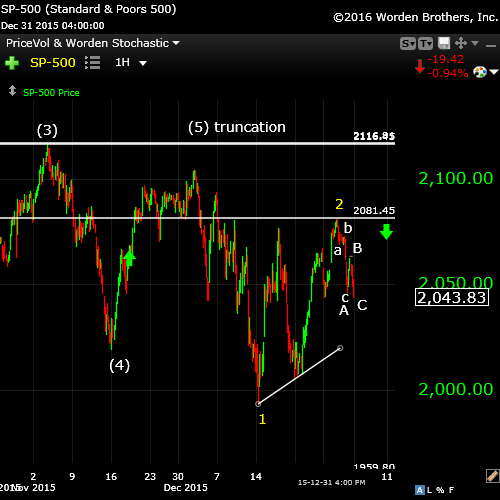
Above is a one hour chart of the SPX showing what appears to me to be a truncation on December 2. If you look closely at the wave up starting from (4), you can see the five waves. In the final fifth wave, the individual waves are present, but they’re not full length, which parallels Prechter’s description of a truncated wave at the top of the post.

Here is the bigger picture—a 4 hour chart of the SPX, showing the corrective flat (ABC) from August 24 to where we are now.
My preferred count shows us extremely close to a turnover.
Good trading!
__________________________________


Hi Peter
Thank you for your updates
I have to say that there is something amiss in what i am looking at with this market . I am seeing many conflicting signals at this juncture . In fact
so many that i am beginning to call it information overload .
the 5 day trin some closed at 8.62 which is an oversold reading . the 10 day trin is now extremely oversold . the 5 day advance decline line is at best neutral the 10 day advance decline line is also neutral at best .
the 20 day oscillator is oversold yet not extreme . and now for a few time counts .
daily cash dow , trading day counts :
nov 3 high dec 2 high equals 20 trading days , adding 20 trading days
to the dec 2 high was friday dec 31 . that is a high to high to low count
which dove tails with your call for a bounce.
the sept 29 low to the nov 16 low was 34 trading days , adding 34 trading days to the nov 16 low is this coming Wednesday, Jan 6th .
previously we had a high to high to low count which was counted from :
sept 17th high to the nov 3 high which was 33 trading days , adding 33 trading days was the DEC 21 low . at this juncture i do not know what that next cycle low will be ( if i add 33 trading days to DEC 21 ) which is Feb 5
here are a few concerns i have right now today .
mercury is going retrograde Jan 5th . ( kind of fits a jan 6 high )
in the past decade i have watch mercury retrograde cycles . i have many times taken them as bullish signals . that is not always the case and in many cases it is bearish . yet that said this past year mercury retrogrades have been bearish for the 1st half of the cycle . this would imply more downside into jan 16th -19th . many many years ago i was watching mercury retrogrades with market bottoms 10 days after in turns direct
it was very consistent then how ever it has not been consistent in a long time . mercury turns direct Jan 25th and adding 10 days is roughly feb 5th
( im keeping it simple ) so Feb 5 is a date for me to watch .
now back to the indicators . the 5 day trin some and the 10 day trin and the 5 day advance decline line with the 10 day advance decline line is the most consistent indicator with the advance decline line being the most consistent of the 2 .when i dove tail the advance decline line with the 20 day oscillator i have my most consistent results . from there i look at the wave count . when looking at the NYSE and even the Dow June 2014 or Sept 2014 is where i feel the bear market began . the choppy waves since that time as far as i am concerned have all been 3 waves . yes i do see the ending diagonal but from a timing point of view we have been in a bear market for either for 78 weeks or 69 weeks . the NYA has a very defined head and shoulders top formation from feb 2015 to july 2015 . as can be seen from the sell off into the august lows it wasted no time once the right shoulder was formed . that is typical of a head and shoulders top formation . basically the market just melts down . now looking at it from a larger view ( this is all weekly chart or NYA ) we have another right shoulder which has formed at the week of nov 2 high .
the left shoulder of this pattern would be the week of June 30 2014 high
the right shoulder the week of Nov 2 2015 high .
the neck line would be drawn from the week of Oct 13 2014 low and the week of Aug 24 2015 low .If this pattern is correct then we need not see any bounce as that would not be the norm with this pattern .the downside targets the NYA roughly 20 percent lower from present levels .
This makes the August lows extremely important ( in all indexes yet in the NYA its even more important ) Now that i have the big bearish picture out of the way i must continue to mention that i see an oversold reading in the trin numbers which concern me yet when i look at other indicators
i am noticing something else . from the 2009 lows most of my longer term indicators went from multi decade extremes back to normal so to speak
each oversold reading was near the 0 line . over this past year the 0 line has been a high in the market ( going slightly above 0 and then going back below ) it has been a bear market from that point of view since nov dec 2014 . so from that stand point the entire year of 2015 was a bear market .
Now lastly ill add the alternative and how to spot it . How you know when a head and shoulders pattern has failed is you watch the right shoulder
peak and call it critical resistance . ( also once the right shoulder is formed the market should just fall apart , the longer price sits above the neckline
the more the odds shift to its failure ) so how to you trade a failed head and shoulders pattern ? you take the measurement from the peak or head and measure down to the left neckline low and then take that measurement and add it to the right shoulder peak . some people also will add 1.618 to that measurement . take a look at the week of march 9 2015 low and the week of July 6 2015 low and draw a line through those lows . that was the neck line and all the market did into the week of Nov 2 2015 high was form right shoulder of the next higher degree right at the neck line . this is EXTREMELY BEARISH if this is true .
Bottom Line : the market is becoming oversold yet not extreme .
if this is a true head and shoulders pattern these indicators will go to extremes . The week of nov 2 2015 high in the NYA must not be broken or we will see new all time highs across the board . That high was the Nov 3 high . The dow is now roughly 500 points below its Nov 3 high just as a reference . The inverted crash cycle based on the 1929 crash and the puetz window ended Oct 26th 2015, that not that many days from the Nov 3 high . so considering all of this id say this . In order for this to be a bull market the Nov 3 highs must be broken and a failure to do so is flat out bearish any messing around chopping up and down starts to shift the odds that this is not a right shoulder formation and gives the oversold reading some validity and this past years bearish environment has ended and we are in the early stages of a new bullish cycle .
Bottom line : We are about to see a large price movement in the market
the Dow closed pretty much right at support Friday the high to high to low count has some reason to take a bullish stance yet Wednesday will be a key day from the larger time count and the mercury retrograde cycle beginning . this year as a whole has many bearish cycles from June onward , if this market was to trace out the rest of the 1929 1930 year inverted since last year was almost to a T then we are looking at a market about to sell off rather strongly into April based on the head and shoulders pattern .
Sorry if i am a bit long winded yet we are truly sitting on the edge of the cliff and over the years we have many times come to the cliff and miraculously turned around and went to new all time highs .
with out looking at both sides it is difficult for me to take a solid stand .
This week will be a very important week as i see it .
Happy new years
Joe
Joe, Extremely insight full and a well balance approach on how you are looking at the markets. Many of the sites I look at are mainly Perma Bears. It is nice to see some one like your self, give a well documented view on the markets both in the short and long term duration of the markets.
Your other posting Joe, you stated you achieved a 100% returns on your capital. Congratulations ! I thought I did extremely well, you make me look like rookie. I stated last week, I was planning on selling my longs. Instead, I kept all my long positions. released my hedges ( shorts) I am expecting a surprise move upwards in the markets this week. I thought we would have had the surprise move last week. As for the Nasdaq, it was a positive 2015. As for the 5 year cycle, I will definitely have this noted for 2025 as a very good cycle indicator. All thou sp just missed a positive year by 1 percentage point.
Joe, have you read any of Martin Armstrongs postings? He does talk about a transition period where the flow of capital will eventually come to the US markets. Perhaps after one large market scare. ( sell Off ) As I often ask, which nobody is able to answer the following. WHERE ARE INVESTORS GOING TO PUT THEIR MONEY? Asia, Europeans ect are sending their money here in (US)North America. Treasury bonds and the stock markets. Capital always flows where it is perceived as a safe haven. ( Martin Armstrong quote) Look at the US dollar compared to all other currencies around the world. In Europe, it is a complete chaotic mess with the refugees crisis. We have a complete black out with the media with what is really going on their. My contacts in Europe have told me about the huge demonstrations in Germany denouncing the governments handling of the social programs for the refugees which many are not even legitimate refugees. It is one huge crisis, both in terms of social and financial obligations the corrupt government has to address. Certainly if I was an investor from Europe, I would certainly transfer my money over seas to the US. Good luck Joe. I look forward to your well balanced views of the markets.
If your truncation theory proves correct, it’s interesting that one of the two major truncations cited in the Elliott Wave Principle occurred at year-end in 1976. The seasonality seems right. It will be interesting to see if the dollar and gold recreate their respective moves this time too.
Hi Peter
I made a discovery today in regards to timing bottoms from
head and shoulder top formations . i have only gone through
the the top in the year 2000 the top in 2007 the top in 2011 and this recent top . in each case the formula has targeted the bottom to the week .
obviously i need to do more research on this .
the larger head and shoulders pattern is this is indeed the case
could not bottom until the week of august 29 2016 if this holds true .
ill focus on head and shoulder top formations this year and how to time them . maybe i just got lucky with what i ve tested so far maybe not .
all the above i wrote earlier still stands .
if i m right on this recent study it will dove tail very well some of of the late George Lindsay work and would be a discovery i have never read .
Joe
Dave
Thank you for everything you said .
I do read martin Armstrong’s posts and i was to comment im afraid id get to carried away writing .
as for the stock markets they tend to repeat over and over and at times i find it is just simpler to sit back and trade when the set up is in place .
tonight’s sell off has a 5 wave structure to it .
tomorrow will be interesting
Joe
The 10 day has un officially given a buy signal this morning .
the 5 day adv line is into a somewhat oversold position .
i use closing numbers so cannot say it is official until the close
other than that this could easily be 3rd wave action and breaking below
17000 on the dow will probably not bode to well
Joe
I’d say we’re close to a bottom now. I see an ending diagonal, but they’re difficult to pinpoint an end to. I can’t get a good count on the wave so it’s up in the air as to what it is at the moment.
I wouldn’t try to catch a falling knife. We’re starting some big moves now so there will be lots of great opportunities coming up.
I expected a drop last night, but obviously not to this extent.
An EW entry is five waves up at small degree and then three down to approx 62% retrace of the wave up. Still, if this has become the first wave of wave three, bulls beware. There’s less anxiety in waiting for the next top and shorting it.
The market has gone under your previous 1 down.
Is it the 3rd ?
Don’t know yet.
After doing some measuring, I’m leaning in that direction. This would be the first wave of the third. If that’s the case, we’d expect a 62% retrace and then a rollover into the third of the third. That would confirm the downtrend. What’s making this especially difficult is the possible truncation. It’s not making any of this easier … sigh.
Currencies are doing what I expected so far (I’m still short the eur/usd) for this to be a first wave.
I’ll at least put up some new charts tonight … maybe a new post, although I will more likely wait a day. I’d say we have the first of the first of the third complete.
I’ll provide some targets tonight for the retrace for the major indices and futures. Once we get a rollover into the next wave down, it will confirm the truncation. That next wave will be a large one.
The wave we’re in now for ES should end about 2012 and perhaps roll over into a very large fourth wave, leaving a fifth up from tomorrow. The wave up overall should look like a “three”. So we may head down most of tonight, but only about 38% of the entire move up from the bottom.
The target for ES is about 2039 or slightly above. The first wave down usually has a little larger retrace, due to the bullishness still in the market.
More later.
I haven’t measured any of this yet, so it’s more of an eyeball guesstimate.
Well, let’s see.
This market is like drunk monkey
I’ll bet you get more out of this market than you’ll get out of a drunk monkey … 🙂
After all that Peet has done I think ‘let’s see’, is not the right sentence to say… What about: F*ck.yeah you are spot on mister P! Burn markets burn!!! Or something like that but hey I am just a crazy guy from Holland… ^^
Cheers,
W
Haha … well drunk or not, I got all of that C wave in ES and tonight I’ve jumped into eur/usd short. Great when the markets are moving … Finally. All the US currency pairs should head down tonight. They will likely bottom when the equities reach their retrace targets.
What’s great is that you can time your futures trades by looking at what the euro is doing pretty much—on a daily basis, at any rate.
Whazzup
try once to stand in front of blooding buffalo and say him “fuck off”.
He will attack you and you will run.
But one moment he will lose its last forth and break down.
The problem is that you never know when this moment comes and better not to be brave too early
True that D! Though I know Peet a little and we are for 200% on the same page albeit that he is a little older and wiser (more experienced) and I am therefore younger and cuter (^^) of course but I guess P will not admit this! Mwuhahahaha. 🙂
Cheers,
W
Whazzup,
Since you’ve admitted that you’re a crazy guy from Holland, I will admit to being older (fer sure!) and wiser (only because I haven’t admitted I’m a crazy guy from Canada—at least online).
See Peet, you won’t admit me being cuter… 😛
Cheers,
W
Ref all the seasonal type stuff, 5th year phenomenon, Santa Claus Rally, Oct to May seasonal, as goes January so goes the year, and election year positive tendency. Jake Bernstein said seasonals are weak and easily overridden. They are best used to judge relative strength or weakness. So fifth year weakness and no Santa indicates underlying weakness.
If Santa should fail to call the bear will visit Broad and Wall
Hey, I like that last line … hadn’t heard it before. 🙂
I’ve added three charts to the top of the post.
This market is like “a walking dead”.
You shoot it, it falls down but in few minutes gets up and continue walking with closed eyes.
We need a silver bullet
Dmitri,
To your point … NQ has come down to a double bottom tonight, and I’m going to assume for the moment that all the indices will do more or less the same thing in the morning. That means that this “first wave” has come down in three waves and that all the bullish options are back on the table. And it points to my concern about that first wave down not being perfect (and why I pay attention to it when it’s not …).
I’ve certainly never seen a market like this one …
Eventually, I think it will just wear itself out.
I added a chart of NQ tonight at the top of the post. Things just keep constantly changing ….
Well, no chance.
The futures have gone below Monday low.
Makes no difference. It’s still an abc wave.
In ES & NQ, this looks like the second wave of the third, so it would have to drop a bit 1977-79 in ES before taking off again.
Hmmm. Or it’s fourth wave (NQ) and a second will follow shortly.
Nope … wrong … I guess it’s a continuation of the first (a) wave. At some point there will be a larger second wave, and if I enter, that’s where it will be.
Now we have our 5 waves up in ES.
Hi Peter
I mentioned a few days ago about my timing discovery with head and shoulders tops and a target for the week of Aug 20 2016 for a low ( should be an important low ) Today im doing my first test using the daily charts and on a smaller scale .
I have done a few intra day tests with 1 minute charts and its been working yet
a few things not accurate doing that .
so based on the daily chart we have 10 more trading days of downside if
this discovery is accurate . i need to go to the dentist so typing quick .
the target is for Cash Dow to 16447-16438 which is near the .618 retracement
at 16366 . this is a price time match . So i would not even look for a bottom
until jan 20 on the short term charts . this is a wave 3 of sorts .
ill look at the market later today and define the wave labels .
Bottom line : i said i was turning bullish several days ago and would give this
market 10 days to prove itself . as of today its not proving itself and the head and shoulders patterns keep showing up . the peak in the nya back in june 2014 also
correlates with the peak/break down in the price of oil .
the larger wave count i cant say my thoughts on at this juncture .
Very short term ( today tomorrow ) 16820-16764 may produce a very short term bottom . could be bottom of wave 3 ? ( from the dec 29 high )
im switching to 30 minute charts . 17200 now resistance . the triangle can be a wave 4 or a series of 1’s and 2’s . so soon to call it
Joe
My confidence level in this market at the moment is zero (at the highest). All the indices came down in 3 waves. The count up this morning in cash differs from futures. The futures look to have risen in 5 waves, while cash has gone up in three waves. So I’m expecting cash to do a double bottom.
This is the biggest mess of conflicting signals I’ve ever seen. Time to let things shake out a bit and give some better clues as to what’s going on.
I think we may have a bottom or will after one more test. SPX went to a new low, ES a double bottom, NQ didn’t hit a new low.
Eur/usd is telling me to expect a low in equities as it did a double top and should head down. Gold still heading up. So there are a lot of signs that we’re near a top, but certainly nothing concrete …
I can label the DOW and SPX as ending diagonals, which makes the overall wave down from the top count as a possible 5 in both. However, wave two is short and I’m uncomfortable calling is a motive wave down. We’ll have to see what happens on the way up. But it looks now like the bottom is in.
The Nasdaq is slightly different. It will take a bit of time to work out the options.
Hi Peter
I get what you mean by conflicting signals . what i see going on is more subdivisions
in the 30 minute cash dow . You may not agree with this wave count im going to
make do to a little slop in the subsidvisions yet here it is .
todays bounce from the 16820 area is best labeled wave v of 3 of 3 .
this implies a bounce tomorrow to the 16962-17003 range foloowed by a drop
to the 17767-17674 price area to complete wave 5 ( 3 ) then a bounce back towards 17200 in wave ( 4 ) . My issue is i do not like nor believe in extended wave 5’s when they go beyond what i consider a normal 5th wave .
its getting tricky yet the picture is beginning to clear up .
as an example . many times counting 5’s and including the potential 3’s in the larger picture many times for me helps . its not always a correct wave count yet the price ranges tend to hit . ( todays 16820 example fits )tomorrow its the 16764
area i am watching for .
the present count im looking at is a larger 3 wave movement from the nov 3 high .
Nov 3 to nov 16 wave A nov 16 to nov 20 b . ( it was a 3 wave move ) nov 20 to dec 14 wave c. the entire drop from nov 3 to dec 16 a b c labeled ( A ).
dec 16 to dec 17 labels ( B ) or X yet ( B ) is the best fit . the drop from dec 17 to dec 18 labeled wave 1 of wave ( C ) . dec 18 to dec 29 labeled as wave 2 of wave C
or can be wave B of ( C ) . the minor count from there is wave 1-2-i-ii from the
dec 29 high to the mid day dec 31 swing high . wave iii began dec 31 and extended down jan 4th , wave iv the jan 5 open followed by wave 1 then 2 then i then ii
wave iii was this mornings drop wave iv this mornings swing high wave v of 3
todays low near 16820. if that is correct then wave 4 tomorrow morning followed by wave 5 ( 3 ). if all this plays out a bounce back to 17200 would be all we get .
Summary . nov 3 at cash dow 17977.85 to dec 14 at 17138.47 wave ( A )
for 839.38 points down . wave ( B ) 17138.47 dec 14 to 17796.76 dec 17 .
from dec 17 to present we have been in wave ( C ) , how far down and how the wave count becomes is somewhat irrelevant to me at this juncture .
wave ( C ) will equal 1.618 times ( A ) at ( 839.38 * 1.618= 1358.11 pts down
from wave ( B ) at 17796.76. ( 17796.76-1358.11=16438.65 ).
There are other minor counts with in this yet it is to soon to really estimate
all the waves until i see how this market moves tomorrow .
i think that we most likely see many more subdivisions in the intraday charts
so im going to let them trace out and then re evaluate the market .
for tomorrow its the 16962.10-17003.31 range for wave 4 and then the 16764 range for a wave 5 of ( 3 ) . that if holds true should produce a bounce back to 17200 yet would still only be a larger wave 4 with new lows to follow .
so the jan 20th date while subjective at this juncture is looking like it very well
could be a bottom . untill then im sticking to this wave count and will watch its subdivisions .
Joe
Now we have a motive first wave down.
And the likely wave 3 target got much lower.
Peter,
what is your count for this 1st wave down?
I see it almost done and ready to rebounce in the 2nd
Wave 1 of three.
If this is the bottom, we’re going back to ES 2020.
I’m going to retract my statement about this being motive wave 1 down until I see a bit more. We have some gaps about the 62% retrace level and the wave proportions aren’t quite correct. So we’ll go to at least the 62% retrace level and may go higher.
Do You think that we are already in 2nd ?
The futures have really odd proportions for a motive wave and cash doesn’t measure correctly. It sorta looks good and doesn’t break any rules, but I don’t really like the look of this wave. The option that makes the most sense to me is the fact that very often in a bear market, when you have a really large third wave on the horizon, the second wave becomes a double prong (AB). In that case, we’ve had A down and we would have B going back up to the A high, usually in five waves.
That’s what makes the most sense to me at this point. So yes, that would mean we’re in a second wave—the second half of it. However, it remains to be seen.
That’s keeping in mind the truncation. Because this is definitely a bear market now, it’s just a matter of time before the whole thing rocks to the downside.
Just keep in mind that we could roll over again, before we head up to any great degree. There’s nothing to suggest we’ve found a bottom yet.
Does it mean the retrace between 2020 and 2080 SPX ?
Well, it would, but the more I think about it (seeing that we’ve come back up in three waves and are rolling over again), the more I think we’re in the larger triangle. It makes everything in the wave structure work, even from the very top in May. So if we roll over and come down to about 1905 or so and then turn up, I’d say the triangle in the operative pattern.
If that’s the case, once we do the turn, I’d be able to give you fairly precise targets. Right now, it’s extremely difficult to make any money. This market doesn’t make sense from an EW perspective, with this wave down that looks to be corrective.
Sorry, missed your last post.
What level do you count your 3rd from?
Good morning peter
It looks like the cash dow is going to hit 16438 this morning .
The ym Futures are looking like 16351-16216 with a possible stretch to 16155 which would be perfect , below that is 15856 . mercury retrograde has only begun .
going to get tricky down here . Bailed this morning on my shorts at 16490
no timing for today . going to bed
if 16155 gets touched ill take a shot on the long side otherwise
i am going to let this play out
Good luck with this market
Joe
Considering the craziness of these waves and how difficult this market is to decipher and trade, I’ve added a sobering chart to the top of the post.
Peter—I believe the chart you just posted just might prove to be valid. The current decline has FELT more corrective than impulsive which might lead one to believe that we will at least test the highs again. My one caveat is China, now that they have removed the circuit breakers. A forced selling episode out of China might be the real game changer…that IS what happened during the crash in 1929. Gary (Denver)
Well, Gary, I agree. We’re not coming down in a motive way … more like a triangle way (haha). I’ve been scratching my head trying to come up with a valid picture of what’s really going on. The truncation was sort of OK until this wave down. But you can’t have a first wave down and then a second that are corrective. And these waves are corrective, particularly in futures. It’s obvious. I can’t make motive “work.”
After a truncation, you should actually have a first wave down that is motive. So the truncation really doesn’t work, either, for a couple of reasons.
The triangle makes everything work, because with triangles, all the waves are in three. That’s what we have here. And yes, it calls for a new high, but it also makes the market tradable again, cause we’ll know the path 🙂 I’m OK with that!
It also signals the end of a trend (or in this case, a countertrend), because it signals one final wave up, which may only tag the top—that’s all it has to do. Then all hell will break loose.
The other issue was the large wave up from the beginning of October. Because we didn’t get a fifth wave, it’s also now in 3. And it would mean the wave down from May was is 3 (that one could have gone either way, as far as I’m concerned).
I’m considering a video on this as it changes so much. We’ll see what happens with the bottom of this wave first. I think there’s more down to come.
Peter–Remember, China is the lead market this time around as the US was in 1929. If China were to crash in a forced selling disaster, margin calls will fly from all directions. Gary (Denver)
But at the same time, the wave patterns always play out. So, there’s no way the market in going to crash in a non-EW way. It’s never happened and I don’t think this time is different, to coin a phrase … 🙂
Peter–Agree, IF THE COUNT IS CORRECT. My view is that all of the confusion can be attributed to the fact that we are actually completing a huge B Wave off the 2009 lows…..the behavior has been clear. B Waves are a bitch to trade, and this one has been the bitch from hell!! Just as one last trick for the bulls it just collapses right out of the blue leaving the entire herd breathless!! Remember, only the cattle know when they are going to stampede….and they ain’t talkin!! Gary (Denver)
haha! Well, I don’t have any other count at the moment, because nothing else works …
The cattle are way too busy producing CO2, which makes them viable for a culling, I imagine …
Let me just add that it makes the eur/usd scenario work (which I’ve been stalking). It’s still moving counter to the market. In a corrective move up right now to a double top at around 1.095 and then it should drop to a double bottom at 1.052 or so. It needs a big wave up in equities to do that, imho. I want to be in that euro trade.
A added a chart – a closer look at the triangle.
Peter–We have not seen severe deflation….YET…we will, and it, in part, will be driven by an explosive rise in the Dollar. The metals will get killed, foreign currencies will get killed as the dollar rally unfolds. IMO, Harry Dent has got this one dead right. The gold bug/dollar bears like Peter Schiff and others are going to get slaughtered!! The EU, as we know it, will probably disappear. In K Wave Winter it is every man for himself, not relaxed and happy cooperation. Gary (Denver)
Yeah, I’m writing a book on How to Profit from Deflation. Well into it. That’s basically the scenario … a little ways off yet.
Peter–Cash is KING !!!…..and will be for quite a while. Gary (Denver)
Hi Peter
Thanks for the update .
that triangle pattern looks like a very good potential wave
how ever so does your other count . id say either one will be correct .
today looks like some kind of 5 wave pattern down from the dec 29 high
yet it is becoming very sloppy and i am beginning to think of it as a 3
wave move . the 16438 level is still important from even a 3 wave movement
C = A at 16403 wave c = 1.618 of ( A ) at 16438 and a .618 retracement from the august lows sits at 16366 , ( averaging them , = 16402 ).
I have 1 other pattern i am looking at which is speculative which is this
from the august lows we began what is called a 3 peaks domed house pattern.
it is similar to an Elliott wave pattern yet i think of it as a corrective pattern .
its worth researching . this present low would be Point 10 .
i still cant see we bottomed so not saying that . but this would be point 10
after point 10 you get points 11 12 13 14 . those are like waves 1 2 i ii
the move from point 14 to point 15 is like a 3rd wave .
so even if we have bottomed ( which i am questioning today ) we will need to see
a sideways movement and there must be the 1-2 – i – ii set up or it is not
a 3 peaks domed house pattern . ill also note tha i have traded these patterns intraday yet it is really a 2 year pattern . just like Elliott waves it works in fractals .
i cant change the jan 20th date regardless of what the market does at this juncture . it is my first forcast using that head and shoulders timing method and ill stick with it until it proves me wrong and i will continue to look at the week of aug 29 2016 as the longer term date and over these next few months ill dig into it further so i can refine it so to speak .
Bottom line : 5 day advance decline line now into its lower range yet the 10 day
is not . the 5 day trin sum ill need to add up after the close . the 10 day trin is back above 1.40 and a close back below 1.40 will give a repeat buy signal .
ill also need to check the 20 day oscillator.
id prefer to see that 16400 area tested .
the ym futures id prefer 16155 and yes on jan 20th
there is a bit a range in those 2 figures between the cash and the futures .
maybe it becomes an overnight trade on one and an open market trade on the other either way , not touching the long side unless the ym touches 16155
jan 20th stand.
Today i think is a new moon . this market has been bottoming on new moons .
if im wrong then the bottom is in . cant be short and dont want to be long right here. ( back to the 1 2 i ii set up before making any trades )
Joe
After doing some more measuring, I’m expecting leg C of the triangle to bottom out closer to 1930 SPX. Whatever it ends up being, it will define the lengths of the other legs.
It looks more and more to me like this is the pattern we’ve been in.
Peet and others,
I think we are in 3.3 and will make the bottom of this wave tomorrow. Than 3.4 Monday-Tuesday. Than 3.5 down till January 15.
I am full short from 31 December.
Good luck to all!
Cheers,
W
My measured target for SPX is 1931 or so, ES is 1921, so we’re almost there.
This turn confirms that what we have here is a triangle. We should have a wave up in 3 waves to somewhere close to 2080 SPX. That’s if it doesn’t head down again (we’re a a point or so away from the target, so it shouldn’t make a lot of difference).
I’ve added the adjusted triangle visual (with the expected path) to the top of the post (2nd chart from the top).
My targets have now been met for NQ, ES and SPX. We should turn around here.
Ending diagonals pretty much all around—one of my least favorite patterns and you can’t get a good target end point—these had the typical throw-over. They should also have a dramatic snap-back.
Hope we’re not getting tired of these. They seem to be the order of the day. I’ve seen more of them in the past few months than ever in that short a time period.
The length of the SPX wave down makes the triangle ratios work better. The leg back up should be .618 X wave a, which would come to about 2068, but I’ll post some targets over the weekend (I was having a hard time with 2080).
Peet,
I really think we will kinda ‘crash’ next week…
Cheers,
W
Well, be careful. I don’t see anything from an EW perspective or market sentiment perspective that tells me that. I hope to do a video today but right now the TC2000 servers appear to be down so I can’t access that service.
We are tremendously oversold and bullish sentiment is in single digits. US currency pairs bottoming, but they’re in various stages of doing that. So, they’re at a huge inflection point. But it may take a bit longer to totally get there.
I looked at a whole bunch of charts last night and we seem to be at an inflection point an all the major US indices. NYSE for example has come down to a double bottom. GDOW has done that, too. They both have three waves down, none of them motive. So, all the waves in the indices are in 3s and that won’t change unless we go back up to the top. The major cash and futures indices are all in what looks like a giant fourth wave triangle.
In the flat scenario (which appeared to be what we were doing from Aug 24), there was absolutely no way we could go to a new top. The only way to get there is a triangle, although I didn’t see that coming until mid-week. But now, it looks like that’s what the market has in store. I don’t care either way. My job is to stay totally objective. But that’s what EW is telling me … in a big way.
Hi Peet,
Thanks for your response! EW on the AEX Index (Dutch stock exchange) is telling me that we go up on Monday (at least for some time) and than we go back down till end of the week imho. So I think we are in the third wave down… 😉 My target for the AEX = 360. Right now we are at 408, so that means a 12% drop. But I think we go back to 42x first on Monday.
S&P 500 18xx will come soon!
Cheers,
W
We might numerically be in a third wave but not from an EW perspective. That would be impossible.
I was able to find a weekly chart of AEX. The count shows one wave down in 3 with a further similar wave not to a new low. It’s corrective, as well, and it’s poised to head back to the top.
A cit in the weekend will cause a low early morning Monday CET. Then up into Tuesday evening, some 2 hours before the close on Wallstreet. Then down into a lower low (sun000merc) one hour before the opening of Wallstreet. And then up again into Fridaynight as the turn comes Saturday. Overall we are down into 1/28-29; I think.
Good to see you back. I suggest you write out the acronyms in future as I know that there are lots of readers that don’t know what cit and cet mean. It would be helpful to them, I think. There’s a new post up. I will re-post your comment there so it’s not missed because it fits the fourth wave triangle scenario. Thanks!
This website is for educational purposes relating to Elliott Wave, natural cycles, and the Quantum Revolution (Great Awakening). I welcome questions or comments about any of these subjects. Due to a heavy schedule, I may not have the time to answer questions that relate to my area of expertise.
I reserve the right to remove any comment that is deemed negative, is unhelpful, or off-topic. Such comments may be removed.
Want to comment? You need to be logged in to comment. You can register here.