

The Market With No Clothes
We’re still waiting for my “cats” to herd.
My stray cats are still IWM (the Russell 2000) and the US Dollar currency pairs (which includes, of course, the US Dollar Index).
We’re much closer this weekend, but we still have a small gap to fill, particularly in the Russell 2000.
The herd is expecting all time new highs in the SP500 (and related emini futures). The problem with that approach still amounts to a fairly long list of probabilities against that happening. I’ve listed them previously, so I won’t go into them all here again.
There seems to be this penchant for newbie traders to just focus on one index and expecting it to do something none of the other indexes have a hope in achieving. As a trader, I learned very early on that this is most definitely NOT a good idea.
The NYSE is the exchange that all these traded sub-indexes fall under: It’s the “Mother Ship.” The NYSE is not traded directly, so you can count on it being devoid of the animal spirits in the sub-indices (the market with no clothes, if you like). In fact, it’s an aggregate of the other indices that are tradable.
These subindices are at different levels; some much higher than others, but the true picture is what the NYSE offers.
Also note that trade-futures.com recorded back-to-back days of 91% bulls last week. That suggests everybody’s “in.” Volume is exceptionally low. Currencies are close to a turn, oil is close to a turn, and gold and silver are poised to rise.
This is NOT a bullish scenario, as I’ve been saying for months now. We’re looking for a turn and a first wave down.
The Mother Ship: The NYSE
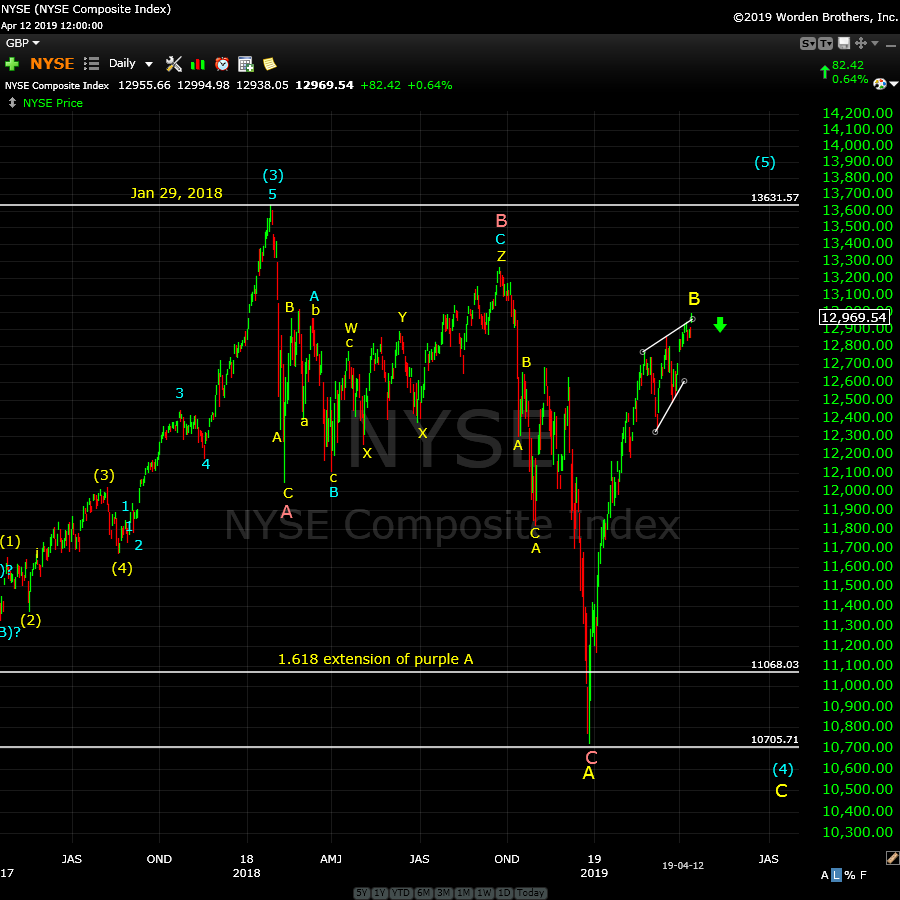
Above is the one hour chart of the NYSE. I refer to this exchange as “The Mother Ship” because it spawns the DOWS (Industrials and Transports), the SP500, The Russells, and the OEX.
However, all those sub-indexes are traded directly, so they’re just chocked full of animal spirits. Only the NYSE gives a clear picture of what’s actually going on. As I have stated ad nauseam, you cannot analyze the market unless you’re looking at multiple indices, and most importantly, the NYSE as a whole.
There will never be a situation in which the NYSE will have a different overall count than the sub-indices. You can’t have the SP500 completing five cycle degree waves to a hew all time high and then plummeting unless all the relative sub-indices trace out the same count … which means they would all have to reach new highs. A fractured market with different counts (with some indexes at new high and others not) has never happened, it isn’t going to happen here, and it is very unlikely that it will ever happen in the future.
In the chart above, you can see that the B wave has traced out an ending diagonal at the top. An ending diagonal is an ending pattern. The fifth wave cannot be longer than the third wave (a hard Elliott Wave rule). At the moment, the fifth wave can still rise another ten points or so to adhere to that rule.
NOTE: The NYSE is nowhere near a top, and has no chance of getting there under the current wave structure.
But we are at an interim high and it shows in what’s happening outside the markets. Tiger wins the Masters, Assange gets dragged out of the embassy, Avenatti gets nailed: It’s like a full moon!
_____________________________
Elliott Wave Basics
Here is a page dedicated to a relatively basic description of the Elliott Wave Principle. You’ll also find a link to the book by Bob Prechter and A. J. Frost.
____________________________
Registration for Commenting
Want to comment? You need to be logged in to comment. You can register here.
If you register, it protects your information. It also allows you to comment without filling in your information each time. Once you’re registered, simply go to the home page and click on the login link top right in order to log yourself in. Usually, you’ll be logged in for several days before needing to be logged in again.
______________________________
Problem receiving blog comment emails? Try whitelisting the address. More info.
______________________________
Have not had a losing week RW 2
Have not had a losing week …I have been with Peter almost a year. The only thing that matters is have I made money with his service. I think I have finally turned the corner using Peter’s EW. I have not had a losing week in the last 5 months. Thanks Peter, for your amazing amount of hard work. —RW |
Couldn’t be happier … KK 2
Couldn’t be happier …The analysis and insight you provide is simply amazing! I’ve been trading the futures and equity markets for well over thirty years and usually average around 5% monthly. Since joining your Traders Gold Service two months ago, that number has better than doubled. I couldn’t be happier.—KK |
Get an upper hand … JC 2
Get an upper hand in trading …Seeing all the different currency pairs and the wave structures and hearing you explain why this has to do that on a nightly bases gives one a upper hand when trading. Elliott Wave applies to all stock and indices and can be applied to any candlestick chart. If someone ask what you want for Christmas – Tell them a membership to Peter’s “Traders Gold!”—JC |
Rise above the rest … SM 2
Rise above the rest …I have only ever met a few people who, in their chosen fields (astrology, medicine, music, martial arts, technical analysis), rise above all the rest and you are one of them…you have ‘the gift’…and that’s why I’m a Trader’s Gold member. —SM |
The best of them JL 2
The best of them …Last couple of years, I subscribed to several ‘market traders’. You are by far the best of them and the personal contact is awesome. Daily and daily updates are very well written! Besides your expertise in EW, I also like your cycles analysis. Best investment I ever made! —JL |
A true expert in Elliott Wave FL 2
A true expert in Elliott Wave …You are a true expert in EW analysis. What you provide is not available anywhere and is priceless. Subscription on your services is the best thing I have ever done. Many thanks for your effort to make me a better investor. I now have more trust in my investment decisions. I hope you will continue the excellent work! —FL |
Tops in your field DZ 2
Tops in your field …You are tops in your field. Tried to follow Elliot Wave international for years. They were always behind the market. After discovering you, I perceive that you are an expert in reading the waves, which puts you way ahead of the rest of your peers. And you can read the Waves like you are reading tomorrow’s financial section. I pray you stay healthy. —DZ |
the real deal SM 2
The real deal …‘Educational, insightful and thorough market analysis for all levels of traders. It’s Elliott Wave at its best….Peter Temple is the real deal’ —SM |
US Market Snapshot (based on end-of-week wave structure)
This chart is posted to provide a prediction of future market direction. DO NOT trade based upon the information presented here (certainly NOT from a daily chart).
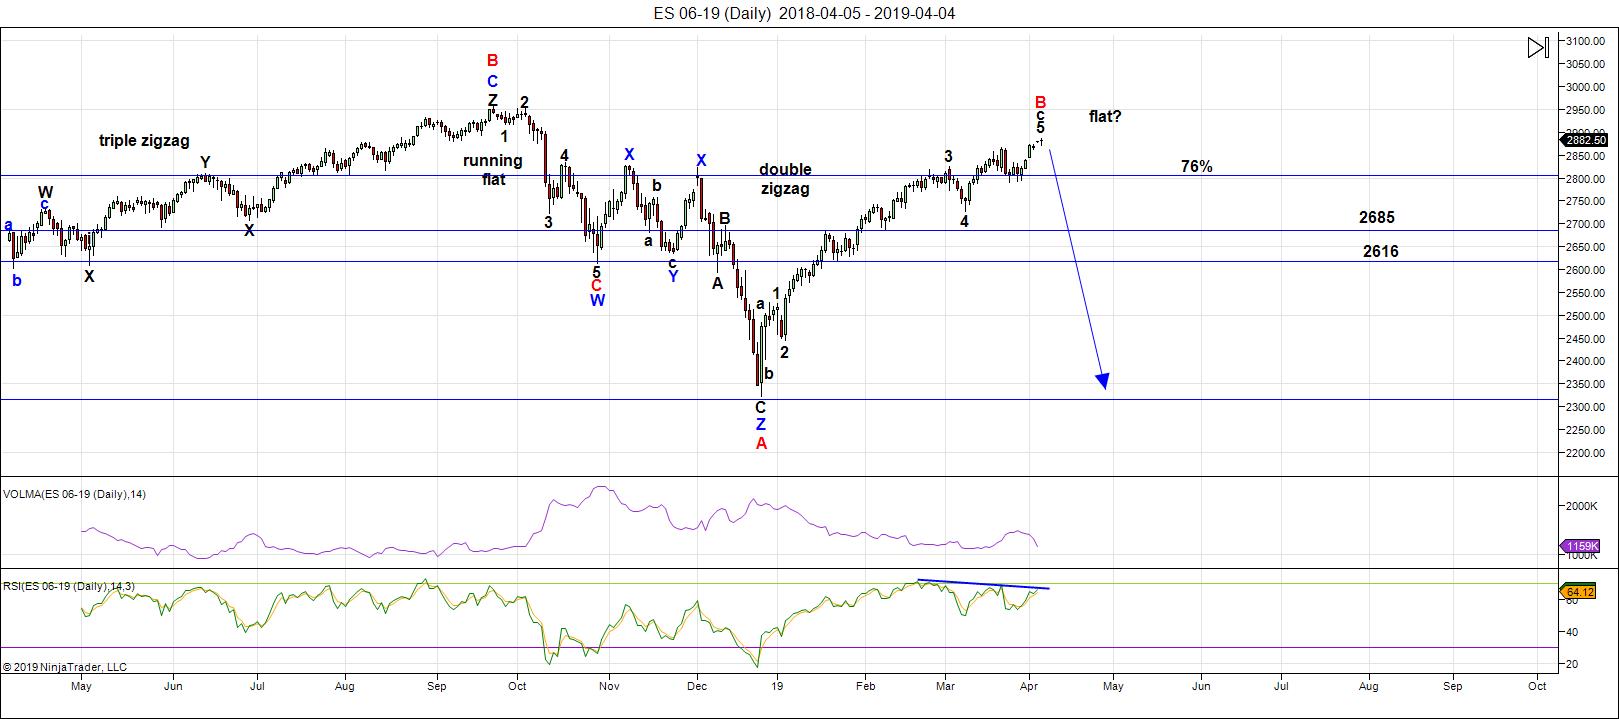
Above is the daily chart of ES (click to enlarge, as with any of my charts).
There's not much new in this report this weekend.
We're still sitting near the top of a B wave that's risen to well above the 76% level of the height of the previous set of waves down from the all-time high at October 3, 2018. Almost all the other assets I cover on a daily basis are hovering near inflection points.
As I've been saying over and over like a broken record, all major asset classes are moving as one. That requires them all to reach new B wave highs before they can turn down together. It's like herding cats and is taking much longer than expected. It's also difficult to project a date for a top, because you have to take into account several assets.
The DOW reached the required new high. IWM (Russell 2000) still needs a new interim highs before everything heads down in a dramatic capitulation. The US Dollar Index also has to complete its leg down before it turns up in earnest.
We appear to be in an ending diagonal in the SP500 and NQ. ES - a minimal new high to finish what appears to be an expanding triangle — we've been crawling along the upper trendline for weeks now.
The next major move is to the downside (after the stragglers get to their targets).
As I've been saying, the wave up from Dec. 26 is clearly corrective and, as a result, must fully retrace to the downside. This is supported by the US Dollar Index, the major USD currency pairs, WTI Oil, along with DAX and other international exchanges.
Summary: My preference is for a dramatic drop in a C wave to a new low that should when all these asset classes I've identified have reached their targets. The culmination of this drop should mark the bottom of this large fourth wave in progress since January 29, 2018 - over a full year of Hell. It may be a dramatic drop that lasts multiple months, and will target the previous fourth wave area somewhere under 2100.
Once we've completed the fourth wave down, we'll have a long climb to a final new high in a fifth wave.
___________________________
Trader's Gold Subscribers get a comprehensive view of the market, including hourly (and even smaller timeframes, when appropriate) on a daily basis. They also receive updates through the comments area. I provide only the daily timeframe for the free blog, as a "snapshot" of where the market currently trades and the next move on a weekly basis.
______________________________________
Sign up for: The Chart Show
Next Date: Wednesday, April 17 at 5:00 pm EST (US market time)

The Chart Show is a one hour webinar in which Peter Temple provides the Elliott Wave analysis in real time for the US market, gold, silver, oil, major USD currency pairs, and more. You won't find a more accurate or comprehensive market prediction anywhere for this price.
Get caught up on the market from an Elliott Wave perspective. There’ll be a Q&A session during and at the end of the webinar and the possibility (depending on time) of taking requests.
For more information and to sign up, click here.
| "I think you are the only Elliot Wave technician on the planet who knows what he's doing.” |
| m.d. (professional trader) |
All registrants will receive the video playback of the webinar, so even if you miss it, you’ll be sent the full video replay within about an hour of its conclusion.


Great post..SIR PETER..turn looks a week..or two away!
Someone observed that tops are a process, bottoms an event. I agree that markets all have to top in the sense that they have to complete their current waves. Whether they all do that AT THE SAME TIME, I have some questions about. I can point to a few bull markets that ended with a lone index going on to new all time highs, and this in fact the heart of DOW theory non-confirmation. Not disagreeing with Peter on this score as we have not confirmed this run from 2009 is done, and that this may be only the primary fourth wave underway, a count I believe to be correct, although some think otherwise.
Thanks for the update Peter!
At what point would the ending diagonal break? Once fifth exceeds the third?
Thanks Peter
Just a few links I think may add some info to sum .
https://www.investopedia.com/terms/d/dowdivisor.asp
https://en.m.wikipedia.org/wiki/Dow_Jones_Composite_Average
Not all index’s are price weighted yet in general price weighting
Or cap weighting leaves some index’s somewhat manipulatable
Spx for example is cap weighted .
http://siblisresearch.com/data/weights-sp-500-companies/
Back in late 1999 it was only 6 stocks that moved the nasdaq 100
Even though it held 100 stocks in it .
Just as Peter has noted today , these same divergences inside an index
Give other clues to what is going on .
As money flows into those specific stocks that move the index it gives
A signal that the index is all good but when looking under the hood you
Can see the many divergences as the bulk of the stocks in the index are failing .
This is typical of a market topping process . <—————
The csco or intc stocks are another example , look at them since the year 2000 to date .
When money becomes concentrated into these few stocks that moves the index and yet
The others begin to fail you get your warning signs .
I am no Dow theory expert but it would pay to have at the least a basic understanding of Dow
Theory. .
I feel all of what I'm posting here is confirming what Peter t has posted above
Thanks Peter .
My next task when I get home is to created another index focused on just the
Main heavy weights among the OEX SPX DOW and NDX and the TRANPORTS .
I'm counting on finding many of the same stocks showing up .
The Dow Jones Composite Index is the Dow , trans and utilities .
Enjoy the weekend everyone .
Hello Peter and friends
Energy chart for this week attached with last weeks results
https://imgshare.io/image/april-15th-april-19th-energy-charts.Z3KNB
Thank you Tom! Have a great week!
Thanks Tom!
More food for thought
https://www.lynalden.com/equal-weighted-index-funds/
I bring this up because what if the 2 different s&p 500 index
Funds find themselves at odds at times .
I’d say pay attention to the quarterly equal weight index adjustments
For clues because maybe by adjusting the equal weight index they
End up effecting the cap weighted spx index .
The more I read about all of this the more I favor what I have done
With my own individual stock purchasing .
Nothing is what it seems
Peter t,
Thanks again , it’s your blog that has helped me to change a few things .
Your time and efforts are appreciated .
Not much for me to say market wise until the end of April .
I’ll note the end of quarter plus 20 days is April 20
yet I’m going to wait till end of April to take on a few bearish
Trades ( For hedging reasons )
Good luck everyone
🙂
Your post is a joy Sundays bring to us. Thanks Mr. Temple 🙂
Interesting tussle around 2900 round number.
A close below would in my view be significant. Zerohedge is claiming a record net long vol position on the part of retail investors and a record net short by institutions but I simply cannot confirm that statement. I have looked at both open interest and COT data and have no idea where they are getting that information.
A VIX print of under 12 is not q situation any one would associate with bullish vol sentiment!
More propaganda??!!
Verne, if you have time and care to comment, I would appreciate your interpretation to this article on retail ETPs and CFTC institutional. I watch CFTC Non-Commercial Net Long Positioning (which is short 141,500 contracts, z-score of -1.54). This doesn’t count commercial hedges of inventory positions, etc… think this is similar to their 3rd chart. Shorts are similar to Sept 2018 top and not far off the pre-inverse VIX ETP implosion. Does their look at institution vs retail fall into your sentiment comments? Do you think one position holds more sway than the other? Thanxxx Verne.
Something just not adding up with vol numbers. Everyone saying we are back to extremes just preceeding Jan 2018 volocaust but the trade is skewed OPPOSITE! Huh???!!!
Even with the vol instrument reverse splits, that has to be the most ludicrous thing I have ever heard. Those instruments are trading nowhere near where they did, in terms of extreme in either direction, as they did in January 2018.
Mojo I will take a quick look and let you know what I think.
That was my confusion. The non-commercial CTFC can be institutional but also can be wrong-sided (like the net short VOL position in late SEPT 2019 that caught them flat-footed).
A non-commercial trader is an individual who has been classified as having no business interest in the futures positions being traded. … The classification of non-commercial traders is used by the Commodity Futures Trading Commission (CFTC) and is based off o CFTC Form 40: Statement of Reporting Trader.
Hedgeye and others use this classification as most direct inication of complacency with indices, commodities and VIX. SO with “retail” ownership of ETPs “supposedly” high, I tend to follow CFTC contracts more than ETP #s. Thanks for feedback.
I suspect the bankster positioning in the short vol trade is not being fully accounted for. They were doing the same crap in late 2017 to juice the risk/parity trade and this time they may be covering their tracks.
Gap providing support and round number being defended by the banksters. You have no better indicator, imho, of where we are going next. Time for more bull put spreads! 😉
Make no mistake about it. The turn after the top is in will not be pussy-footing around open gaps.
Hesitation there lets the directional cat out of the bag so to speak. More cheap puts!!! 😁
energy chart Monday night update
https://imgshare.io/image/april-15th-april-19th-energy-chart-update.ZfLwc
Thanks always Tom.
Wow!
EXACTLY what I am seeing in the price action.
They are fiercely defending the 2900 price point and appear intent on continuing to do so.
I was expecting a sharp run toward 3000 but they are fighting to elevate a bloated market tendind toward sinking under its own torpidity. Why is the entire world so bullish?! 😜
If ES goes to a new all time high, what does that mean for the count?
Thanks
Charles,
ES is just one of many indices. The NYSE is the bigger index to watch. If that were to get to a new high it would change the count, but the Dow, S&P, Russell, and NQ all operate under the NYSE umbrella.
the divergences everywhere are crazy!! but it still goes up! ugh…
on the dow..it looks like fifth..on min chart of the wave lets see
we could still have one more pop up…..from what i see…
it can be..from minute chart from the 11th of march…
we had ((1)), ((2)),
now in possible 3, (5) of ((3)) which should possibly end around 26,800 level..so I am thinking may to have ED finish unless fails before but I would much prefer now..lol
Anyone trading NFLX earnings?
Same week expiration option straddles is typically free money!
355 straddle should really pop after the close…
BOO-YAH!!!
I KNEW IT!!
Sold half my calls on today’s pop as that ramp higher was WAAAAY too cute!
Sweet! Hehe!
Nice trigger finger Verne
🙂
tuesday energy chart update
I had my suspicions that I was time shifted by one day
and today confirmed it, sorry
I don’t like misleading anybody
https://ibb.co/BKnVXHG
Man, you’re on top of it like white on rice!
I figured as much and really not at all too surprised.
Many forces at work in this market…! 🙂
Thank you sir.
My targets..coming true!
Ride..the bull train higha..folks!
From Larry Fink..
“We have a risk of a melt-up, not a meltdown here. Despite where the markets are in equities, we have not seen money being put to work,” Fink said on CNBC’s “Squawk Box.” “We have record amounts of money in cash. We still see outflows in retail in equities and in institutions”
Up..up..& away
2940..2950..and 3k on deck folks..dont git left behind!
Bull has left the station..more upside ahead!
Fink is exactly right and I am surprised he admits it.
Market outflows have been relentless, happening all the way up.
I am absolutely fascinated that he envisions a “melt-up” considering his recognition of that reality.
Insanity reigns!!!!!
Thanx Tom!! appreciated
Looks like RIOT poised to finally close above 5.00 with intrinsic value for 5 strike calls. If it stays above my shares will be called away but I can’t really complain. With a 1.60 cost basis it was a nice run.
Plan is to re-load trade via bull put credit spreads and naked puts to re-acquire long position. Go Bitcoin! 🤗
Bitcoin finally looks strong again….
a peek at next week energy chart
https://ibb.co/kDW22px
The expanded flat, is in my humble opinion the most perversely decepetive of all EW patterns. To the degree that the waves mirror human behaviour, this type of flat exquisitely unmasks the subterfuge and skulduggery of the banksters! It is the pattern that takes more money out of the accounts of traders than probably any other, and one which EWI seemed strangely immune to being able to recognize, thus causing their readers on many occasions, yours truly included, an awful lot of trading capital. But I digress!
When Charles called for new highs I thought the chances of that were slim and none, and slim had already left the building. On the other hand, I was secretly hoping he would turn out to be right because if we did see a new ATH it would almost certainly have to be an expanded flat with all the negative divergences we were seeing as the market continued higher. We are not far away. If we see any new high in the indices by so much as one tick, I for one am going to shorting the H_E_ double tooth-picks out of any such ramp! 🙂
Yikes! The NFLX dip buyers swarming!
It was 17 handles in the red overnight, albeit briefly.
Is Reed Hastings launching another emergency share buy-back bonanza?
We should revisit those overnight and if we do I’m getting outta Dodge with a nice haul…! 🙂
Largest number CFTC SHORT VIX contracts. VIX is dead! Long live the WIZARD of FED! Hail the WIZARD! I count wave 13 on QQQ 🙂
VIXTermination!
On its way!
It is gonna be a riot! Hehe!
These banksters are STUPID!
Look at that VIX candle.
What are they going to do….short it down to 5.00??!! Lol!
It is truly stunning to see how short the memories of the herd appears to be.
Is anyone really buying that nonsense coming out of China about their growth rate?
6+ ??? Oh really??
Tell me Politburo, why the hell is your electricity utilization rate is at its lowest in years??!!
Quite strange for a booming economy doncha think?
Why are people so STUPID???!!!!
Yikes!!!!!
Big credit impulse in the first quarter in China from the perspective of credit expansion. They will be running a current account deficit from now on. So you have a dual deficit nation with a closed capital account.
It’s not a dual deficit like the U.S. with a free capital account and also a hegemonic position. You can’t run a dual deficit economy with a closed capital account and stimulate the way you’ve stimulated in the past when you had a positive current account. Kyle Bass says need to take China numbers with “BUCKET” of salt.
Lot of crosscurrents. DJT passed high of 11/30 but not ATH. See where they hold VIX under 13…
The VIX ballon they are holding under continues to build expansive pressure.
I gueess the rest of us should be thanful for market morons. lol!
NFLX is quite the rollercoaster. I think there is some serious spoofing going on around hea-ah! Haha!
Glad I held onto half my calls. The market makers are very tricksy!!
It will be interesting to see what Peter T is observing in Chart Show!
VXXB just under 10/2 low (even with decay)… and the jury says….NOT GUILTY! HaHa!
Today VIX filled open gap from last Fall….
MMM-HMMM. Can’t call turn but worth watching for change in positions. Hedge positions doing their job early on…
I want to see if DJT poops, pukes, or does a Dow Theory dance… and what all this does to EW counts
I am getting quite an education these days, listening to and reading what others have to say about whatmis going on in the markets, in many cases by folk who are much more capable than I in these matters. I can only conclude that either there is a maasive propagand psy op going on, or something in the air or water has addled the brain of otherwise reasonably intelligent folk. As I indicated, I do not consider myself to be in any way particulalrly skilled in market analysis, but my head is literally spinning from some of the B.S getting thrown around. I like to keep things simple. Here a a few things I see, and assume every so-called analyst does as well.
We have a broken trend-line from the 2009 lows that continues to offer formiddable resistance to upward price movement.
We have a massive rising wedge pattern.
We have a STEEPER rising wedge pattern than we had last Fall.
We have steep momentum divergence that will be confirmed, EVEN with additional highs.
We have a VIX gap fill from last Fall.
We have non-existent volume.
We have extreme market complacency.
We have…but you get the picture.
Oh, I get it….this time is DIFFERENT…right?
Are these people NUTS??!!! 😵😵😵
Great recap 🙂 At a hinge point… QQQ testing 10am bottom for 2nd time as RUT, SPY, DJI broke that low couple hours ago as VIX and VXXB broke above highs. I know short term divergence blah, blah, but with points you mention above this is interesting period. I’m OK with VXXB, TVIX, BIS and SRTY hedge positions. Triggers to trim?
Haha!
The cretins shorting RIOT are definitely not the sharpest knives in the drawer. Lol!
If they merely took a gander at the volume profile perhaps they would not be so eager…Hehe! 😉
Wed. Energy chart update lunch edition
https://ibb.co/njfbGsY
Thank you for the update 🙂
We clearly have sideways consolidation ahead of a move higher. It will be interesting to see if divergences continue to build with VIX being added to the mix and remaining above today’s low.
There is a monumental battle for direction but ironically it is not between buyers and sellers. It is between the banksters and Mr. Market himself! 😱
Haha! RIOT short sellers already getting their tushies kicked…hehe!
We are probably going to take out today’s high. Dummies! 😁
Yeh, Dang…. might have to start day trading RIOT 😉
US/China aggreement (at earliest) late May. I think there will be growth slowing evidence at least 2-3 scoops more than current HaHa. Could play well into Peter and Joe’s counts…
My BIS position up 16%, should take some off but with the social healthcare excitement driving down UNH and others, this looks like contagion. Might add if Mr. M and banksters rule without breaking out.
O.K. Looks like we are going to get a bearish engulfing today but I will refrain from getting my bearish undies in a bunch just yet, if you don’t kind. The crooked banksters (almost typed “bastards”, hehe!) are masters of spoofing, and I would not put it past them to negate that normally bearish reversal sign. We ALWAYS need confirmation. Here is the bottom line. This market will not head South until the banksters actually unwind the leverage they employed to jack prices this high. They cannot hide that event, and you will recognize it when it happens. I expect it to be accompanied by an intra-day VIX move above 15. I am stalking ’em…! 😎
Me too! Fed Q1 GDP expects 2.4%. Hedgeye and others see GDP and earning conparibles with lower numbers and YoY comps lower than Fed #s for next 2-3 quarters. We’ll see.
Yep. You know insanity has reached a feverish pitch when all the talking heads tell you to ignore a yield curve inversion. Heck, some are even touting that as bullish! Northman trader pointed out they said the exact same thing about the initial inversion in 2000. Nothing new, under the Sun! ☺
SPX and IXIC have knots on their head from overhead resistance HaHa! But looks like RUT has concussion… we’ll see
You’re right about the form for a bearish engulfing, Verne, but I re-checked with the Nisson book on Candlesticks and the two need to be different colors to get a “valid” bearish or bullish engulfing, i.e. yesterday’s candle should ideally have shown a higher close than opening, making it white (or whatever color you use for a “positive” day with a higher close than open… I am just repeating the Nisson rule here and have no idea if the preceding day makes any difference…
I am surprised Joe did not call me a fibber for claiming my cost basis for RIOT was ONLY 1.60 since I sold covered calls against my position, hehe! Ooops! 😀
Quite right Peter G.
Thanks for pointing that out. I have learned the hard way that even with the genuine article one still need next session confirmation with downside follow through. 😉
That is one huge sideways coil in DJIA. We are going to get at least one more nice upside pop methinks. Friday’s 264 calls for under a buck look tasty! 😀
Funny how Mr Market allows chump change to erase days moves in last hour or two.
https://m.investing.com/analysis/we-may-be-headed-for-another-volatility-event-200407956
All the recent propaganda about the supposed skewed long vol trade is beyond hilarious.
How could any intelligent wrter pen such hogwash with VIX tapping an eleven handle?
Volocaust II is coming. It’s gonna be bigga, and betta! 🙂
Sleep on, ye lemmings! 😁
https://www.youtube.com/watch?v=Bt7WiUBr9ug
blow-off @ noon today
according to updated energy chart posted below
https://ibb.co/7t5rWdy
Good morning. Thanks!
Thanks Tom, so next week is down the hill?
Yep. Despitevthe close below 2900, the decline so far bears no resemblance to a LEVERAGED unwind, and may be nothing more than a bear trap intended to ensnare early bears. The market has no sellers. It is the crooked banksters who are really trapped. They cannot unwind without it becoming obvious to everyone and they are terrified of what comes next after that process is begun. I could be wrong, but a blow-off death rattle is precisely what I would expect ftom the cabal, and what the price action suggests. Have a great holiday week-end all!
Move out of consolidation almost complete. FIRST wave down should violently break BOTH 2900 AND 2800 in short order. That will be the only reliable evidence of a cabal unwind. Good luck everyone!
https://m.investing.com/analysis/the-smart-money-are-bullish-on-volatility-again-200408049
This article lays out the disparity of long/short VOL, complacency and banksters and PPT (plunge protection team) action over last 15 months and present positions. Happy Easter! Great show last night Peter!
Sold RIOT 4.50 calls expiring tomorrow for a nice double.
I almost forgot tomorrow is a market holiday.
Silly short-sellers!
These people are STUPID!
Have a great week-end everyone!
This website is for educational purposes relating to Elliott Wave, natural cycles, and the Quantum Revolution (Great Awakening). I welcome questions or comments about any of these subjects. Due to a heavy schedule, I may not have the time to answer questions that relate to my area of expertise.
I reserve the right to remove any comment that is deemed negative, is unhelpful, or off-topic. Such comments may be removed.
Want to comment? You need to be logged in to comment. You can register here.