

The Market With No Clothes
We’re still waiting for my “cats” to herd.
My stray cats are still IWM (the Russell 2000) and the US Dollar currency pairs (which includes, of course, the US Dollar Index).
We’re much closer this weekend, but we still have a small gap to fill, particularly in the Russell 2000.
The herd is expecting all time new highs in the SP500 (and related emini futures). The problem with that approach still amounts to a fairly long list of probabilities against that happening. I’ve listed them previously, so I won’t go into them all here again.
There seems to be this penchant for newbie traders to just focus on one index and expecting it to do something none of the other indexes have a hope in achieving. As a trader, I learned very early on that this is most definitely NOT a good idea.
The NYSE is the exchange that all these traded sub-indexes fall under: It’s the “Mother Ship.” The NYSE is not traded directly, so you can count on it being devoid of the animal spirits in the sub-indices (the market with no clothes, if you like). In fact, it’s an aggregate of the other indices that are tradable.
These subindices are at different levels; some much higher than others, but the true picture is what the NYSE offers.
Also note that trade-futures.com recorded back-to-back days of 91% bulls last week. That suggests everybody’s “in.” Volume is exceptionally low. Currencies are close to a turn, oil is close to a turn, and gold and silver are poised to rise.
This is NOT a bullish scenario, as I’ve been saying for months now. We’re looking for a turn and a first wave down.
The Mother Ship: The NYSE
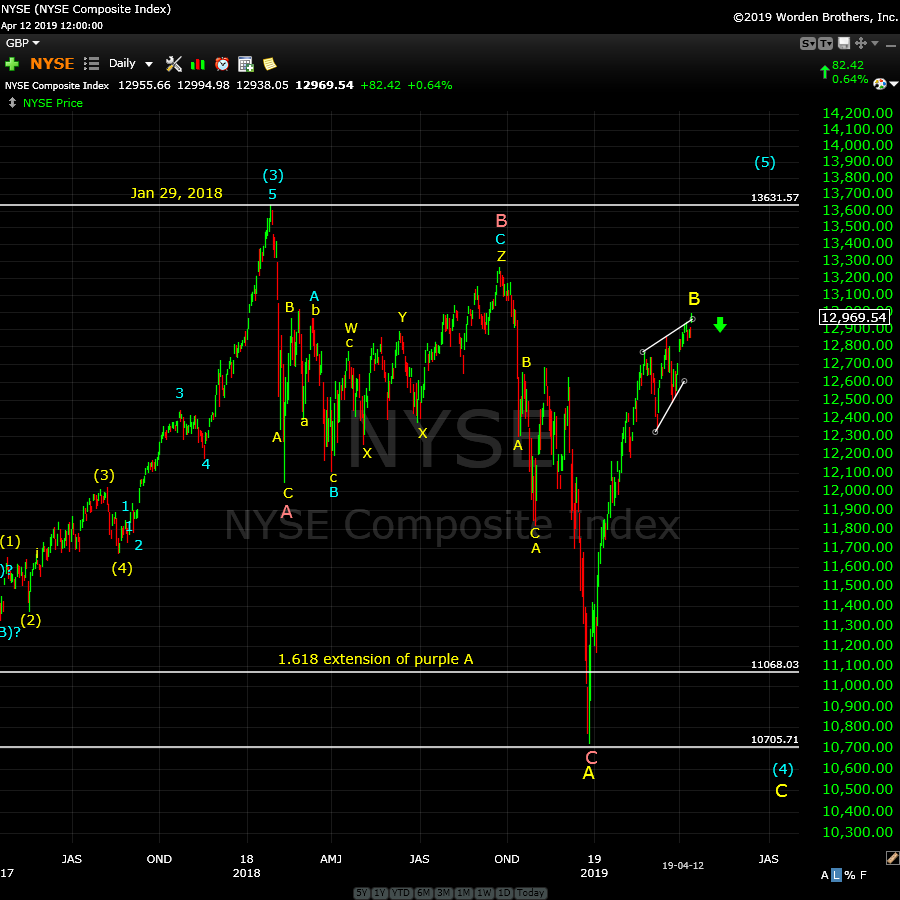
Above is the one hour chart of the NYSE. I refer to this exchange as “The Mother Ship” because it spawns the DOWS (Industrials and Transports), the SP500, The Russells, and the OEX.
However, all those sub-indexes are traded directly, so they’re just chocked full of animal spirits. Only the NYSE gives a clear picture of what’s actually going on. As I have stated ad nauseam, you cannot analyze the market unless you’re looking at multiple indices, and most importantly, the NYSE as a whole.
There will never be a situation in which the NYSE will have a different overall count than the sub-indices. You can’t have the SP500 completing five cycle degree waves to a hew all time high and then plummeting unless all the relative sub-indices trace out the same count … which means they would all have to reach new highs. A fractured market with different counts (with some indexes at new high and others not) has never happened, it isn’t going to happen here, and it is very unlikely that it will ever happen in the future.
In the chart above, you can see that the B wave has traced out an ending diagonal at the top. An ending diagonal is an ending pattern. The fifth wave cannot be longer than the third wave (a hard Elliott Wave rule). At the moment, the fifth wave can still rise another ten points or so to adhere to that rule.
NOTE: The NYSE is nowhere near a top, and has no chance of getting there under the current wave structure.
But we are at an interim high and it shows in what’s happening outside the markets. Tiger wins the Masters, Assange gets dragged out of the embassy, Avenatti gets nailed: It’s like a full moon!
_____________________________
Elliott Wave Basics
Here is a page dedicated to a relatively basic description of the Elliott Wave Principle. You’ll also find a link to the book by Bob Prechter and A. J. Frost.
____________________________
Registration for Commenting
Want to comment? You need to be logged in to comment. You can register here.
If you register, it protects your information. It also allows you to comment without filling in your information each time. Once you’re registered, simply go to the home page and click on the login link top right in order to log yourself in. Usually, you’ll be logged in for several days before needing to be logged in again.
______________________________
Problem receiving blog comment emails? Try whitelisting the address. More info.
______________________________
Rise above the rest … SM 2
Rise above the rest …I have only ever met a few people who, in their chosen fields (astrology, medicine, music, martial arts, technical analysis), rise above all the rest and you are one of them…you have ‘the gift’…and that’s why I’m a Trader’s Gold member. —SM |
A true expert in Elliott Wave FL 2
A true expert in Elliott Wave …You are a true expert in EW analysis. What you provide is not available anywhere and is priceless. Subscription on your services is the best thing I have ever done. Many thanks for your effort to make me a better investor. I now have more trust in my investment decisions. I hope you will continue the excellent work! —FL |
Have not had a losing week RW 2
Have not had a losing week …I have been with Peter almost a year. The only thing that matters is have I made money with his service. I think I have finally turned the corner using Peter’s EW. I have not had a losing week in the last 5 months. Thanks Peter, for your amazing amount of hard work. —RW |
Tops in your field DZ 2
Tops in your field …You are tops in your field. Tried to follow Elliot Wave international for years. They were always behind the market. After discovering you, I perceive that you are an expert in reading the waves, which puts you way ahead of the rest of your peers. And you can read the Waves like you are reading tomorrow’s financial section. I pray you stay healthy. —DZ |
Get an upper hand … JC 2
Get an upper hand in trading …Seeing all the different currency pairs and the wave structures and hearing you explain why this has to do that on a nightly bases gives one a upper hand when trading. Elliott Wave applies to all stock and indices and can be applied to any candlestick chart. If someone ask what you want for Christmas – Tell them a membership to Peter’s “Traders Gold!”—JC |
the real deal SM 2
The real deal …‘Educational, insightful and thorough market analysis for all levels of traders. It’s Elliott Wave at its best….Peter Temple is the real deal’ —SM |
The best of them JL 2
The best of them …Last couple of years, I subscribed to several ‘market traders’. You are by far the best of them and the personal contact is awesome. Daily and daily updates are very well written! Besides your expertise in EW, I also like your cycles analysis. Best investment I ever made! —JL |
Couldn’t be happier … KK 2
Couldn’t be happier …The analysis and insight you provide is simply amazing! I’ve been trading the futures and equity markets for well over thirty years and usually average around 5% monthly. Since joining your Traders Gold Service two months ago, that number has better than doubled. I couldn’t be happier.—KK |
US Market Snapshot (based on end-of-week wave structure)
This chart is posted to provide a prediction of future market direction. DO NOT trade based upon the information presented here (certainly NOT from a daily chart).
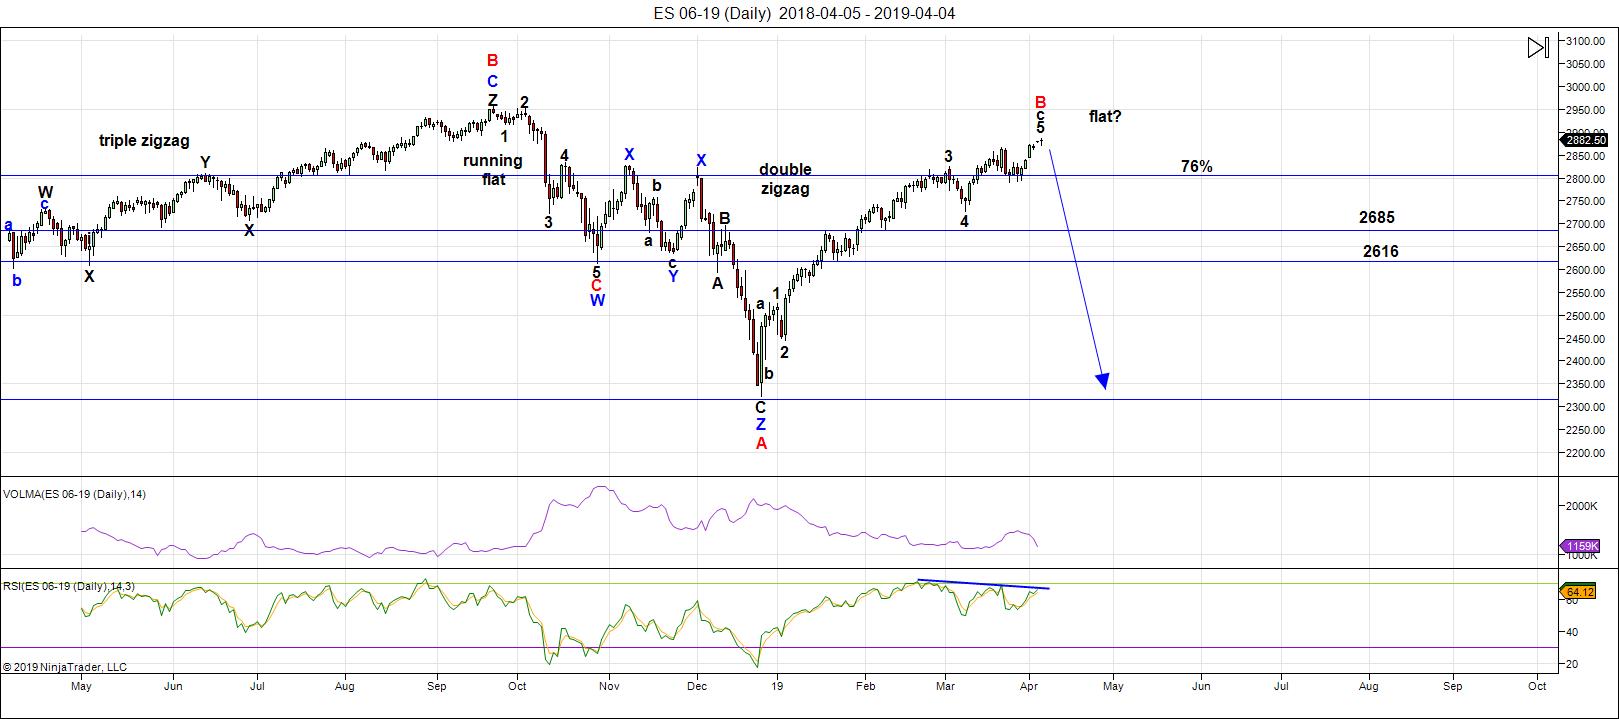
Above is the daily chart of ES (click to enlarge, as with any of my charts).
There's not much new in this report this weekend.
We're still sitting near the top of a B wave that's risen to well above the 76% level of the height of the previous set of waves down from the all-time high at October 3, 2018. Almost all the other assets I cover on a daily basis are hovering near inflection points.
As I've been saying over and over like a broken record, all major asset classes are moving as one. That requires them all to reach new B wave highs before they can turn down together. It's like herding cats and is taking much longer than expected. It's also difficult to project a date for a top, because you have to take into account several assets.
The DOW reached the required new high. IWM (Russell 2000) still needs a new interim highs before everything heads down in a dramatic capitulation. The US Dollar Index also has to complete its leg down before it turns up in earnest.
We appear to be in an ending diagonal in the SP500 and NQ. ES - a minimal new high to finish what appears to be an expanding triangle — we've been crawling along the upper trendline for weeks now.
The next major move is to the downside (after the stragglers get to their targets).
As I've been saying, the wave up from Dec. 26 is clearly corrective and, as a result, must fully retrace to the downside. This is supported by the US Dollar Index, the major USD currency pairs, WTI Oil, along with DAX and other international exchanges.
Summary: My preference is for a dramatic drop in a C wave to a new low that should when all these asset classes I've identified have reached their targets. The culmination of this drop should mark the bottom of this large fourth wave in progress since January 29, 2018 - over a full year of Hell. It may be a dramatic drop that lasts multiple months, and will target the previous fourth wave area somewhere under 2100.
Once we've completed the fourth wave down, we'll have a long climb to a final new high in a fifth wave.
___________________________
Trader's Gold Subscribers get a comprehensive view of the market, including hourly (and even smaller timeframes, when appropriate) on a daily basis. They also receive updates through the comments area. I provide only the daily timeframe for the free blog, as a "snapshot" of where the market currently trades and the next move on a weekly basis.
______________________________________
Sign up for: The Chart Show
Next Date: Wednesday, April 17 at 5:00 pm EST (US market time)

The Chart Show is a one hour webinar in which Peter Temple provides the Elliott Wave analysis in real time for the US market, gold, silver, oil, major USD currency pairs, and more. You won't find a more accurate or comprehensive market prediction anywhere for this price.
Get caught up on the market from an Elliott Wave perspective. There’ll be a Q&A session during and at the end of the webinar and the possibility (depending on time) of taking requests.
For more information and to sign up, click here.
| "I think you are the only Elliot Wave technician on the planet who knows what he's doing.” |
| m.d. (professional trader) |
All registrants will receive the video playback of the webinar, so even if you miss it, you’ll be sent the full video replay within about an hour of its conclusion.


Been meaning to mention Merriman Forecast 2019 is projecting a 4 to 8x..increase above its low..in May 2018..for cattle and livestock in the next 2 to 5 years..
so something to keep in your eyes on.
Verne, I do not consider myself an expert on Japanese candlesticks but I do have a working knowledge of them based on Steve Nison’s book on the subject. When you mentioned bearish engulfing patterns, I got curious and started looking at a few charts. Here’s what was interesting. Both IWM (Russell 2000 ETF) and the NY Composite Index will generate WEEKLY bearish engulfing patterns at the close today if they close below 156.85 and 12,927.73 respectively. They are both below those points as I post this message…
Interesting. The weekly pattern is certainly more weighty! Good observations! 🙂
also IWM..broke the lower trend line from Dec 2018 now retesting as resistance…and struggling..maybe we are done soon? :))
Sox index up some 45% from the Dec lows is a bit excessive
Yet ….. This past week was to be a sideways week with next week
Being the break out to the upside .
After looking at today’s action I felt that the market was rolling over .
It still might be yet since my model called for a sideways week
I’ll let next week’s market action tell the tale.
A further run higher in the cash Dow would fit the bill and target
The last week of April – first week of may for a closing high – print high
Reversal to the downside with may 22- June 3 being a low.
The cash Dow did not experiance a sideways inside weekly bar .
Terrible reception out here on the California coast so limited data
Is all I can see.
Not sure if USA markets open on Friday .
A fail to break out to the upside next week would be the first
Clue something is possibly wrong with the correlation chart
I’m following .
That said , the may 22- June 3 time period really needs to be a cycle
Low or I’ll have to go back to the drawing board .
https://www.bloomberg.com/amp/news/articles/2019-04-18/hedge-funds-aggressively-shorting-vix-shouldn-t-ring-alarm-bells
CAN YOU BELIEVE THIS???!!!
H.L. Mencken opined that no one ever went broke underestimating the intelligence of the American public.
My tendency of late has been to ascribe some the things Ii have been seeing from talking heads in the MSM and the bankster cohort to outright stupidity. I am now starting to have some doubts. The very fact that Bloomiberg, of all outfits, would publish this kind of tripe strikes me as MALICIOUS. Truly scary!
Could this be a major top??!!
I dont get it, why short the VIX if it is already low.
VIX puts have a negative premium, also puzzling to me.
The REASON it is so low is BECAUSE of the massive short vol trade….
Verne
I have always felt that when they change the game then everything I thought
I knew goes out the window and I ‘re think it all from scratch .
They took the vix and created the vxo so I combined them , then they added vix
Futures and from my view the entire vix or vxo has changed from what it used to be.
I won’t be surprised to see the vix or vxo at New all time lows at some point .
That said I look at the vix vxo moves in relationship to index % moves .
Vix and vxo being a product of % range so to speak .
I quit following it years ago because of all the changes .
You are much more on top of how it trades than I am.
Most of the so-called VIX “instruments” are a total fraud. I long ago gave up trying to find any meaningful correlation with market price and the levels at which these things trade. I have not quite figured out exactly what they are doing but it’s definitely not on the level, the reverse splits being just one of the ways they rip off traders who are not careful. The ridiculous disparity between the way UVXY vs SVXY traded during the volatility blow-up in early 2018 really showed just how disconnected some of these things can be from market price. My own suspicion is that even with the two most market dives, the short vol trade has never been fully unwound. One of many things about this market that defies logic.
I only post these because I go back later to research them.
His thoughts dove tail with my own at times and his dates
Are similar to my own .
Raymond merriman :SHORT-TERM GEOCOSMICS
https://mmacycles.com/index.php?route=blog/article&category_id=1&article_id=247We are about to begin a time band containing several important geocosmic signatures with historical correlations to reversals in many markets, April 22 through May 18. This time band will be bookended by the Sun/Uranus conjunction on April 22 and the Venus/Uranus conjunction May 18. Both are considered Level 1 (most powerful) in our studies of reversals in equity markets going back to the late 1920s. Both involve Uranus, which makes this a very challenging period for both investors and market analysts, since Uranus pertains to the unpredictable. In most cases, such periods coincide with reversals. But in a surprisingly large percentage of cases, such Uranus signatures also have coincided with sharp breakouts of well-defined resistance and support zones, leading to new highs in some markets and new lows in others. The stock market is nearing new highs. In fact, several global indexes are already making new highs for this year (2019), and this surge up to new highs can be associated with the Sun/Uranus conjunction in Taurus (money and stocks) this Monday, April 22, It is possible that these breakouts will continue, or resume, near the time when Venus conjoins Uranus on May 18, again in Taurus, the ruling of sign of Venus.
The explosive breakout potential of Uranus, however may be repressed by the retrograde of Pluto and Saturn, which take place in the next week, on April 22 and 29 respectively. The latter (Saturn retrograde) is another important Level One geocosmic signature as published in “The Ultimate Book on Stock Market Timing, Volume 3: Geocosmic Correlations to Trading Cycles.”
When planets change direction, as in the case of Pluto and Saturn next week, it highlights the principles of that planet. Pluto pertains to the psychology of obsession and relentless attacks or efforts to remove someone from their current position. Hence, the calls for impeachment. It also pertains to danger and threats, whether related to nature (like fires and floods, storms and high winds) or human activity that puts others in danger (terrorism, assassination attempts, power plays). But it can also represent intense efforts to rebuild and reform that which has been damaged, or is in need of repair. Additionally, Pluto rules investigations and surveillance.
However, it is the April 29 Saturn station (going from direct to retrograde) that has a stronger correlation to reversals in financial markets. Saturn demands accountability, so the idea that the Mueller investigation has ended is probably not correct. It may instead just be the end of the first act, with more investigations about to be launched – and they may not pertain to only Donald Trump. Saturn has to do with the past. It may seem as if the whole 2016 election is returning, like an updated version of Bill Murray’s “Groundhog Day.” With Mars also square Neptune (April 27) right in the middle of these two retrogrades, we will once again be challenged to figure out the truth, because under Neptune, you can’t believe what you see, hear, or read. The truth is within your own inner being. It’s not coming from the outside.
Here is the link to the above since I messed it up .
https://mmacycles.com/index.php?route=blog/article&category_id=1&article_id=247
Very insightful comment about more investigations. The real reason the Dems are screaming about seeing the entire report is they want to find out who and how many of their number is going to jail because of what Mueller unearthed.
These people are stupid!
A new weekend post is live: https://en.wikipedia.org/wiki/Galileo_Galilei
Taking the money and running on INTC.
The island reversal played out nicely and paid huge today.
Thanks Joe! (and Peter T!) 🙂
This website is for educational purposes relating to Elliott Wave, natural cycles, and the Quantum Revolution (Great Awakening). I welcome questions or comments about any of these subjects. Due to a heavy schedule, I may not have the time to answer questions that relate to my area of expertise.
I reserve the right to remove any comment that is deemed negative, is unhelpful, or off-topic. Such comments may be removed.
Want to comment? You need to be logged in to comment. You can register here.