
I started out today planning on creating a completely different post having to do with our biggest problem in today’s world—usury. It’s led to a finite few gaining financial control over the world to a point that they have been dictating the narrative for almost a hundred years. Well, longer, actually. But it’s easier to dwell on this most recent period, from the creation of the Federal Reserve, which was the lynch pin for the Rothschild-based banking cartel getting their tentacles into virtually every other aspect of the economy around the world.
Since 1913, for example, the western nations have experienced inflation of 2400% (that’s the same thing as saying our dollar is worth 4% of its value back then). Since as recently as 1974, inflation has risen 500%. These are figures that are hard to beat historically.

Right after I published this chart, zerohedge posted a story about the elephant in the room. The cited a statement by Fed. Gov. Jerome Powell: “Low rates can lead to excessive leverage and broadly unsustainable asset prices — things that we watch carefully for and do not observe at this point.”
The US stock market since 1974 (in Elliott Wave terms, bottom of the fourth wave of the terminal five-wave rise we’re finishing off now), based on the DOW performance, has risen 4000% (or 40 times its value at that time, of about $500.00). The value of money and of assets (including paper assets, like shares) is going to start heading in the other direction (deflation). It can be argued that cash has already turned the corner. It won’t be long before everything else follows.
I can make a very good case that the acceptance of usury throughout the West runs in cycles that parallel natural cycles of varying lengths. I’ve been able to tie its rise and fall, along with economic change, to each 500 year climate cycle. But, we’ll save that blog post for another day. I mention it here only because it’s the backdrop to the “War on Intelligence” that’s playing out in the mainstream media.
I should stay away from television talk shows on Sunday mornings!
The Liberal Media’s Lack of Objectivity
My achilles heal of turning on the tube to watch Meet the Press is a double-edged sword. I watch to get a sense of what the public thinks of US politics at the moment, but it seems to be so far removed from reality right now, that I find it difficult to watch. This morning was another great example of the blindness of US mainstream media.
Chuck Todd, the host, was surrounded by the usual Hillary-enthralled pundits with one exception, Rick Santelli, who broke rank to suggest that perhaps the current propaganda storm against Russia was based on conjecture only. Oh, heresy! And, of course, it sparked a very small twitter reaction, which you can also read in the article here. Make sure to also watch the full interview with Kellyanne Conway at the bottom of that post.
What’s stunning to me is that this show can be so out of step with the perception of the American people, as a recent poll of 84,000 of them shows. The overwhelming majority (83% to 17%) believe Julian Assange over the US intelligence establishment. At least it restores my faith in the intelligence of the American populace and reinforces the current movement of the “revolution dial” that I’m so sensitive to. We’re so obviously near a top.
It’s going to be interesting watching the lights finally come on in the mainstream media. I think the lights are well on at the top, but down on the ground level, with the troops who are the news readers and hosts, judging by the jaws dropping during today’s show, they seem to me to have bought the narrative of the elites hook, line, and sinker. I find that stunning.
After all, they have the same access to the internet that I have.
However, their perception will change. Oh, how it will change …
As a result of this bombardment of my senses this morning, I sat down and concentrated on listing alternative news sites for anyone interested in knowing what’s really going on out there. You’ll find them on my links page here and this afternoon I’ll put a links list in my sidebar so it’s more readily available.
I’ve also added a few recent books I’ve read to my list of recommended reading here.
The Cracks are Starting to Show
From my list of predictions from last weekend, I was pleasantly surprised to see movement in some of them. The questioning of the legitimacy of the U.N. (Israeli and Filipino leaders) has hit the headlines, as has a move to audit the Federal Reserve (Ron and Rand Paul). There’s actually a bill now introduced in Congress, which may have legs.
The scary part is that this action is way too late to have any kind of positive affect. Once the market starts down, the dominos will start to fall very quickly and neither the Federal Reserve nor the government is going to be able to act quickly enough to stop the financial and social destruction.
I also expect the US medical system to completely implode. I say that because I’m worried about our medical system in Canada, which I’ve relied on for a full 50 years now (not of my own choice) and is considered a relatively stable system, relative to the other government-funded systems around the globe. The US system is already starting to fall apart (not that it ever was a great shape), so I expect the worst very early on in the market drop.
The move to shut down cash will ultimately fail. We see the terrible effects the Indian attempt to limit cash is having on their economy. It’s melting down quite rapidly. It’s time to start thinking about squirrelling away a bit of cash for the short to medium term. I’m convinced the India experiment is just that—perpetrated by the banking cartel—and it’s not going well. But the attempt to limit cash is bound to have its influence in other economies as the banking cartel’s fear increases.
Credit will eventually be the bigger issue. When we get into 2018, I believe credit cards will begin to shut down. We have an economic and financial system built on debt and when deflation hits and the market starts down in earnest, it will only be a matter of time before mortgages default in the thousands. It takes a while for them to work through the system, but eventually, not only will the amount of debt balloon, but the effect of deflation on the value of money (it increases) will cause debt to explode. Watch for more bank failures than ever before, but I think the beginning of 2018 is when the fan will hit to the point where it will just grind to a halt.
Thank Goodness for Cycles
My fascination in all this is the fact that nature has a natural process for cleansing the world; washing all the crap off the fan and bringing the human race back to reality. It’s happened so many times before and the parallels are compelling.
The Gutenberg printing press was invented about 1440. The internet network began in the 1960s with the development of Telenet. That was 520 years after the printing press changed the world. The Renaissance and Reformation followed shortly thereafter. The masses in both cases were given access to more knowledge than they’d even had before. The “Great Financial Revolution” as I dub it, has already begun but we’re going to see it up “close and personal” starting in the next few months. The truth is going to win out over any attempts by the elite to form a New World Order. (yes, it’s still portrayed as a conspiracy theory in Wikipedia)
We already know that we humans are affected by exogenous forces. Electromagnetic waves affect us on an ongoing basis; the science is there. The moon regulates our biological clock, which is based on a 25 hour day (on revolution of the Earth). Women experience their menstrual cycle based on a 28 time frame.
The lunar nodal cycle at 18.5 years roughly is a rainfall/drought cycle and the real estate cycle, which I’ve written about here. Wars have cycles. The Elliott Wave Principle is a cycle. Many of you trade by lunar and other planetary cycles. Data tells us the month you were born has an affect on your life span. And on and on and on.
People the world over are waking up. As the climate changes and become wet and colder in the short term, they will act to create major social change around the planet. That’s born out by the history of cycles since the beginning of recorded history.
These are exciting times, but also a time to prepare for the challenges along the way. It’s time to plan for winter: food, water, money, safety, and shelter from the elements (natural and otherwise).
Market Timing
I was asked the question in the past two days about the next wave up in gold and how long I thought it would take. After reflecting on the pattern that we’re in the midst of right now (an ABC corrective wave), it occurred to me that the answer will probably serve as a time guideline for the larger US market in terms of the drop we’re about to undergo.
Gold is just finishing the B wave of a three wave corrective wave pattern. The A wave took 8 months to trace out, while the B wave (not quite done yet) looks like it will take 6 months. The C wave should be at least the same length as the A wave was and should last at least as long. So let’s give it 8 months, as well. That takes us to near the end of 2017 for the first set of waves down in the US market (ending at about the 50% level from the top), if they move in tandem, which I expect to a great extent, they will.
___________________________
Projection for a Top
Based on the ending diagonal we’re currently in (which is the pattern playing out in all the major US indices), I’m still projecting a final top to our five hundred year set of Supercycle waves early in the New Year. It will take a topping of the third wave of the ending diagonal to give a more accurate prediction of the date, as the fourth and fifth waves should take longer than the third wave by at least three quarters. The third wave up has taken 8 weeks so far.
NEXT Federal Reserve Annct: February 1, 2pm EST
______________________________
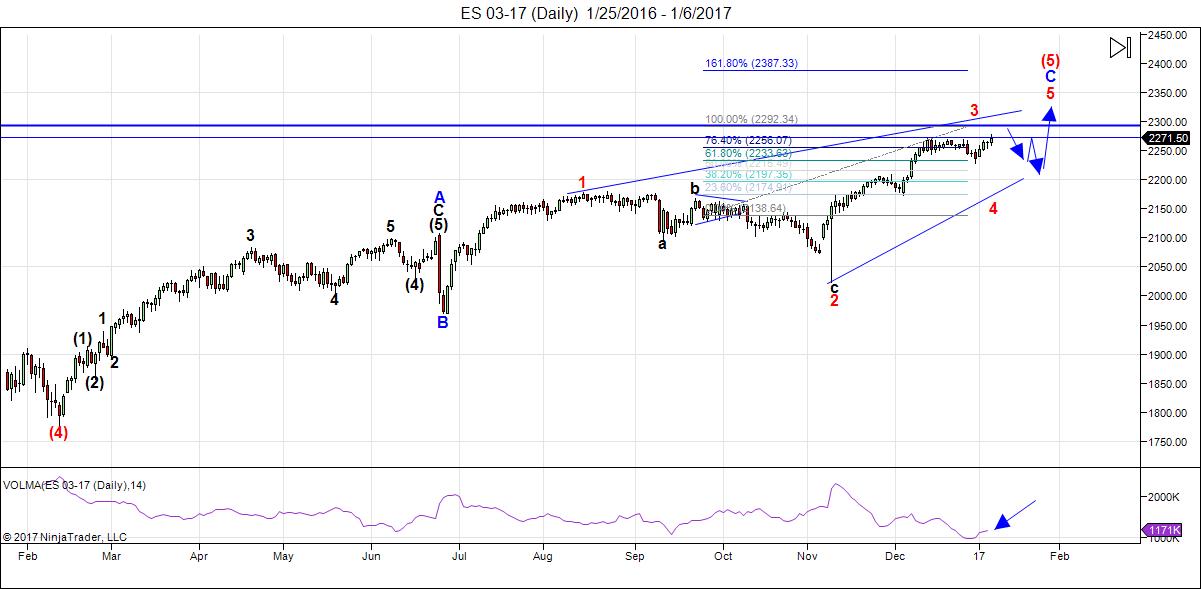
Here’s the latest daily chart of ES (emini futures):
We’re still heading up, but we only have one subwave to go. On Friday, December 30, 2016, ES traced out the end of an expanded flat (a 3-3-5 configuration) and then an ending diagonal at the tail end of that. It was a dramatic end to a B wave and I made the call that we were going to a new high. We’ve reached that high, but we’re not quite done yet. We have another subwave to go before we complete the third wave of the ending diagonal.
Through fibonacci ratios, I’m projecting a possible top for the third wave of the ending diagonal for ES of 2292.
Note the extreme drop-off in volume for this wave (it’s the purple indicator line at the bottom of the chart). Volume is almost none existent. It should surge in the fourth wave down and we should get a volume surge during the first part of the fifth wave.
Here are the rules going forward:
- Wave 3 must be shorter than wave 1 and reach a new high.
- Wave 5 must be shorter than wave 3 and reach a new high (usually it does a “throw-over”—extends above the upper trendline defined by the tops of wave 1 and 3, but it is not necessary.
- Wave 4 must be shorter than wave 2 and must drop into the area of wave 1.
- All waves must be in 3’s (zigzags).
- The trendlines of the ending diagonal must converge.
Summary: We’re completing the third wave of the ending diagonal before zigzagging to the top of the largest bubble in history. I expect a sharp drop in wave four of the ending diagonal perhaps later this week. The long awaited bear market is getting closer.
Good trading!
___________________________
Sign up for: The Chart Show
Thursday, January 12 at 2:00 pm EST (US market time)

The Chart Show is a one hour webinar in which Peter Temple provides the Elliott Wave analysis in real time for the US market, gold, silver, oil, and major USD currency pairs.
Get caught up on the market from an Elliott Wave perspective. You’ll also get Andy Pancholi turn dates for the balance of the current month. There’ll be a Q&A session during and at the end of the webinar and the possibility (depending on time) of taking requests.
All registrants will receive the video playback of the webinar, so even if you miss it, you’ll be sent the full video replay within about an hour of its conclusion. For more information and to sign up, click here.


Peter,
Just seeking clarification….Red 3 is will actually finish to the right of where you have it placed on the chart above that is included in today’s update. Is that a correct assumption on my part?
Then Red 4 will be 3 waves down toward the low 2200’s…Is that right?
That will be followed by Red 4 up finishing the Ending Diagonal…Is that right?
The positioning of Red 3…Is perhaps confusing me!
Regards! Thank you for your work!
Yes on the finish of wave 3. I just hadn’t moved the number over from last week’s chart (and I’ve had computers crashing all day, so it won’t likely change all that soon, unfortunately).
After wave 4, it will be wave 5 up to finish the ending diagonal.
Should have typed that “Red 5” up (not Red 4 up) will complete the Ending Diagonal!
Peter, you suggest keeping some cash on hand. What do you think of crypto currencies particularly bitcoin?
If one uses coindesk’s chart, ATH was 12/4/2013 at $1,147.25 then plunged to a low $177.28 on 1/14/2015.
The low was retested 8/24/15 at $209.13 then climbed its way to almost reach 2013 top on 1/4/2017 at $1129.87.
It’s amusing to note that the low and high dates I mentioned has the number 4 on the day of the month.
Liz,
I’m talking about some cash to buy food and things like that. If there’s a bank holiday as there was in the 30s and recently in some other countries, and credit cards freeze up, you need something around just to get by … that kinda thing. I don’t see that happening for about a year, but who knows …
I see bitcoin as an investment or trading vehicle at the moment rather than a widely accepted currency.
Hi Peter
Still reading your update yet thought I’d mention something .
Back in 2007 the banks lowered people’s credit limits to just above
Their balance , at that time had you simply made the minimum payment
The interest alone would have put you over your new credit limit
Which then caused an over limit fee . On top of that , because of that
Change to a person’s credit limit . People’s credit scores dropped because
Their debt to available credit ratio spiked giving the impression people were
Maxed out . Back then I called the credit card companies and asked them
To raise my available credit back to were it was . They did so yet that was not
The case for just anyone . Some people’s credit scores dropped from
820 levels to 600 levels because of that change alone .
If your correct about credit cards then I’d expect initially the same type
Thing to happen again .
So I’d assume credit scores to plummet just by that action alone .
Joe
Thanks Peter, your correspondence is again very informative and thought provoking. The business media rarely takes a doomsday approach, they are funded by the broking houses who need ‘blue sky’ commentary to drive revenues. Similar culture was experienced in the banking system where positive news drives business – primarily based on lending money to make money. Only rose coloured glasses are mandated in business media and banking!
Always look forward to your weekly commentary, keep up the good work!
Thanks. Lol … most people would think being negative about the future isn’t a good thing. I guess that comes from being a sailor. I have a “healthy” respect for Mother Nature.
Peter,
Great write up, and I can identify with your frustration of the continued manipulation of information. I find it mildly amusing that recently we have been introduced, by the media, to the fact that there is “fake news”. Well, I am so shocked!, shocked I tell you. Who knew that there was ‘disinformation’, ‘fake news’, ‘distracting from the real issue news’,…going on! Two words – Global Warming. Seriously, am I to believe these media people, who wittingly or unwittingly, have not been engaged in it for as long as I have been aware of my existence? This last election cycle, I did an interesting experiment (on me). For as long as I am aware, I have been interested in politics. A News Junky. But in the last several years my frustration at stupidity was significant, and I was concerned that it was negatively impacting my perceptions of markets (not to mention life in general). So I decided to tune it out, or at least cut back significantly (that is hard to do), to try to significantly reduce news review time. I have limited my sites that I review to about 4. Although it is very hard to not get caught up in the onslaught of information, I have found this approach to be beneficial. There is definitely a diminishing rate of marginal return on information, and after a certain point the only aspect that is impacted is my attitude. It’s hard to know where the line is, but in my opinion its definitely an issue. Now, I limit my sites, and I try to get some variability so that I am not in an echo chamber.
Steve
Steve,
OK … that makes two! lol. A good start.
I read a lot of books on history, which keeps me grounded. Mainstream media is seriously hard to watch. Everything is breaking news and a drama. It’s info-tainment. Heavier on the tainment.
Oh … and I shovel snow … jeez.
alphahub @alphahub · 19h19 hours ago
Back to markets … VIX downside reaches ‘Demark’ exhaustion. 13th in last 10 years. Avg upside return 97% within avg 35 days last 12 times:
Dave,
Help me understand your! Are you saying that the VIX has exhausted itself on the downside? Next expect a rally in the VI !
Hi Ed. Yes you are correct.
WOW, its awfully quiet here today, Is it the Calm, before the storm ? LOL
Dave, I’m wishing for a gap down and a complete fade to test 12/30 low or better yet 12/7 low. 🙂
Hi Liz. I hope it works for you. I am still looking for a temp low Jan 19th – Jan 20th. Good luck to you Liz.
Trading Proverbs
“Time is more important than price. When time is up price will reverse.”
– W. D. Gann
An old codger once told me that wages caused inflation. I looked it up and he was correct. Think about now, mimimal inflation with huge monetary creation but low wages there was going to be inflation in the 20th century. 1st the biggest 2 wars in history. 2nd, in spite of the wars plus the Great Depression, we had the greatest growth in history. The world was transformed. The country was electrified, tremendous direct and ancillary growth. Switched from horse and buggy to auto and airplanes — think infrastructure roads bridges airports and oil to run the whole thing. Tremendous population growth which required an unbelievable building boom. With or without the Fed Reserve, wars plus prosperity (unprecedented prosperity at that) = inflation. Oh, I forgot the computer and internet. Any person or central bank or gold standard that even tried to stop that tsunami would have been swept away. That is not to say usury is not a huge problem. Those 20+ % credit cards and 25 % subprime car loans, ridiculous. It will bring down the system, but when? The Fed had to accomodate the growth of the 20th century, they are omly a part of that “problem”.
Andre’, it looks like your call for 1/9 high and perhaps that 1/20 low has a chance to be prescient! Great work! You are certainly appreciated!
Maybe,just like June 24 and 27,we see a spike down following Joe’s predictions for Januari 20?
You can feel the energy in the air something is brewing…
Think about this, since ’50, if #SPX up >1% first 5 days of yr (like 2017), the entire yr has been higher 88% of the time (23 out of 26).
Put/Call ratio is 76%. If it closes here would be lowest since 12/8 (the day the RUT made its high)
#Venus is planet of #Advice & Counsel, Neptune planet of #Deception. Venus+Neptune conjunction this week = #Deception from advisers
Put/call ratio climbs to 90% We are getting to extreme now.
We may be flat into the weekend. Most highs come on Monday. From next week down into the lunar eclipse with a low high 1/31. This is part of the first leg down into early may. I fully agree with Peter that this is a Multi year bearmarket.
Some major cycles are turning this week. But I see a high 14/15. This keeps the market from falling.
20 low.
Andre’,
Sorry to always be seeking clarification…but you are still seeing a 1/20 low,..so what is the 1/31 high low? Is that a high coming off the 1/20 low accompanied by a reversal down perhaps on the same day?
All that is then followed by a move into the February 11th linear eclipse?
Thanks in advance!
Ed,
Meant to say : lower high. I think we are down into 2/9-10. So 1/31-2/1 should be a retracement.
10 day moving simple moving average of the daily trin
in bull markets you look for a close above 1.40 to give
the oversold signal and a close back below 1.40 gives a buy signal.
the 10 trin closed Tuesday at 1.219 , not into the 1.40 level yet it is
getting up there .
the stochastic on that same indicator tend to peak around the 55 to 58 area
and Tuesday close at 53 is close ( normal readings not extremes )
a peak to peak in many cases is 6 trading days apart , tuesday was
6 trade days from the prior peak on dec 30 .
5 day trin sum ,
you look for oversold readings in a bull market in the 6-7 area
in bear markets you look for 7-9.
the 5 day trin sum ( you add up the 5 previous closes )
counting tuesdays close and going backwards , tuesday monday friday etc
closing numbers ,
1.25,1.61,1.04,1.04,1.04=5.98 close but not an official oversold reading .
on tuesday the 5 day 10 day and 20 day moving averages of the advancers minus decliners
turned on on a down day for the dow , typically that is a bullish signal where i would go
bullish the following day . ( today should be an important day )
2247.70 is key support on the ESH7
19784-19770 is key support for the dow .
a break below the lower levels noted are bearish based on price
yet if we do see a spike down most likely we will also see oversold
readings on the 5 day trin sum along with the more importantly
the 10 day moving average of the daily trin .
Cash Dow has support at 19749.12<—–
to hit that level will give oversold readings .
dec 20 high to the dec 30 low was 7 trade days
adding 7 trade days to the dec 30 low gives
us today Jan 11th .High to Low to Low ?
closing support for today is 19815-19810 on the cash dow.
while 19749.12 is a very important support level a close
below 19810 is considered a bearish close .
Bottom line : im looking to take a Bullish stance again
hopefully today
19788,19778,19771,19764,19761+ averaged =19772.4 cash dow
19755,19750.19749=19751.3 cash dow
mid point =19761.85
range, 19788-19749
recap on 5 day trin sum with more info .
a close at 4.00 gives a very short term overbought reading so
ill repost the numbers for review .
1.25,1.61,1.04,1.04,1.04=5.98 close but not an official oversold reading
the oldest readings of 1.04 will drop off on today’s close and todays closing reading
be be placed in front , as an example only , say today the trin closes at 1.6
the new count would be 1.6,1.25,1.61,1.04,1.04 which would =6.54
and that would be an oversold reading .
on further thought even though i do have a bullish bias i am probably
better served to sit today out or look for the lower extremes to take a bullish
stance .
based on that and with 1 hour before the open
if the dow manages to test the mid point at 19761.85 today ( intra day )
then i will take the bullish trade .
other wise im going to sit out today and get a few things done around the house
and will look at the market after the close and look to trade tomorrow .
the advance decline line turned up on Tuesday with a down day .
that leaves me bullish .
Dow futures support 19784-19770 are presently holding .
im keeping my bullish bias despite the potential drop .
Joe
Hurst was an engineer, hired by a groupr of investors to do statistical analysis on financial markets. Hurst found a dominant 9 year cycle (and 9 months). We know 9 is the number of completion.
The october 2014 low was very significant. and 27 months later – or 1/4th of 9 years- we find 1/15/17.
October 1014 was 3 years after the october 2011 low. So the 9 year cycle seems to be active.
This means 1/15/17 is very significant.
Lows come from the 20 square root 5 week cycle. 20 sqrrt5 weeks from 10/15/14 is 8/24/15, Next 7/2/16, Next 5/11/17. All dates are lows. A low early may is very likely.
Sold all my puts on the whoosh down today. Taking profits while you can since ES 2267-68 seems to be a magnet up or down and as Joe said 19770 provides support for YM.
Nice play Liz. The markets are like a coiled spring. One of these mornings, we are going to find the sp UP OR DOWN 30 – 40 points. The Markets are close to a tipping point. We will soon find out by Jan 19 – 20th
Won’t buy US equities next few days. Looking for 2% decline into early next week.
Kudos to you Valley for playing the Nasdaq stocks.
You are spot on again Valley nice call,are we looking at post full moon selling till monday after that up again?
All the best from AEX…
Thanks, Gents! Reasoning was as follows:
1. We had an up move already
2. Seasonally mid January is weaker than early January
3. Inauguration party approaching, so sell off allows greater rally during party.
4. Full moon Thursday usually marks short term top.
5. Post perigee into apogee is 14 days of increasing lunar distance/energy.
Am still down due to buying GDX etf. in December which was loser. =(
Here’s what the avg yr after an election looks like. #SPX bounces after inauguration, then drops hard in February. https://lplresearch.com/2017/01/11/could-there-be-a-post-inauguration-sell-off/ …
Still maintaining a bearish position. 3 lots of 3x shorts and put options.
I am getting lots of ribbing from some of my fellow traders. They usually know me as a Bull rather than a Bear. They are bullish.
Good luck every one.
Got to love how everyone is conditioned to buy the dips.
That is the conditioning of the mind Pavlov effect.
The bell is ringing on WS, food is served lolol
Looking for a Jan 16 Low.
All the best.
Monday, January 16, 2017 is a stock market holiday in the US…
https://www.nyse.com/markets/hours-calendars
Thks for the reminder rotrot.
Looking froward to Peter’s post Sunday. I think the bull is dead. But the turn will come this weekend. Could be the high for this year.
This very day Israel is bombing Syria, Tillerson (Trump nominee) is threatening China over South Sea islands, Russia’s “hacking” C-span (this is fake also), and now the White House is suddenly worried about a cataclysmic meteor collision…….. What could possibly go wrong over this 3 day weekend ?
Nobama has one week to “fabricate” something bad enough to declare martial law. Also he signed an executive order THIS WEEK to allow the federal government to take control of elections if new elections are needed. Why is he doing all this IF he’s leaving.
Israel chose this week to start bombing ? Knowing full well Russia is backing Syria. Someone wants to start a war and declare martial law.
Did you know we have ALL our aircraft carriers in US ports (like Pearl harbor). That has never happened for obvious reasons. They are always spread around the world. You would have to do that on purpose, again like Pearl Harbor.
Jeff,
Thanks. Next week down. Said this a week ago. But nice to see news following/supporting my forecast. Could be a volatile week!
The cash dow came within a few points of my
buy point i was looking for yesterday
the cash dow 19770.47 low today is now key support.
as long as the 19883 level holds as resistance today
ill look for a decline ( fade ) which places support
in the 19827-19813 range .
a few issues as we go into next weeks option expiry
yet as of now this rally up off the lows looks like
5 waves up .
Im sticking to my bullish bias yet no trades
until next week .
Joe
I think Jan 12th might have been the low and we grind up Tues to Thur.
Jeff
where did you get that info about the executive order about the elections
i did a quick search and found nothing .
The Dow is beginning to look like its forming a triangle .
Wave A took 7 trading days . dec 20 to dec 30
Wave B took 4 trading days , dec 30 to Jan 6th
Wave C Should be complete as of yesterday ,Jan 6 to Jan 12.
This D wave is not clear yet if we are in a Wave D of a triangle
then this is a B wave Down now of an ABC move up from the
jan 13th low .
If i use the Jan 11 high and count 4 trade days i get a low on Tuesday.
if i use the Jan 6 high and count 7 trade days i get a low on Tuesday .
I Hate option expiry weeks and i ve seen many times runs higher
into options expiry weeks.
each swing from DEC 20th to date has been a 3 wave swing .
Once this B wave completes the YM futures should above 19904
yet stay below 19925 . what ever low we make over the next few days
will be broken after the wave D high is complete.
say we see a print low Tuesday as 19765 as example only on the YM
and we see a spike up to just above 19904 then the following drop
must break back below the 19765 ( example ) low to complete Wave E.
The B waves within each leg of a triangle should overlap .
this being the B wave of the abc upward move in wave d
should be retested .
After that new all times highs should follow .
This would be text book
What id like to see is the 10 day trin stay oversold or get more
oversold over the coming days , id prefer a sell off into the close
to give the 5 day trin sum an oversold reading .
Bottom line : yesterdays lows now must hold or this pattern
is wrong as i see it .
look at daily ym futures and you will see the A B C moves
you will see the overlaps . these are normal when looking at
triangles .
Joe
http://www.zerohedge.com/news/2017-01-06/stunning-last-minute-power-grab-obama-designates-election-systems-critical-infrastru
Joe,
Re “info about the executive order about the elections”, I know it was on the Mark Levin Radio Show on Friday, where he did a deep dive with considerable detail and info. It was one of the typical late Friday releases by the administration prior to the weekend so as to avert attention. It is very sinister, but it is so ‘inside baseball’, and certainly not as sexy as most of the fake news that people get fixated on. Hope this helps,
Steve
Correction .
this should read
This D wave is not clear yet if we are in a Wave D of a triangle
then this is a B wave Down now of an ABC move up from the
jan 12th low .
What i tried to explain
shown on a chart .
Textbook diagram shown on the chart .
http://imgur.com/aa6XWbH
Nor much to add. Lat weekend I said markets would be flat next week. And flat they were. Next week will be down. Early next week a significant high will come between Monday and Wednesday. Tuesday seems most likely. Mast cycle I see are down now and this weekend the last one turns. Then we are down into may. The end of Januari will see a high but it should be lower.
As US markets will be closed 1/16 the major inversion this weekend will hit Tuesday. European markets will give the high on Monday, but Wallstreet wants to have it’s own high. So Monday or Tuesday we will see a low and up again into 17/18. But then we will have a high that will last a long time.
No mistake; the market is rolling over.
P.s.
Now think the low will come 1/23. The market will pull up into opex but then down again over the weekend.
weekend humor ( or not ) 🙂
https://countingdownto.com/countdown/obama-out-of-office-20-january-2017-countdown-clock
Hi is anybody aware of why there has been no post from Peter this weekend?
Just a guess…Martin Luther King federal holiday here in the U.S.!
I expect something later today but have no inside perspective!
Boy, tough audience. Ed is right-coming a little later today (I’m working on it). Even though I’m a Canuck, I’m aligning myself with my southern neighbors, who are on holiday yet again … 🙂
Happy you miss me!
A new post is live: https://worldcyclesinstitute.com/feeding-the-deflationary-spiral/
This website is for educational purposes relating to Elliott Wave, natural cycles, and the Quantum Revolution (Great Awakening). I welcome questions or comments about any of these subjects. Due to a heavy schedule, I may not have the time to answer questions that relate to my area of expertise.
I reserve the right to remove any comment that is deemed negative, is unhelpful, or off-topic. Such comments may be removed.
Want to comment? You need to be logged in to comment. You can register here.