
Update Thursday, Feb 11, After the Bell
I’m trying to pass this exercise off as good therapy tonight (I’m not sure it is, but it helps me think through this mix of confusing signals).
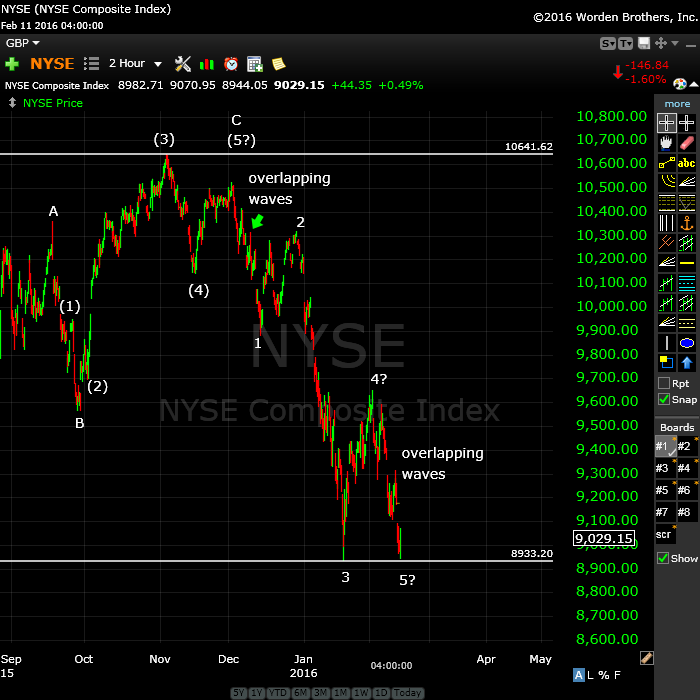
Here’s the 2 hour chart of the NYSE. (chart updated as at Feb 12, 11AM EST) I like to come back to it when the market is confusing, as I find it tells the most realistic story of what’s really going on. It’s come down to a double bottom, which means the overall wave is in 3 waves. That’s a corrective wave.
If we go back to the start of this confusion (Nov. 3), you can see the possible truncated 5th wave up. Then we have a wave of overlapping waves down (not motive), which I’m labelling as wave 1 (until we know better). The rest of the wave down looks ok (there are some minor issues), but when we get to the fifth wave, it’s all in overlapping waves, (again, not motive). So, we’re left with the conclusion that this is a corrective wave, unless the fifth wave is not complete yet.
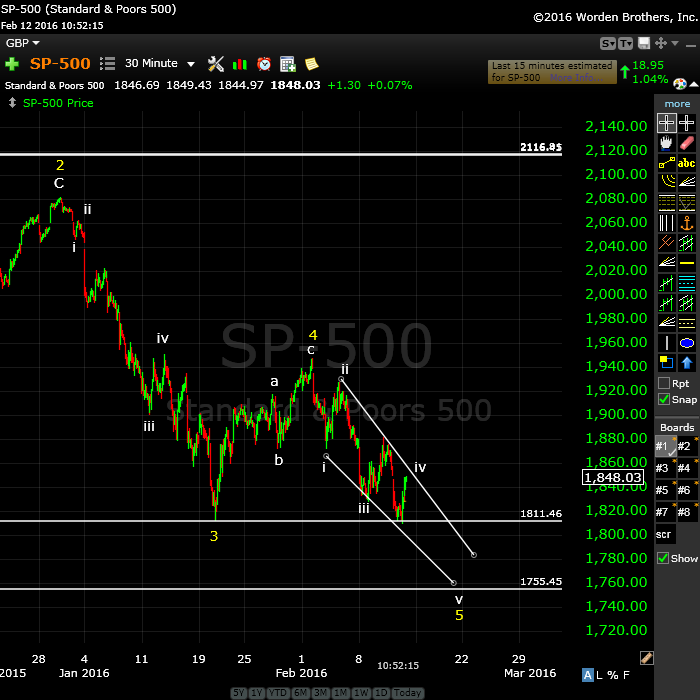
Above is the hourly chart of the SP500. (chart updated as at Feb 12, 11AM EST) It tells a similar story, but when we get to the fourth (yellow) wave, I’ve drawn in what might be an ending diagonal in progress. If this were to take place, it would make this wave down (considering the truncation as real) a motive wave 1. That’s stretching it a bit, but it’s possible.
However, at the moment, the fifth wave as marked has come down to what is essentially a double bottom with overlapping waves, like the NYSE.
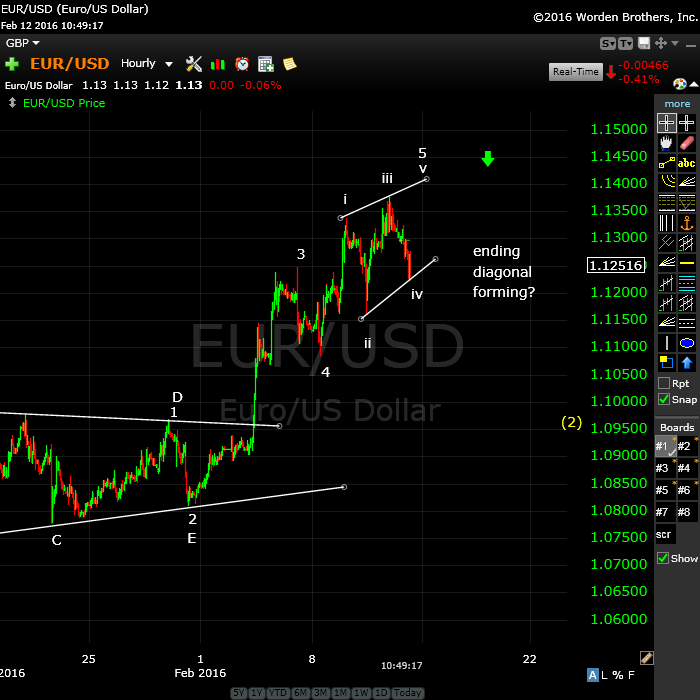
Above is a two hour chart of the eurusd currency pair. It has been moving contra to the market, almost in “lock-step.” You can see what I’ve labelled a first wave up of a large C wave, coming out of a triangle. At the horizontal line (1.15585), this C wave would be 1.618 X the A wave (not shown). It has some distance left to go to get there. This pair suggests that an ending diagonal might be forming. If you’ve been following me lately, you’re well aware of my complaining about all the ending diagonals in this market (I’ve never seen to many!).
If an ending diagonal is forming here, it supports the idea that we’re in the process of one forming in the US indices. If not, then we have more of a corrective looking wave down to deal with, and that would bring up all kinds of questions …
A very difficult, frustrating market, but this is my best shot at coming up with a possible path.
____________________________________________
Update Monday, Feb 8, 11:30EST
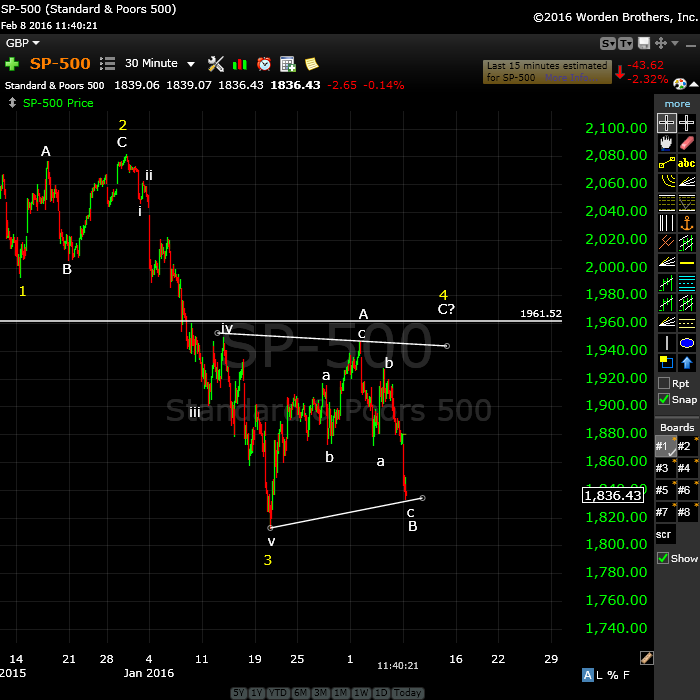
Above is a 30 minute chart of the SP500 showing this morning’s drop. No technical damage so far, we’re still in a B wave, with a C wave up to go.
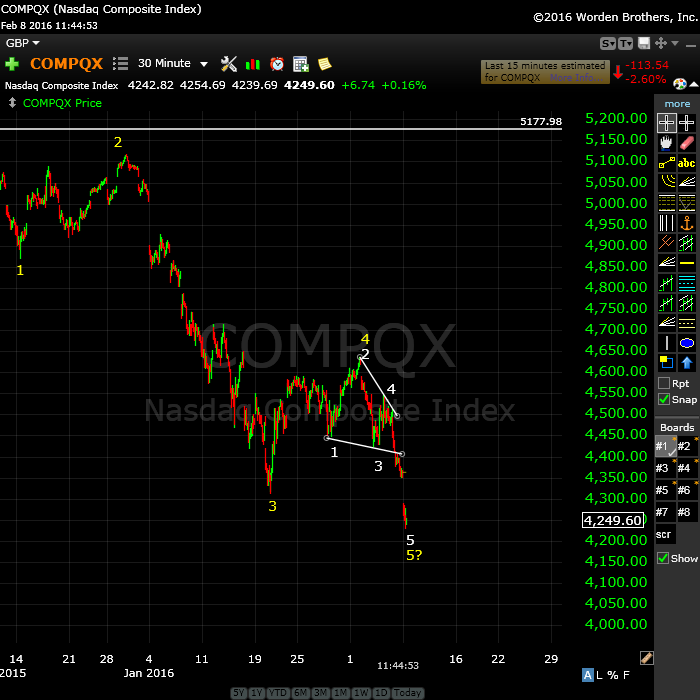
And here’s a 30 minute chart of the trouble-maker – the Nasdaq. I’ve showing the possible ending diagonal 5 wave. If this is correct, it likely means the other indices have already done 5 waves down and that we are in fact, looking forward (again) to either a second wave or a larger 4th to extend the first wave down. I would lead toward the former, but then, this is all speculation until we see more.
_________________________________
Original Post (Sunday, Feb 7):
I’ve been mentioning for months now that the entire market is moving as one entity, the “all the same market” scenario, a phrase that Robert Prechter coined many years ago, when he projected the upcoming crash.
One of the frustrating elements though, is that when the market turns, it takes longer than usual to do so, because the entire world (in terms of the major indices, and by extension, the mood of the masses) is turning at the same time. So, in this report, you’ll see an underlying theme of equities moving inversely in lock-step to the US equities, because … that’s what’s happening.
The entire world is moving to the tune of debt and the deleveraging that has to happen. All bubbles burst eventually and this one is one that will go down in history, because it’s the largest debt bubble in history.
In terms of the Elliott wave count, it became very much clearer to me on Friday, when the Nasdaq “gave away” our current position by signalling a fourth wave with a triangle. I suspect we have about a week more to the upside and then we’ll turn down in fifth wave of the first of the third. US currency pairs should continue to head up when that happens.
Here’s a video overview of the market as at Sunday, February 7:
Market Report for Feb 8  |
 |
Make sure you zoom the video to full size with frame expander (arrows) in the bottom right hand corner and also set the quality to as high as your web connection allows. This is an HD quality video so the best viewing is at that level. |
_______________________________
Here are some charts from the video:
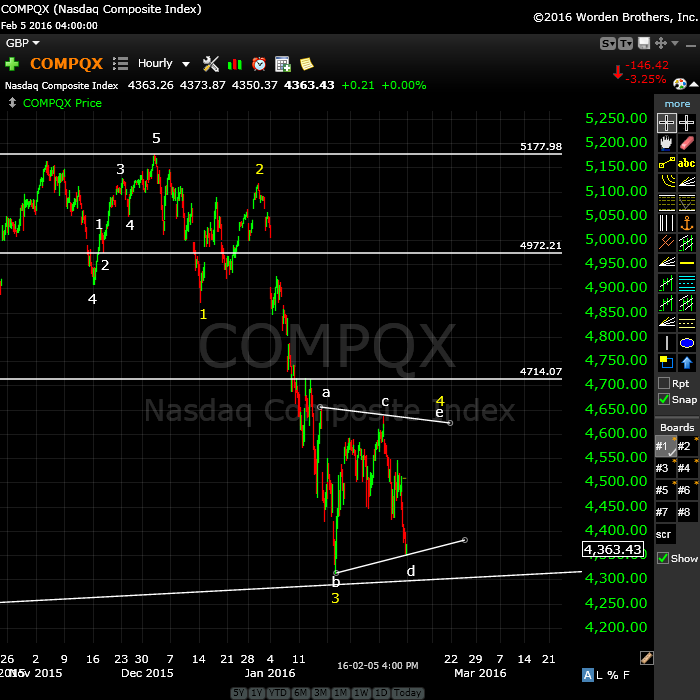
Above is the hourly chart of the Nasdaq showing the five waves down (yellow) and the give-away on Friday of the d wave of a fourth wave triangle. We should now complete the e wave (give it about a week) before turning down into the fifith wave. The Nasdaq is the only US major index that completed five waves up (rather than truncating), so the Nasdaq gives a very clear picture of the path ahead.
Remember that once we get five waves down completed, it confirms the new trend.

Above is the hourly chart of the SP500. I’m showing the truncation here, which is what has made the forecast so difficult (truncations are extremely rare, and in this case signal an exceptionally weak market). The SP500 shows the same count as the Nasdaq (the DOW is similar to the SP500) except that the fourth wave appears to be tracing out a flat (3-3-5). Expect 5 waves up from here to a top somewhere between 1950 and 1961.
We should then turn down into a fifth wave.
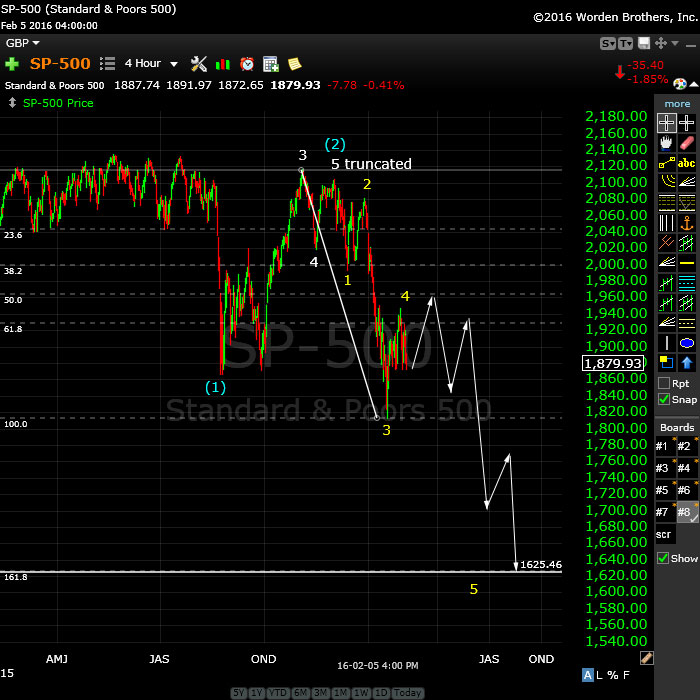
Above is the 4 hour chart of the SP500 showing the projected path for the completion of the fourth wave and then the turn down into a fifth wave.
After we complete the 5th wave, we should head up in three waves to the 62% retrace level. It will likely take at least a month to get there. More on that later.
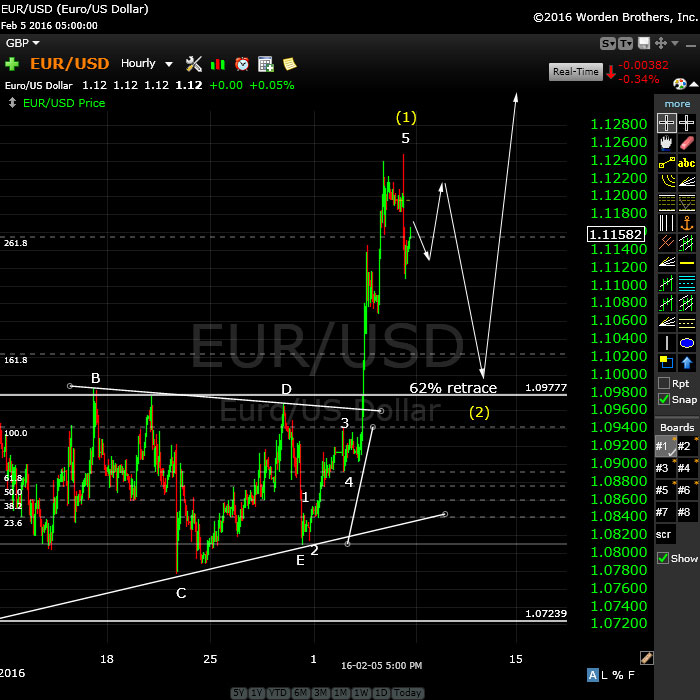
Above is an hourly chart of the EUR/USD showing my projection for the current wave structure. We appear to have completed a first wave up of a large C wave. If so, this will require a second wave retracement before a turn up to complete the remainder of the third wave of the C wave. I have drawn in the 62% retrace level, which I should be able to confirm as this wave progresses.
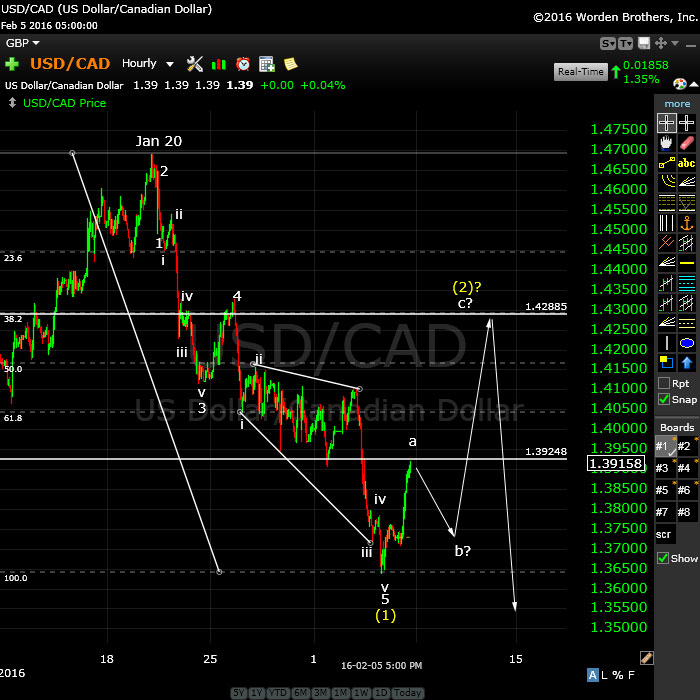
Above is an hourly chart of USD/CAD showing the projected short term path. As I mentioned in the video above, I suspect the retrace to the 62% level (marked by the horizontal line at 1.42885) will take about a week or so as the US equities trace out the projected fourth wave.
This has been a difficult chart to decipher because of the odd triangle configuration of the most recent third wave, but when you keep in mind that currencies are all moving in tandem (revolving around the movements of the US dollar reserve currency), the picture becomes much clearer.
The Forum
My promised forum has been a labour of love in that there have been lots of technical issues and a fair amount of learning at the same time. While you can view the forum by clicking on the link in the post below (in red), it’s not really live yet (you can look but you can’t touch). It will require a log in to be able to post to it and I hope to have this ready to go in the next 24 hours or so.
Here are some of the things it will allow you to do:
- the current market post will automatically show up in the “Today’s Market” section of the forum, so you’ll be able to comment there or in the traditional comments area (the one you use now). You’ll be able to move back and forth with one click.
- post pictures and videos
- carry on personal discussions with anyone in the forum
- post to any of the other areas that you have access to
- access ongoing charts, information about cycles and Eliottwave, Gann, and more much more easily. How up-to-date you keep these areas is up to you. I’ll be overseeing it all, of course, but there is a tremendous amount of knowledge amongst us that I hope will be shared
- and much more
The forum will require a log in so that we can lock out spam. There will eventually be paid areas but the entire forum will be free to all for the first few months. I hope it will be THE PLACE on the internet to amass information about the upcoming depression that we can all benefit from.
In the meantime, profitable trading …


THanks Peter ….nick
🙂
Peter, please study bull and bear flats. from the early 1980s launch, every major decline was a C wave of a bull flat. Now we are looking at bear flats—-IMO what you are labeling as the recent V is a B wave flat. This would mean—-today apparent opening, is the market is already in wave 5 down.
Peter-
With the Nasdaq futures moving below the Jan 20th lows, do you think we are still in a corrective pattern and that this is an extended flat b Wave? Not sure if you have had a chance to analysis yet this morning.
I’ve been watching the Nasdaq, yes, and because of that, I would think we’d be going lower in the other indices. But we may still be in the middle of a move. There is nothing to tell me this is ending,but the waves down are still in 3. So I’m watching to see what happens here.
There’s little to go on until something moves. The Nasdaq is the only index with technical damage … so far. All these final waves are down in 3 waves, so either that means the waves are not complete or we’ll turn around and head up.
However, the Nasdaq doesn’t really have that option. It the Nasdaq is in the 5th wave, then it’s in the third of the fifth but the wave is in three waves at the moment. I’ve also been looking at the option of an ending diagonal on the Nasdaq but don’t quite see one.
Everything appears out-of-sync, so the signals are conflicting.
I’ll just add that I can make out an ending diagonal in the NQ (futures) but not in cash.
SPX PRICE NOW @ 1845
WE WILL HAVE TRADABLE BOUNCE EITHER @ 1828 or 1805
1828 IS NOT VERY STRONG, BUT 1805 WILL BE VERY GOOD SUPPORT … I THINK .
JAN 20TH LOW WAS AROUND 1811 IN Europe
AZ
Based on what the euro is doing (62% retrace here), it might well be 1928. But it’s not clear that the downside is done.
Thanks, AZ. Yes, sorry … just following your lead on this one. 1828.
The euro is doing as forecast, so with a drop here after retracing the expected 62%, it should mean equities head up. There’s a possible scenario that the Nasdaq has completed an ending diagonal, which could be a short wave 5 and that now it needs to either do a retrace to 38% or 62%. I would expect the other indices to follow.
The other indices so far are in an extended B wave.
In other words, maybe the first wave down is complete in the other indices. With the possible truncation, a lot of this is a bit of guesswork at the moment. Way too many “ifs” in this market … sigh.
Peter , did you mean 1828 ?
AZ
Great call, AZ!
I’ve added a couple of charts to the post with a bit of commentary.
Thank you Peter , But I think it is too early to celebrate :-))
I do not think this low will hold for long , this is why I said it is tradable low .
Next low will be very strong
Regards
AZ
Yes, unfortunately, there are several other options for this wave, and I don’t know which one is the higher probability. However, the wave down in SPX from 1947 is in 3 waves as far as I can make out. If correct, this can’t be a fifth wave. It has to reverse before a new low. That makes it a flat (3-3-5) by the looks of it.
The next support level for SPX that I have is actually 1825 (a 1.6 extension of the a wave from 1947). When I was looking at your call, I was looking at ES (it hit 1828 almost exactly), so I think we have more downside before this wave bottoms in SPX. But that doesn’t mean the scenario I posted is wrong (it’s highly speculative, anyway).
I’m going to be in and out today, so I won’t be around much until the close. Hopefully, we’ll have some more info by then.
Peter , We got our 1828 ( exactly 1827.5 ) , and then we had a big move up.
I think this low should last few days now , and then we go down again toward 1805 , which should give us big support , if we reach that level 1805 by first 10 days March , then we might have a good support for few months .
first 10 days March will be 7 years from Major March 2009 low .
Regards
AZ
AZ-
Not sure if you have mentioned in on a previous post before, but where are you getting 1805?
Ted
I do not use EW in my work , but I like to read Peter’s count , which I have found to be the best that I have seen over the last 20 years.
I use simple line work & Andrew’s Pichfork .
I can’t post my chart here ( Technically ), but I will try to explain my method here below , and please try to copy my work and see what I am trying to say.
– Draw a line from July high 2015 to Nov high 2015
– Move that line to all major pivots , and you will find that the price will react to that line .
– If you place your line on Aug 24, 2015 low , then you would find out the line would catch the low on Jan 20th
– If you place the line on Aug 26 , 2015 low , then you would get the price of 1828 of today
– I do not feel Aug 26 low was important pivot , thus today pivot will be weak.
– If you place the line on Aug 24th , 2015 pivot again , then you will get 1805 or lower few more points .
– If you place it on Oct 2014 low , then you will get 1750 – 1760 depending when we get there .
1750 – 1760 is a very important level, and I do not think we can take that low very easily , but if we do , then that will be the end of the bull market for years .
I am using SPX European prices , which might be some difference in prices than SPX cash in the US Market.
I hope you can understand my method with my simple English :-((
Regards
AZ
AZ – I tried to follow your directions, but i don’t think i got it. see link for my attempt.
http://invst.ly/11yri
BTW – you can also attempt to make a link of your own chart by using
http://www.investing.com/
just click on….
major indices
S and P 500
charts
streaming
select your time frame
use the edit tools – line, fibo, or pitchfork, among others – to annotate.
when you finish your chart, click on the ‘camera’ icon and be patient….
it will create a link to your unique chart that you can copy and paste onto this Forum page.
I would love to see your chart – try it!
amb
I’m nursing some dental surgery tonight or I’d like have the forum live … which will allow you to post visuals. I’m “coasting” tonight on pain killers … haha.
amb
Thank you for trying to teach me how to use the tools to post my chart , but there is a saying that apply on me , and that is ( you can’t teach an old dog new tricks ) !!
I have posted Peter copy of my chart , and asked to please either he email it to you directly or to posted here on the forum / blog, where you can see it clearly .
I have added two more lines which shows where our next resistance might be
Regards
AZ
amb,
Here’s AZ’s chart: https://worldcyclesinstitute.com/chart-from-az/
Thanks AZ
Ted,
Here’s AZ’s chart: https://worldcyclesinstitute.com/chart-from-az/
AZ- I made more attempts with your lines charting and have achieved better success. I was using too small a chart, which apparently distorted my lines. I found using 4 hr bars in a larger chart provided better correlation to your chart. Very interesting technique…..Thank You!
For some reason it seemed to work better with SPX than with es; don’t know why.
amb
http://invst.ly/124yo
amb
Well done , good work.
Do not forget to include the line from Oct 2014 , that line is a very important , which I think will stop the sharp decline coming .
Regards
AZ
Thanks, AZ,
Just back and it seems we did as expected from earlier today. The only count that changed today is that of the Nasdaq and so my posting of this morning seems the most likely scenario to me. We’re still working on that 4th wave (although, because of the Nasdaq, we’ve opened up the possibility of a second wave retrace). I also note the possibility now of a 4th wave triangle in the SP500.
SPZ, DOW, NYSE and smaller cap industries all back up the B wave scenario. I note that IWM has completed a full first wave down (it looks like it needs either one more very small wave down or it’s also done an ending diagonal). In any case, the next significant move is a second wave. That supports the B wave scenario, as well.
In my mind, this gives the second wave retrace possibility a higher probability. Based on the strength of the move up at the end of the day, I’ll be looking higher.
in ES, this wave should get us to at least 1880 (1.618 X the first wave up).
2nd wave retrace here to about 1838.
I’m concerned that this morning’s wave up was in three waves, so be very careful about watching for a turnover. This latest wave up is also in three waves in ES.
But in ES, the wave down was also in three waves and it is a corrective wave up. It’s just making me a little nervous.
SPX appears to be in a triangle and may need a last leg down before it breaks to the upside (hopefully), but it’s really slowed down progress. That’s the reason all the waves are in 3’s I would guess.
Worst fears for ES … but the C wave equals the A wave at 1829, so maybe that will be the bounce line.
I put the euro near the top of a 5th wave (looks like another ending diagonal). It’s been fighting equities this morning and if it turns down (based upon its recent contra relationship with equities), equities should turn up.
Counting the euro complete, ES looks to be in a double second wave and turning up, USD/CAD should be heading into a third wave, I think.
I’m changing my tune on USDCAD. It’s at a 62% retrace and I think it will turn up (remember the chart’s upside down to other us currency pairs) and complete a second wave (in other words, follow the euro) as per my original posting – it’s right on track.
The reverse chart sometimes throws me … 🙂
We’re looking better in equities. Some 5-wavers happening, so we should continue up.
Thanks Peter, your commentary has been helpful.
Thanks, Ted.
I’ve tried to be a bit more active today, as it’s a fairly big turning point for both equities and currencies. If I’m right, this should set us up for the rest of the week. 🙂
PETER
SPX IS AROUND 1855 NOW ,IF WE BREAK TO THE UPSIDE , THEN I DO NOT SEE US GOING ABOVE 1900 AND WE SHOULD GO DOWN AGAIN . WOULD YOU AGREE WITH THAT ?
REGARDS
AZ
Maybe for a b wave, but we eventually have to get above 1950 in SPX.
I just measured–this wave 3 up should take us to about 1890, so maybe that’s what you mean. Then waves 4,5 and then a b wave.
That’s SPX.
Yes , Thank You
AZ
Peter-
Do you think we completed wave 3, about 7 points short of your target, and are now in wave 4 or do you think this is wave 4 of that 3
Wave 4 and we’re heading into wave 5 with a target in ES of 1890-5. That should complete the A wave, then we should have a large B wave.
Right now we’re actually in 3 of 5 of A.
Ted,
I think this is still a fourth wave. Countertrend trading in a bear market like this is absolutely brutal. I think there’s still a 5th wave up here before a deeper retrace.
If i have my lines drawn right that last surge down looked like the end of an e wave that did a throw over below the support line. Hopefully we can see this fifth wave start.
It looks like the euro is just completing a double top so ES should turn up momentarily.
Well, the euro is just ugly. I think it’s now headed for 1.13 but that’s guess (C wave 1.6 X A wave). Until it stops, it will keep downward pressure on ES.
Well, I think this is the B wave. We must have done 5 wave up and completed the A wave. That makes sense to what the euro is doing. I only expect a Large C wave left from it and that may be all we need to take ES and SPX up to the eventual target at 1950-60.
ES is at the 62% retrace level now.
The top looks like it’s in for the euro, so we should start heading up in ES. This should take us into a five wave C wave up. The final target is questionable, but the euro should help in that regard (as it’s got a C wave coming, too). SPX could be in a triangle. So if that’s the case, we won’t get a new high, but otherwise, we should get up over 1950. We’ll have to see how things shake out.
I can certainly see this as a b wave. With how short this seems to make the A wave, it makes me anxious that this last overall C turns into a double zigzag of some kind and that we are just in a W wave.
How does that scenario look with currencies? Also, how often do double zigzags occur?
In ES, the A wave got to ~1877. I was expecting 1885, so it’s not short by much. Also, SPX/ES may be in a triangle and if that’s the case, the target is not a new high. A C wave now in ES at 1.6 X A takes us to 1935, which may target a triangle. We could also get a fourth and fifth to go a little higher. But I don’t think a second wave is in the cards.
I would guess at a Monday turnover perhaps. It took us a while to get this far.
In the euro, I would expect a 5 wave scenario as well, as it’s the C wave of a 3 wave second wave.
SPX: Note that the 1881 high today has gone into the area of the first wave (the bottom of which is 1872 and change) which means that the sequence of waves down from the high of 1947 cannot be a motive sequence of 5 waves. It is corrective due to this very obvious overlap – a very strict EW rule. Waves 4 cannot retrace into the area of wave 1.
I mention this as there might be a pop quiz after class … 🙂
Thanks Peter. You are an excellent teacher. For the strict EW overlap rule to apply – is it enough for SPX to exceed 1872 at least once today, or must it also close above 1872? Have really been enjoying your guidance through these twists and turns, and am very grateful to you.
Thanks, philiplgs,
It just has to do it once at any time – the close has nothing to do with it. We already knew this was a corrective wave because the first wave down was in three waves, but this overlap just confirms it. Always nice to have several indicators pointing in the same direction.
In ES, we may only get to 1885 before we have a retrace. Doing some measurements, from there a 62% retrace down will set up for a C wave of 1.618 the length of the first wave and target 1960 or so. The previous 4th wave is at 1885 and that seems a more realistic stopping point for this wave.
We’re swimming upstream in indices this morning, fighting eurusd. Eurusd dropped this morning, allowing us indices to head up ,but eurusd is trying to do a second wave retrace to 1.27 (and it’s almost there). Once it reaches that point, the us market will be free to complete this wave up.
Then eurusd should go into a c wave to work towards its lower target. I find it interesting to watch these two go at it, although at times it does my account absolutely no good at all.
When they’re in sync (counter to each other) things move much more smoothly.
Sorry, that eurusd target is 1.127
1845….61.8 retrace in Es…time to go up?
We’re definitely close. I can’t give you a bottom number. I’m watching the euro and it looks to have topped or it has one more very small wave up to go.
Well,
ES has done a new low
Dimitri,
It’s difficult to know what to make of this market: NQ has a new low, but ES, and YM don’t. So we are still in a corrective wave in those indices until we get a new low. And we have overlapping waves in the end waves.
So the only possibility for a complete wave at this point is an ending diagonal. Or the market is telling us that all the indices have a full wave down complete. Hard to know until we see an open. Euro looks to have done another 5th wave (didn’t expect that), so it’s looking like it’s overripe to correct (and send indices up from here?) We’ll have to see where everything opens this morning.
What a frustrating market …
So … to continue that thought … if we drop here to a new low in SPX and DOW and then turn around and head up, that would suggest that five waves are complete. But it’s the internal count that’s in question.
Correction: The Nasdaq isn’t at a new low, either. SPX and DOW look still like triangles. We have to wait and see what happens.
NQ has moved up past the previous 4th wave, suggesting that we’re indeed heading up. And now, so has ES.
But we could also tag the previous fourth wave and head back down.
It either finished 1.5 today, or the B wave but looking at some major EU Indices, we would have an expanded flat with a B wave at more than 161,8%, is that even possible??? Now I am in doubt, 1.5 today done and a big mama 3.2 is coming up for some time or, we are now going to see 3.2.C (and we finished 2.B today) as I have been saying all along…
Cheers,
W
It’s got to be the strangest market I’ve ever seen. It won’t go up, it won’t do down. Eventually, it’s going to have to commit to a direction …
It seems that robots know all the basic EW rules and just specially break them in order to f.ck as many traders as possible
Yeah, doesn’t it! There are SO MANY conflicting signals, it’s incredible.
I can only guess that we’re looking for a bottom, since we’re hardly moving. Where we bottom makes all the difference in what happens next.
What’s concerning here is that SPX looks like it’s trying to do a double bottom here. If that’s the case, this wave down is not motive and in fact, has come down in 3 waves. We’ll get into the possibilities of that interesting move once we see if it happens, or not.
The final wave down so far is not in five waves. The Nasdaq is really in the same position, as even though there are 5 waves down, the first wave was not motive.
There may be even more twists and turns coming to this story …
And the euro appears to be topping, So this latest development is changing my view of the world rather profoundly. I guess the bull market is not over. This whole wave down can only be considered corrective, if we hold here, which it appears we’re going to do …
Peter—Confusion reigns supreme. Seems like it has felt corrective rather than impulsive most of the way down. I am not an EW type, so I will put this in the form of a question. Looks to me from the Aug high we have a 3-3-incomplete 5 for C….do not know the rules well enough to make a credible conclusion? This would set us up for one hell of a surprise…..to the upside? The bears are talking about 2008 all over again, Deutsche Bank is today’s version Lehman. Markets are NEVER that easy. Just makes me wonder?? Gary (Denver)
Haha … you’re right about that! There are so many ifs right now. I’ve never seen such a confusing market. The last set of waves down is the most confusing part to me.
What you’re alluding to is the truncation, if it is indeed that. Yes, it’s a flat (3-3-5) with an incomplete 5 and that’s what’s throwing this whole structure into question.
But I also look at the Nasdaq, which topped properly but the first wave is overlapping, so it’s not motive, either. As a result with have all the indices with corrective waves, in one form or another. You’re right, it could be a surprise to the upside (and now we’ve rocketed off the bottom all of a sudden). Stranger than fiction …
Something will happen to provide a clue …
The “news” (always seems to be a story at a potential turning point) was that the UAE was vocal about OPEC planning to cut oil production. Oil shot up from 26.13 to almost 27.2
ICYMI
Ah … thanks. I don’t know if the pop will last …
Peter–Me thinks this market, she has a sense of humor!! Gary
Gary,
The market and I seem to have different senses of humor 🙂 We’ll see how we close. Right now the Nasdaq and SPX have new lows, but the DOW does not. The SPX and DOW have overlapping waves in the fifth wave. NYSE did not go to a new low. It’s all a real mess at the moment.
Well, Peter,
SPX has finally done a new low right before that “news” on OPEC that I’ve read several hours ago
Not all of them made a new low, so we’re out-of-sync. Hard to know what’s next.
I’ve added 3 charts and some commentary to the post in an attempt to think through what we have here. I hope it shows and explains the conflicting signals I’m seeing.
I’ve updated the SPX and eurusd charts above so you can see our progress (or lack thereof) so far today. 🙂
Thanks for all the updates, Peter.
Mike,
You’re welcome. It’s a perplexing market.
Possible turnover here.
Nice call on the turnover… hopefully this wave can tell us more information
Hope so. Either looking for a second wave retrace or a new low. I’d prefer a new low and to finish off this wave.
On the 10 min chart of SPX, May see the roll over now, looks we hit a resistance line that connects to the low on 2/8 1828 and the second bottom 1835 on 2/9/2015 and goes through today’s highs from around 1130 am 1859 and 330 pm at 1864. Also looks like the early sell off was a wave 4 and we may have completed a wave 5.
Certainly an impressive rally in the indices today, which only now appears to be ending. There’s still little to suggest what the overall pattern is. I can’t draw an ending diagonal as the trendlines are no longer converging. We have a channel heading down, but the length of the next move is in question. I would think we still have to get to a new low, and we’ll have to see what happens from there.
This wave up appears to be in 3 waves, so should be retraced.
The potential eurusd ending diagonal is leaning towards more of a channel. The euro has begun to move up.
There’s also the issue of the DOW not having dropped to a new low (hence no wave 5), so it has a different count than the other indices. We’re just going to have to wait for this market to give us clue as to where it’s going.
Week analysis.
As I said last week the market will do a pull back into this weekend. 2/13-2/16 is important to test. What do we see?
1) First quarter moon. Quarters give neap tides and highs in the market
2) Vedic moon entering aquarius (bearish)
3) Bayer rule 32 on 9/19/15 high
4) Mercury shadow date
5) Strong tidal inversion on Sunday
6) strong gann date (including 122 crash angle date)
7) spiral date on 12/25/15
8) Mercury 1936 changes sign (bayer rule)
9) Heliocentric Mercury enters Sagittarius.
So I see many reasons for a high. Gold/euro did a w4 down and equities a w4 up.
Next strong date will be 2/26:
1) Heliocentric Mercury will enter Capricorn (should be the end of w1 up in Gold/euro)
2) Mercury echo date
3) Very strong gann date (stronger than 2/15)
4) sun 90 degrees on death/destruction midpoint.
5) vedic sun at 0 in universal clock.
6) Moon at Apogee 2/27.
Next week w5 down into Friday befor we do a retrace into mid March. After that we turn down again for the april low I mentioned before.
Last week I mentioned the october 2019 date for the end of this bearmarket. This will bring a down trend in april 2017, pull up into march 2018 and turn down again into october 2019. This remains my outlook and I see more evidence every day. Maybe next week some background.
Cheers,
André
Ty André! I agree, we top out on Monday and than the last motherload down in C.5 to 17xx (low 1700) will follow on Friday if you ask me!
Cheers,
W
Correct. We have one last leg down. It will be a good one. Monday is a US holiday, but futures will likely start down Sunday. We’re right at the top. I’ll be able to provide targets today. Then we have a large wave 2 up, which will last for a while (at the same time the euro does a large second wave down). The fun part is going to begin because after a first wave down, the waves are measurable and much more obvious.
DOW and SPX are in an ending diagonal, Nasdaq in a triangle. Euro in and ending diagonal (going up), CAD in second wave. Lots of opportunities over the next week in both directions. I have a turn date of Tuesday for both equities and currencies, so we’ll see how long the drop lasts. It will be a little over 100 points in SPX.
Thanks, André, for all the work you put into this.
I differ with your market analyze for the med term. I see NEW HIGHS for the market later this year.
I also have Feb 24th as significant top before we head back down to reach new lows in the indexes. Feb 25th as the start of the down trend to new lows into the beginning of March. Martin Armstrong also see the possibilities of new lows in the market next week possibly going into early part of March. We differ with each others timing slightly. He has the week of Feb 22nd as the start of the down trend. As for now, I am out of my longs and 25% short at the close today. Good luck to all.
André,
Looking ahead at what is happening re: cycles leads me to think we’re in a second wave. Let me know what you think of this scenario. I’m about to update the chart one more time. I’ve had a chance to look around at everything now.
Tonight we head down in wave 4 of the A wave to about 1903 ES. Thursday (18) we head up in wave 5 of the C wave to 1940 ES. Friday we head down from 1940 (previous 4th) to complete a large B wave at about 1860 ES. (that may last through Sunday).
I have a major turn date Feb 23-25.
Monday through Wednesday, we head up in wave C (of wave 2) to ES 1988. This would make the A and C wave about equal and 1988 is approximately the 62% retrace level for the top of wave 2 in ES. We turn down mid week (23-25) into wave 3, which will be at least 500 points in ES/SPX.
I have posted this scenario chart at the top of the post. I will add both the euro and SPX shortly.
I meant : vedic SUN enters aquarius.
p.s.
And BR32 on 9/17 high.
New post live: https://worldcyclesinstitute.com/its-a-diagonal-world/
This website is for educational purposes relating to Elliott Wave, natural cycles, and the Quantum Revolution (Great Awakening). I welcome questions or comments about any of these subjects. Due to a heavy schedule, I may not have the time to answer questions that relate to my area of expertise.
I reserve the right to remove any comment that is deemed negative, is unhelpful, or off-topic. Such comments may be removed.
Want to comment? You need to be logged in to comment. You can register here.