
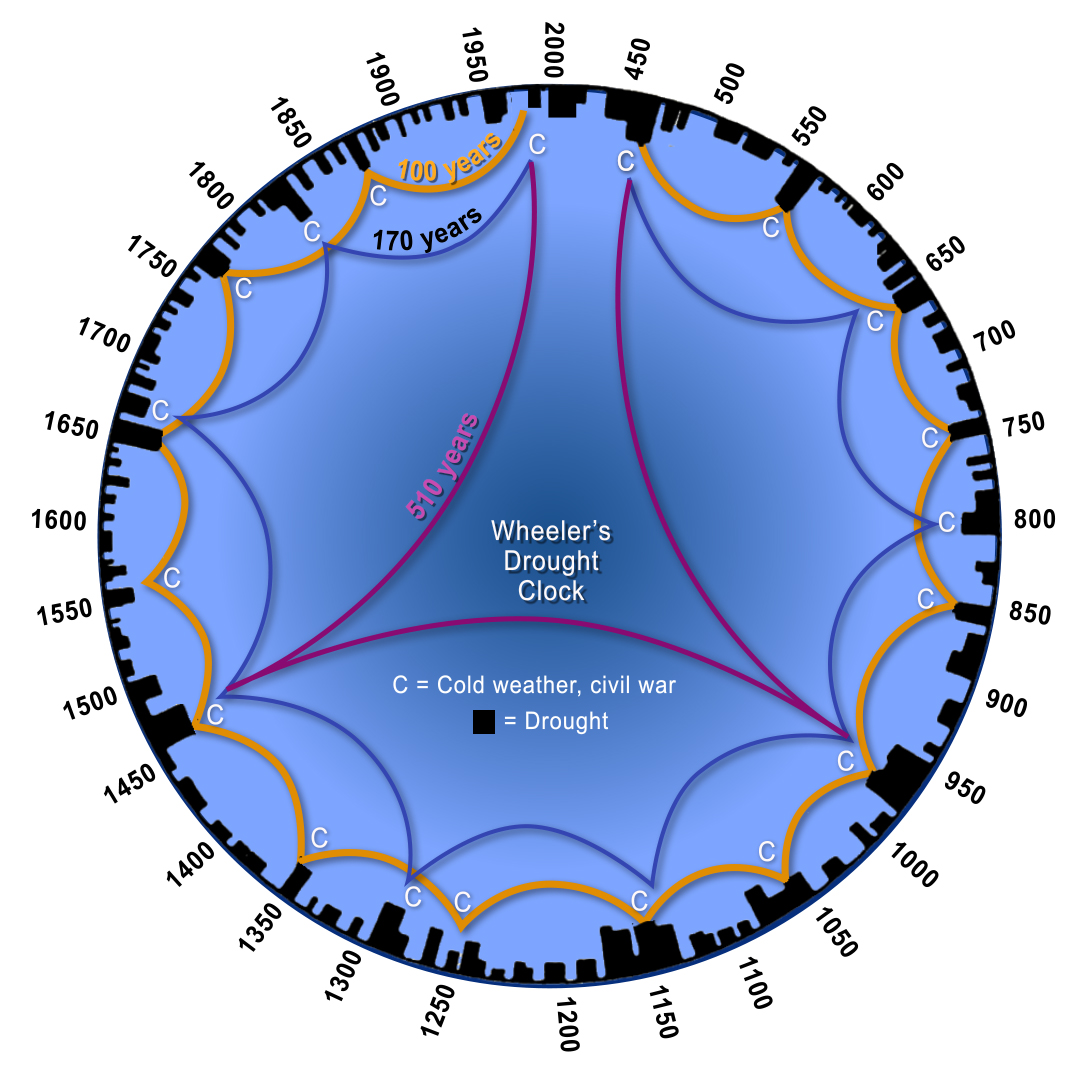
 On the left is a representation of Dr. Raymond Wheeler’s Drought Clock. He created this clock in the 1940s to help others predict cycle turns based on changes in historic climate. Dr. Wheeler found major climate cycles of 25, 100, 170, and 515 year intervals. For a larger representation of his clock and more information on it, click here.
The 515 climate cycle is also a major civilization cycle where virtually everything around us changes. This weekend, I’m pulling out a few of those changing cycle top “traits” with some short examples of how the same events recur over and over again, not verbatim, but with changes. It’s the reason we often say that “history rhymes.”
“Those who do not remember the past are condemned to repeat it.” George Santayana
It’s amazing to me how quickly the world is devolving into complete chaos. Of course, this is a trait of moving to a colder climate, and has happened throughout history at both 172 and 515 cycle tops. After going sideways for the past 19 years or so (since 1998) world temperatures are gradually turning down. The first part of a cold period is wet, the balance is dry. However, it’s not only the climate that’s predictable.
“As far back as I can remember, I’ve always been a strong believer in the importance of cycles. You’d better try to understand them, because all of your timing and often your luck is tied up in them.” Lee Iacocca, past President and CEO of Chrysler Corporation (1978-1992)
There are many major cycle top traits that appear right on schedule, but in a slightly different manner than the last time. If you’re a student of cycles, like I am, you recognize the similarities to mass historic changes of the past that “the herd” simply doesn’t recognize.
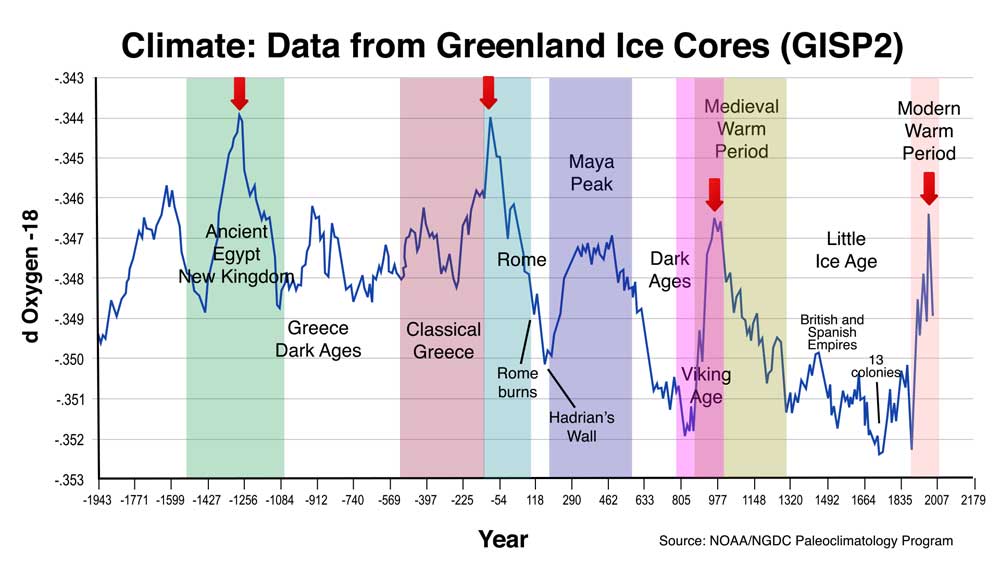
Above is a representation of relative temperature highs and lows (cycles) and how they correspond with the rise and fall of civilizations. This data on temperature comes from the Greenland Ice Sheet Project, funded by Denmark, Switzerland, and the United States in the 1970s and 80s.
Building Walls
The building of walls always happens are major cycle tops in history. The cycle tops occur roughly at 500 year intervals, so 500 BC, AD 100, 600, 1000, 1500, and right about now.
President Trump is talking about the “Great Wall of Meximerica.” But it’s not the first wall at a cycle top.
In AD 122, Hadrian, then emperor of a struggling Roman Empire built Hadrian’s Wall (an 80 mile long wall in Northern England) to keep out the barbarians.
China’s Great Wall was built in stages, but the majority of construction happened during the Ming Dynasty (1368-1644) to keep out the Mongolians. This happened at the top of another ~515 year cycle.
So President Trump is not doing anything new—just working to the cycle clock.
Migration
The Jewish Diaspora: from the 6th century BC
An early story of the movement of peoples begins in the Middle East in the 6th century BC (a 500 year cycle top). After the destruction of Jerusalem by Nebuchadnezzar, many Jews lived in Egypt or Babylon. In these alien surroundings they preserved their own customs.
It was the beginning of the process by which the Jews spread throughout the world – the Diaspora – remaining always a minority in the societies they entered (until the creation of the modern state of Israel). Other tribes on the move either become a majority in their new home or were absorbed. Only the Jews, through retaining a religious and to a lesser extent a racial identity, survived through two and half millennia as a recognizable, though widely scattered people.
There as another mass Jewish migration around the time of the next major 500 year cycle top. The Jews revolted against the Roman Empire in 66 CE during the period known as the First Jewish–Roman War which culminated in the destruction of Jerusalem in 70 CE. During the siege, the Romans destroyed the Second Temple and most of Jerusalem. This event marked the beginning of the Roman exile, also called Edom exile. Jewish leaders and elite were exiled from the land, killed, or taken to Rome as slaves.
Germans on the move: 2nd century BC
In the 2nd century BC, Germanic tribes moved south and east from Scandinavia. Other Germans pressed south along the Rhine as far as the Danube, forcing the Helvetii – a Celtic tribe – to take refuge among the Swiss mountains.
Two German tribes, the Teutones and the Cimbri, migrated so far south as to threaten Roman armies in southern France and northern Italy. They were finally defeated and pressed back in 101 BC. But from the Roman point of view a long-term threat had been identified – that of the German barbarians whose territory became the region beyond the Rhine and the Danube.
Angles and Saxons: 5th – 6th century
With Gaul in the hands of Germanic chieftains, and the Roman legions withdrew from Britain. At the same time, land-hungry tribes were tempted by the short step across the English Channel. Among those who take this step were invading the eastern and southern coasts of England, are Angles and Saxons. They came from Denmark, from northwest Germany and from the lower reaches of the Rhine. This migration was so large that it caused the re-settlement of Brittain.
The Arab conquests: 7th century
One of the most dramatic and sudden movements of any people in history was the expansion, by conquest, of the Arabs in the 7th century (only the example of the Mongols in the 13th century can match it). This was responsible for the spread of Islam. It began with the Islamic Prophet Muhammad in the 7th century.
The desert tribesmen of Arabia formed the bulk of the Muslim armies. Their natural ferocity and love of warfare, together with the sense of moral rectitude provided by their new religion, formed an irresistible combination.
Gypsy Migrations from 1417
Whatever their origins, the Gypsies spread rapidly through western Europe during the 15th and 16th centuries. Their refusal to settle and assimilate with the local population enabled them to retain a separate identity. But it also provokes hostility and persecution.
This is seen, from the start, in the removal of Gypsies from western kingdoms – akin to the expulsion of Jews (whose sufferings the Gypsies also share in the 20th century). Gypsies were expelled successively from Germany (1497), Spain (1499), France (1504), England (1531), Denmark (1536), Scotland (1541) and Poland (1557).
Inflation vs. Deflation
Let’s go back to Ancient Rome for a good lesson in inflating the money of the population, the favourite past-time of most governments throughout history. Over the course of the destruction of the Roman Empire, the coinage was inflated by about 95%.
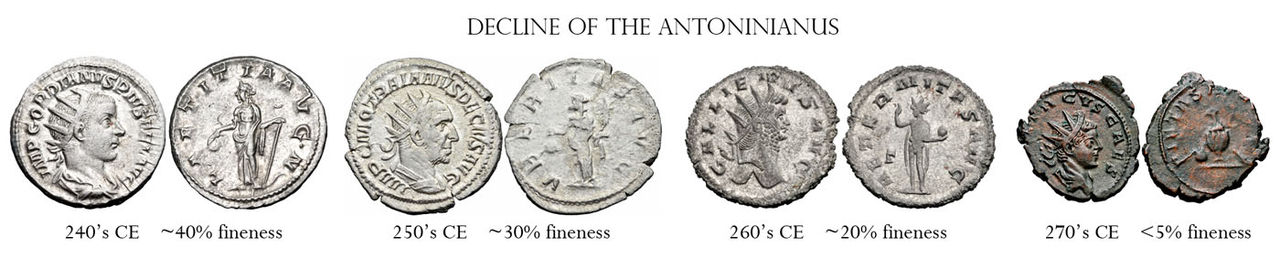
Today there’s an inflationary war being raged across the globe. Governments love to inflate their money, as it boosts trade. When you inflate (create and disperse more money within the economy), money decreases in value. If you decrease the value of your money, the products you produce end up being less expensive to the inhabitants of other countries that have more valuable money (have not inflated their money).
Eventually, however, the economy of the host country suffers (the one that inflates the money supply). That’s because lowering the value of money at home increases the general cost of living. Prices of items within the country increase. Over time, the population attempts to keep up their standard of living but to do so, has to go deeper in debt. Eventually, it leads to a loss of confidence in the economy and eventually, deflation, leading to a complete financial collapse.
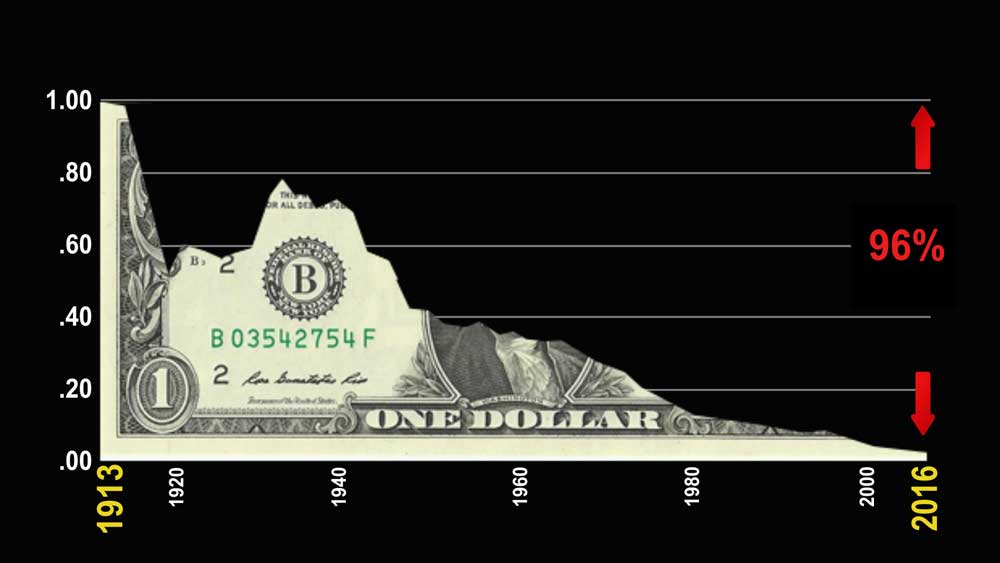
The above chart shows the declining value of today’s dollar due to inflation. Over the past 100 years, it has declined by 96%. That means that compared to 1913, today’s dollar is worth four cents. However, costs have not collapsed to the same degree, so we’ve rolled into heavy amounts of debt in an attempt to keep up our lifestyles. This is unsustainable.
This has happened over and over again throughout history. It took place in the 1920s in the US, leading to a financial bubble and eventually, a stock market and real estate crash: The Great Depression. The Greater Depression is just around the corner.
Trade Wars
We’re heading into trade wars once again. The writing is already on President Trump’s wall, even before construction starts. You’d think the country would have learned its lesson in trade wars and their impact on the economy from the 1930s. Apparently not.
In 1930, President Herbert Hoover approved the Smoot-Hawley Tariff Act, which raised tariffs on over 20,00o imported goods. This was akin to a trade war and resulted in reducing America’s imports and exports by more than half. It exacerbated the depression.
In fact, if you do a bit of reading about President Hoover, you’ll find an uncanny parallel between the financial situation of the 1920’s and that of today. It was a period of inflationary expansion, caused by central banks, and resulted in a financial stock market bubble and ensuing crash.
Stock Market Bubbles

The above chart shows the extraordinary financial bubble created over the past 43 years by our current monetary system, which is based solely on debt. There’s as much debt in the world as there is wealth. As a result, most of the wealth is an illusion. Bubbles always crash and this is the largest debt bubble in history. In the next few months, we’ll see the top.
There are many more traits that arise at these 515 year cycle tops. I’ll continue to focus on a different group of them over the coming weeks. They’re predictable because they’re periodic (they’ve happened at regular intervals historically). They’re well-documented in history books and, of course, books about cycles. But, nobody reads history …
All the Same Market
“All the same market” is in place once again. This is the movement of currencies and equities seemingly in sync. In retrospect, it was the defining feature of the past week. All the USD currency pairs have wandered around at the top of their waves as the US indices have completed theirs.
I’m on the fence regarding ES, SPX, and the USD currency pairs regarding whether they have to test their tops, or exceed them slightly, or head down from here. My preference here is for a double top. So, we could get a double top or even a touch higher in wave5 of (3) on Monday.
Either way, the count really won’t change. Wave (3) up is done or will be on Monday and wave (4) down is on the agenda for this week.
As I often say,
“The market does the most predictable thing in the most unpredictable manner.”
This past week was a great example.
Even though the USD currency pairs and the US indices are virtually back in sync once again, the above adage will likely continue to play out. Both the USD currency pairs and the US indices should move down as one.
However, there’s one currency pair that has a mind of its own, and that’s the British pound. It looks to be completing the first wave up of a new sequence and may get aligned with the other currency pairs and the US indices a little later this week. That would put everything more or less back in sync.
I’m still projecting that US indices and the USD currencies will get to the start of the fifth waves together. Volume is extremely low everywhere, and the fourth wave is a countertrend (corrective) wave, so there’s not a lot of motivation for a strong move. However, once we get into the final fifth wave up to an all time new high, that should change and volume should pick up somewhat.
As we reach the very top of the final wave, though, volume should drop right off to virtually nothing. That’s when we’ll see the turn and the strong set of waves down, which will be the start of a multi-year bear market, or crash.
___________________
The Ending Diagonal Option
I’m keeping the option for an ending diagonal open, but my preference is that we’re heading down into a regular wave 4. The ending diagonal at the top of wave 3 has changed my mind
Based on relabelling as a 5 wave move in ES wave (3), I’m still projecting a final top to our five hundred year set of Supercycle waves sometime in the early part of this year. I’ve given up on being specific, as these waves have been moving very slowly. Ultimately, Mr. Elliott’s waves will forecast the end and give us adequate warning of the turn.
______________________________
Here’s the latest daily chart of ES (emini futures)
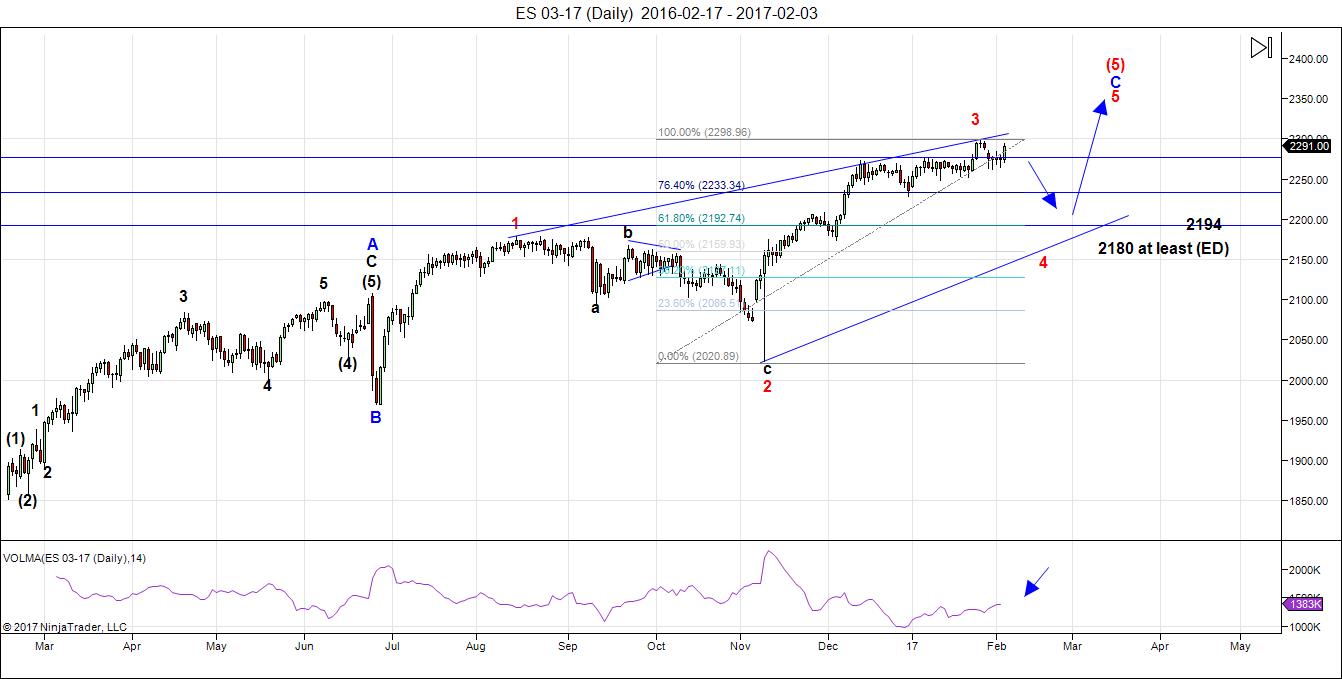
Above is the daily chart of ES. The trendlines are gone, as the structure counts best as a simple wave 3.
There are no changes in the prognosis. The dismissal of the ending diagonal pattern simply means that wave 4 down will seek its own bottom and is not confined by the requirements of an ending diagonal. It’s therefore likely to retrace 38% of the C wave at its own pace (to about 2202). This new count also aligns ES with the wave structure in the DOW, and it’s always a good thing when the structure is similar across the major indices. Having the DOW that out of sync with the SPX has been pointing to an issue with the SPX count.
The 4th wave will come down in three waves. After we finish the A and B waves, we should be able to project an end to the C wave of the 4th wave. Once we finish the fourth wave , we’ll get a final blow-off wave for the month of February, with a potential top that month or into very early March. We may very well see the ending diagonal as the 5th wave.
Here are the path predictions going forward:
- Wave 4 will come down in 3 waves with any of the corrective patterns possibly in play.
- Wave 5 is likely to be an ending diagonal. In any event, it will be in 5 waves (not motive).
Summary: We either in the fourth wave heading down, or are going test the top of wave (3) one more time before heading down. Monday should see the turn down, one way or the other. USD currency pairs and the US indices are getting aligned to make the next move down together. After completing the fourth wave, we’ll have one more wave to go, which is likely to be an ending diagonal as a fifth wave. The long awaited bear market is getting closer.
_______________________
Sign up for: The Chart Show
Thursday, February 9 at 2:00 pm EST (US market time)

The Chart Show is a one hour webinar in which Peter Temple provides the Elliott Wave analysis in real time for the US market, gold, silver, oil, major USD currency pairs, and more. You won’t find a more accurate or comprehensive market prediction anywhere for this price.
Get caught up on the market from an Elliott Wave perspective. You’ll also get Andy Pancholi turn dates for the balance of the current month. There’ll be a Q&A session during and at the end of the webinar and the possibility (depending on time) of taking requests.
All registrants will receive the video playback of the webinar, so even if you miss it, you’ll be sent the full video replay within about an hour of its conclusion. For more information and to sign up, click here.


Hi Joe,
Thanks for posting that. I actually got my info from Steve himself, so I will have to take another look.
As to Puetz window itself, we still have one this week. The most informative scrap of info on this is from Peter Eliades: “In his first research report, he noted that all 8 of the greatest market crashes in history … began … within a time period of 6 market days before to 3 market days after a full moon that occurred within 6 weeks of a solar eclipse. The more common occurrence was that the full moon accompanying the crash within the stipulated period above was also a lunar eclipse, but if not, it would be a full moon one cycle away from a lunar eclipse full moon. The requirement remains, however that the full moon accompanying the start of the crash must be within 6 weeks of a solar eclipse.”
I talked with Steve on this 2-3 years ago, after eyeballing his own charts on it, and I came up with a summary of the crash pattern, which paraphrased the above, and he was happy with it.
You are definitely right about generally seeing weakness into the SEc, particularly when the LEc is after.
Hi Taz
thanks for the post .
i think it would be in your best interest to take the odd years like this
and see how well that has worked out .
using what you wrote below would imply that the great crashes
began 6 weeks after the solar eclipse ? I don’t agree
Peter Eliades: “In his first research report, he noted that all 8 of the greatest market crashes in history … began … within a time period of 6 market days before to 3 market days after a full moon that occurred within 6 weeks of a solar eclipse.
i get confused putting this together each year yet its not how i see it .
Joe
interesting article
http://www.dailymail.co.uk/sciencetech/article-4192182/World-leaders-duped-manipulated-global-warming-data.html
Peter, another ‘Great Read’ post. I love your quote:
“The market does the most predictable thing in the most unpredictable manner.”
Thx for ALL of it.
purvez,
You’re welcome, as always.
Just a thought
Lunar eclipse Feb 10-11th
solar eclipse Feb 26
Assuming the typical lunar sends the market down
and the solar eclipse send the market up .
we have a set up for a bad options expiry . ( Next week Down )
might be worth looking at the put call ratio this week.
Feb 26 plus 6 weeks = April 9th ( end of qtr plus 20 days ,april 20th )
full moon 6 weeks after the solar eclipse = April 10th .
Im not calling this a Puetz window yet …. Mercury retrograde
April 9th 2017 – May 3rd 2017 in Aries, then Taurus
giving it 10 days after may 3rd = may 13th
my own works has may 19th as a low .
Something to consider
Id still view late feb – march 2 as a starting point for higher
prices , this is all rough at this point but its my guide.
Thanks Taz for getting me to think of it all .
Joe
Peter,
Thanks for the incredibly enlightening perspective.
Much appreciated!
Andy
🙂
4 international temperature record keeping agencies agree…
“All show rapid warming in the past few decades. All show the last decade has been the warmest on record”
graphic at
http://climate.nasa.gov/climate_resources/9/
In face of this wonder how we can see temperatures as turning down?
Because it’s a gigantic scam.
http://www.zerohedge.com/news/2017-02-05/climategate-2-noaa-whistleblower-claims-world-leaders-fooled-fake-global-warming-dat
and http://www.zerohedge.com/news/2017-02-03/un-official-admits-global-warming-agenda-really-about-destroying-capitalism
And by the head of the international spacestation: http://hockeyschtick.blogspot.ca/2013/12/new-paper-predicts-another-little-ice.html
I’m off to give a talk tomorrow on just this topic.
It is more than just a scam. It is academic fraud and malfeasance of the worst sought but you cannot simply accept the information that these crooks disemminate. I am not talking about data that is merely fudged, I am talking about data that is entirely fabricated and some of the worst professional misconduct you could possibly imagine (such as putting thermometers used in studies on hot tarmacs rather than measuring ambient temperature). What is really strange to me is that there has been quite a bit of reporting on the weakness of a lot of this data so I am puzzled as to why anybody still believes any of it.
Oh, c’mon Verne, tell us what you really think! haha.
You are absolutely right. Well put.
I meant to say of the worst “sort” but could not edit. Sorry about that. I absolutely loath this idiotic autofill moron feature of my android tablet. 🙂
The market continues to move as though mired in molasses!
I guess we should not be too surprised as fourth waves to tend to be meandering and quite often protracted. I am starting to think that this one may be quite shallow as it does not look as if we are seeing a C wave to the downside.
Verne feels like late July, early Aug 2015. Remember what happened then? This time rather than being ‘drawn out’ I reckon it is a few days away.
In any case above 20K DJIA I am NOT (repeat NOOOOOT) going long on the market.
I hear ya. The market is lulling a lot of traders to sleep with this “playing possum” game. Peter’s comment about it doing predictable things in unpredictable ways was a good reminder to keep the wave targets in mind and not worry too much about exactly how it decides to get there. I too would want to see a solid above this 20K pivot (at least 1.5 %) before I would even consider a long trade. Something about the entire price action has the smell of Denmark!
Valley,
Are you positioning for long today or tomorrow…are you waiting for gap fill till 2280.
Hi Bill,
I am fully invested right now in US equities. I will sell if market rises 1 to 2% above current levels. I see a selling event in next three weeks most likely third week of February (pre Venus inferior conjunction). So, I will exit market if we get 1 to 2%. If market sells off early I will hold on as I expect 2400 before June 1.
I think we have a little more room to run up here. WOW did i just say that :/ lol.
Looking for SPX 2308ish – could go a little higher though but not much if it does for the over shoot.
Possibly tomorrow we hit it and in my opinion that should be it for upside.
Connecting the resent tops and bottoms there is a pretty clear smaller ED that needs one more push higher to complete.
**** A break below 2274 would have me move the count back 1 degree and the top will be confirmed @ SPX 2300.99
I posted a link this morning on the global warming scam
look up a few posts .
it goes into more detail and what they did
Joe – this whole Climate debate is doing my head in. Note the links below. Who really has the true facts. All I know is that it’s hot and dry in Queensland at the moment with the weekend temps heading into the high 40oC. High of 48oC in Dirranbandi. That is hot, in the yards, covered in flies, drafting sheep.
http://mashable.com/2017/02/05/noaa-global-warming-hiatus-story/#DI74ZnSkwsq1
http://mashable.com/2017/01/04/study-confirms-noaa-temperature-data-lamar-smith/#VWMxOvauNkqw
Hey Joe,
Thanks for forcing me to reflect on all this at a deeper level too.
Essentially there are three Puetz windows associated with every LE and SE pair, and it is in one of these windows that you expect to find the secondary top. The common variation is to find the secondary top at the LE full moon 2 weeks after the SE but in the case of 1997 Hong Kong crash, 1720 crash and 2000 NASDAQ, the secondary top was 4 weeks after the LE and 6 weeks after the SE (based on Steve’s charts). In 2/3 cases I mentioned, the secondary top was lower than where the index was at the time of the LE full moon, but it is from the secondary top where selling begins in earnest. Obviously the term secondary top is subjective and the specific wording ‘6 market days before to 3 market days after a full moon…” is too exacting for my liking, but the main takeaway for me is to be aware of the eclipse cycle, and that there are minor variations allowed on the theme.
I have found that regardless of the variation involved, you invariably find some type of weakness (obviously crashes are rare) but it is not always present in a headline index, that is, it can be contained to a sector. In 2012 and 2013, the Materials sector would take it on the chin during this period.
Taz
you keyed into something .
its not always the market or sector your expecting
yet it does show up ? i agree on that .
I have kept to the basics of the puetz wndow and
i view the failures as opposite moves which is why
i noted the scenario i did earlier , next week should
give some insight to this since we will have the lunar
eclipse effect .
Red dog
i have given up on the global warming mantra based
on what i researched a very long time ago .
Peter has done even more research that convinces
me even more that we are not only going into a cooling trend
that lasts much long then most expect but that we have already
begun that trend .
What i find most interesting today is now that we have a president
in the usa who says global warming is a scam, suddenly others
are beginning to come out . maybe its a coincidence maybe not
yet where i m located 43 n 124 w i am seeing pretty much in real time
this playing out as peter has been explaining . Last year we had the wet
this year more of the same yet colder. It hailed here today and this area
rarely snows , January is typically the cold month of the year yet this years
temps were colder . My main data set is the daily sunspots .
i work on the pacific ocean so i pay attention to the weather.
ill be making a trip from the Columbia river in Oregon to Honolulu Hawaii
late Feb early march. i doubt ill see some huge difference yet i make this run
about once per year so it should be interesting at the least.
Joe
Andre’,
In your opinion…Is what we are seeing today a result of the tidal inversions you mentioned? That influence could perhaps finish today if you analysis plays out, right? Not looking for trading and investment advice.
I think Andre said 2/7 is a possible low. Perhaps there will be news to kick off wave 4 later in the day?
LizH,
I went back and read Andre’s post from last week and he said that the “tidal” inversion could push the turn into Tuesday…then an “abc down”! I think that is what happened today! I seem to always be seeking clarification on Andre’s post!
From the 11 am est top for ES, looking for 3 hourly red bars with lower lows on each candle before I attempt to join the bounce wave.
I just read the following quote in amongst ‘this’ post and felt it worthy of sharing:
http://www.alhambrapartners.com/2017/02/03/way-past-humpty-dumpty/
———————–
Money is no object when the object is “money.”
———————-
ES low today not low enough for me. I think 2/3 gap up must be filled for a better bounce play.
i think the daily chart of the dow is showing a minor wave 4
today . 200013-19993 would be the ideal 4th wave.
im counting from the recent low on jan 31 2016.
wave 2 lasted 2 trading days . this places tomorrow as
another minor date based on the wave comparison.
wave 5 will probably = wave 1 or something close .
the lunar eclipse Friday-saturday the ideal time for a
wave 5 top ( counting the jan 31 to date count as an impulse )
Next weeks options expiry would be down based on this and
it would dove tail with the lunar eclipse .
solar eclipse a low of sorts at the end of the month .
my plan is to take a small bearish position Friday
The polls right now show Le Pen currently at 25% in first place. The first round of the presidential election will be on April 23rd. The pundits are saying that it is unlikely that she will be able to win the election on May 7th when she will face the independent presidential candidate Macron and a conservative.
Peter
something just came to my mind .
the 510 year cycle you show relates to armstrongs pi cycle.
3141 calendar days ( pi being 3.1415 )= 8.6 years .
6*8.6 = 51.6 yrs
super bowl 51 ? first time ever in overtime and an amazing
come back .
10 times 51.6 = 516 years .
I’m just point out how close it all fits is all .
Joe
I have. now seen at least one other EW count that also sees a possible ED in SPX. More interesting, the structure is also almost complete. They do however state it has a low probability.
daily and weekly sox index appears to be completing a top of a 5th wave
of an extended 3rd .
ill need to research 4th waves following an extended 3rd .
Just started doing research about financial astrology and based on my calculations I have the following observations (all heliocentric)…
Saturn-Uranus cycle at 120 degrees from 6/16/2017 to 8/20/2017
Jupiter-Saturn cycle at 60 degrees from 6/30/2017 to 7/26/2017
Jupiter-Uranus cycle at 180 degrees from 6/30/2017 to 7/26/2017
Venus is at zero degrees on 7/14/2017
Mars is at 120 degrees on 7/17/2017
With significant harmonicity between the long term synodic cycles and the Mars/Venus combination to acting as a trigger, the ultimate change in trend could come between 6/16/2017 to 8/20/2017.
Hi Ron,
Nice research. I have tried to quantify market effects of a variety of planetary earth sun angles. The basis of my research is planets conjunctions and squares with greater effect being found with inner planets, Jupiter and Mars. As with most lunar planetary seasonal data I find the win rate to be about 60%. Some of the better ones are Venus inferior conjunction 3/16/17 which is usually preceded by sell off up to one month before and after three month rally. Also Jupiter superior conjunction is coming up late March which is usually preceded and followed by a few weeks of weakness. Thanks!
Peter,
I enjoyed your cycle discussion above. I would like to add a little more to your insight. A couple of factoids that I find interesting regarding a 168 year conjunction of Neptune/Ketu in Aquarius (Vedic, Lahiri). This pair was in Aquarius in January 2016, conjunct in November 2016, and remain in Aquarius until August 2017. This ~168 years is very close to the 172 years you noted (certainly within the orb of movement, especially considering how slow Neptune is). Also, 515 years is very close to 3 cycles of 168. I will let others consider the meaning of Neptune and Ketu in Aquarius. What I find interesting is the ‘social contract’ implications.
I believe that society is in a final showdown phase between Socialism and Freedom (economic, religious, political, ideas…). It was 168 years ago that Karl Marx came out with his Communist Manifesto which has had such a profound effect. It has provided politicians, dictators, and all manner of reprehensible individuals justification to exert power and control over others. If we look at the aspects, especially hard aspects, they correlate well with major events in the growth and acceptance of socialism. We have now made one full cycle, and I believe that this is the final battle between those two philosophy’s since they are not compatible with each other, and one must die. Since socialism (whether commune socialism, national socialism (fascism), feudal socialism, democratic socialism,…) always fails, my money is on freedom (but freedom and its responsibilities must be truly understood, learned, and fought for). I believe that the tides of history are on the side of freedom. But, as often occurs at major changes in the tides of history, it will be a very messy cyclical change.
Another interesting factoid, 12 cycles of 168 years takes us back to the year 0 (12 is always an interesting number). And many of the 168 year cycles (including their oppositions) in between then and now marked some important social changes (the rise of Islam, revolutions,…). Thanks for the opportunity to get on my soapbox, I will get off now.
Steve
my last post for the week
nvidea reports earnings Thursday after the close
friday-saturday the lunar eclipse
STM – St micro has a consensus of 89 % bulls vs 11 %bearish
That stock is part of the internet of things and has been up huge
this past year % wise .
Nvidea near 140 prices in a lot of growth .
given I’m long STM’s competitors as well as nvidea
and the sox index looks to be near a top of a 3rd wave.
the best hedge i can find is STM puts .
Risk reward of 7 to 1 i find attractive .
there is a trading method in regards to earnings with options
traders, buy calls about a week before earnings and sell those calls
on the news . in this case id assume sell nvidea calls on Thursdays
close or Fridays open ( my bias Thursdays close )
based on that ill be looking to buy march and april puts and possibly
calls on STM. its a strange trade yet still comes out 7-1 risk reward
and is easier for me then positioning with futures at the moment
because of work .
Ron
your June august dates fit very well and make sense .
after those dates i see October, yet ….. June august is most
likely where i begin selling stocks and becoming more bearish .
good luck everyone
Joe
Yey! My Wheeler Drought Clock got covered in Time Price Research.
http://time-price-research-astrofin.blogspot.ca
Time Price Research has so much to offer, good job Peter!
If anyone missed the Melissa McCarthy as Sean Spicer skit on SNL, here it is. It’s hilarious.
https://www.youtube.com/watch?v=au_KRPxcMi4
LoL, nice one Peet! 🙂
Cheers,
W
Andre’,
Does the levitation this week change your analysis? You mention “you expected one more inversion”…do you still see the 13/14 of this month as low of some sort?
Are you still looking for that decline into 3/3? Peter is looking for the top of wave3… Would certainly like to see you two aligned! Not looking for trading or investment advice. Thanks…not trying to put you on the spot. Just seeking clarity.
Ed, The big turn will come 2/22-25. This will be a high. So a low 14-15 is likely.
9/10/11 strong window.
So my out look hasn’t changed. It is just that we are up into 22-25 so everything shifts forward a bit. Next week we will see more volatility.
When you say “strong” window…Does that mean strong “vibrations”? Or does it mean strong move which could be “strong up move” or “strong down move”?
I am interpreting what you are saying as a strong up move. Would that be the correct assumption?
I expect a high tomorrow. Then a low on Monday, a high on Tuesday and a low Thursday.
The strong window will bring a high. Think tuesday-Thursday could be a significant decline.
Thanks!
SPX reverse H&S confirmed still looking for 2308ish to be the top.
Markets don’t usually top or bottom on a Friday or a Monday so objective should be hit today.
im waiting till the close today yet a case can be made
we saw the top this morning .
lunar eclipse is late Friday night and may act as a magnet
driving prices higher ,
that said the 4 hour dow futures chart and the cash dow
nailed the short term targets this morning .
cash dow daily chart has room to 20198
if todays highs are in the 5 minute cash dow chart
shows a potential right shoulder has formed
to soon to call it .
next weeks option expiry would prove this right or wrong
Joe
Pete at “1Option” free commentary is usually a sensible and accurate summary of current market conditions. He has moved from cautious to unreservedly bullish for short term swing traders in US equity options.
So this is supposed to be still wave 3?
BEST QUESTION yet!!! Congrats you win the ‘oh ,,,I don’t know what we can give you PRIZE’ but rest assured it will be a ‘non-event’.
Does that sound like I’m putting you down or being cynical.
BELIEVE ME ALEX THAT IS ”NOT” the intention. It really IS the BEST QUESTION YET!!
With today’s ramp up I don’t think ANYBODY (except perhaps from our host) knows what is happening in this market. For the DJIA
Here is the ‘REST’ of the post if it wasn’t for my ‘FAT FINGERS’:
For the DJIA to be in the STRATOSPHERE at 20200ish is quite out of the ‘ordinary’…..but then we live in ‘interesting’ times.
I AM SOOOOO LOOKING forward to shorting this baby!!….just not yet. I’ll announce my positions here when I’m ready.
Purvez,
I’m calling it the C wave out of the triangle from way back when in ES (two or so weeks ago).
YAAAAY Peter does this mean we are at an end? Even with my ‘TEENY TINY’ positions to the down side the ‘EMOTIONAL TOLL’ is getting to me.
I’ll give it till TUESDAY and then I’m going to pack up and go on HOLIDAY!!
NO NO!! I really mean that. My better half has us booked for 2 weeks to the Cape Verde islands.
Sun, sand, SANGRIA….although not necessarily in THAT order!!
I’ll report back…if able/stable!!
Have they been warned? It would be only fair.
Uhhhmmmm we mustn’t always ‘show’ our hand Peter!! Still I’ve just learnt that they are not ‘spanish’ but of ‘portuguese’ origin….so I have some ‘research’ to do about their imbibing liquids.
I DO HOPE the portuguese are similar OR BETTER with such liquids!!
It wouldn’t surprise me if word hasn’t already gotten around … lol.
Peter, you credit me with far ‘more’ than my meager reputation deserves!!
I know it’s your language, but the word “credit” may be slightly inappropriately used here. Just sayin’ …
In any event, have a wonderful holiday. We’ll miss you.
OMG!! ‘credit’ NOT CREDIT!! Hehehe I DO get your ‘suggestion’. That’s one of the reasons I engage here. You are fun to ‘banter’ with!!
I hope to at least read the blog even if the ‘interweb’ won’t have enough capacity for me to post!! I really have no idea what my connections will be like.
Thanks I do intend to enjoy!! I understand the SCUBA is good out there. Done it a few times in the Caribbean so might try it there.
Oh I should have said earlier but was BUSY ‘licking my wounds’.
A SHOUT OUT TO VALLEY!! He clearly said this week would be ‘UP’ and for the DJIA it certainly WAS!!
I know, people, that I harp on about the DJIA….but that is because that is ALL I trade. (Recently I’m secretly wishing I DIDN’T)
Thanks, when all three lunar aspects are bullish and there are no planetary bearish aspects and Trump is promising the sky, moon and stars in the form of deregulation and tax reform, I guessed market would rally. Still believe we will give back any gains made this year within the next three weeks pre Venus and Jupiter conjunctions.
Valley, my first wish is that you made a ‘tidy’ profit out of your ‘judgment’!! Hope you did and Congrats!!
My second wish is that your ‘second’ judgment about ‘giving it all back’ also comes true. My ‘Teeny Tiny’ positions are still feeling the pain!!
=)
SPX 2311.08 Is the top.
ED pretty clear now..
Can u c it? lol
http://s1126.photobucket.com/user/Jodyjody1988/media/Screenshot%204_zpsd7h1shra.png.html?filters%5Buser%5D=146172935&filters%5Brecent%5D=1&sort=1&o=0
You may be onto something on the ED call. I see two possible reasons that might be confirmatory. First is that nice spike above the 1-3 trendline that is so typical of the ED. Second, bullish optimism is at a thirty year high! Everybody and his cat is absolutely convinced that this market is going higher and citing all sorts of bullish leaning indicators that say nothing but up. We shall see….
Last post for the month .
back to work time for me so don’t be surprised
if you don’t here from me in a while .
Peter, i want to thank you for allowing me my opinion
and id like to thank you for you research on the global
cooling . that is where my real interests lay and I’ve gained
a lot of insights from you and your research .
As we enter this lunar eclipse tomorrow i look for the what if
i m wrong scenario about this being a minor wave 1 in the dow
from the jan 31 low . this morning i posted the 20198 level
as a minor 5th wave target which felt like a perfect hit for about
10 minutes . on the close i questioned the high since the Dow went
above that target . the overnight has extended those gains .
So…. i went back to the monthly charts and for some here back in 2015
we had a debate about the highs in the market . My claim at the time
was we were in what should be a 4th wave triangle . Today i bring
that debate back…Using the sp-100 ( spx little sister ) yes she is the sister
and she has been stronger then big brother . ( a compliment to the women
who come here ).
painting with a broad brush we did see a 4th wave triangle
July 2015 to June 2016 waves a,b,c,d,e were completed and there is
no error or creative waves in this count . To me it is solid even if
you all disregard it . Based on this the ideal point E was the June 2016 low.
Take a look at some individual stocks , The more you look the more you will
see that it was June 2016 where things turned ( Brexit )
I post this chart as a warning if this lunar eclipse fails to drive stock index’s
below this months lows ( Feb lows now key ). i Have stated i am long by default
in individual stocks , My concern going forward is between now and the
Feb 26 solar eclipse , also march 2 which is the mars Uranus conjunction.
late march is when the technical ” Venus bull market begins ”
Yet the wave count on this oex chart has us in wave 3 of 3 into most likely
June 2016 . I can see nothing out of line with this wave count.
Be Warned is all i am saying . If this market tanks next week then the Feb lows
still matter . Statistically people get a bit loony on lunar eclipses .
Bottom line: For you skeptics consider a bullish play into June-July
as a hedge to your bearish thoughts , you may call this a throw away
yet id call it a back up in case the market extends as this chart implies.
Good luck everyone .
http://imgur.com/9MIZbGc
If I don’t die of an heart attack this weekend I’m pretty sure I became immortal…Jody I see the ED, the problem is I heard at least 57 tops called by now (not talking about here, just everywhere) and people smarter and far more experienced than me have already been wiped out by this market / the expectation of an imminent collapse…sellers just don’t seem to step in…maybe this “black swan” is too much expected and big $$ is not able to distribute their shares, we can keep on selling every rip forever at this pace, who knows when they’re done…
Alex, you don’t want to wish ‘either’ of those things on yourself. Much better to step aside and gaze in ‘awe and wonder’ at the MIRACLE being wrought.
You’re absolutely right…the problem is that I dumbly cornered myself 🙂 I still cannot detach my chart reading from my world reading. Basically this thing going up makes me nuts, trading aside…I know, I’m not supposed to feel like that, and my trading account is surely paying for it…I have to learn to separate the 2 perspectives…not sure I will be able to do it…maybe I should trade forex 😉 it’s harder to get involved with “how the yen is doing”…
Alex once you have your ‘trading account’ under control then EVERYTHING else will be a ‘side show’.
To get your ‘trading account’ under control you need to (at least to start with):
1. Trade TINY.
2. Given 1. above get OUT when your STOP is triggered.
3. RINSE AND REPEAT!!
I’m not goint to tell you HOW to get into a trade. That is between you and your ‘god’. But getting out when things DON’T work is the key to a ‘longer life’ ….at least beyond the week end!! LOL..
truer words have never been spoken…
hey y’all
jody/purvez – rut still yet to make new high!
here is the long view of spx https://invst.ly/38x5a
here is the intermediate view https://invst.ly/38×47
here is the close view https://invst.ly/38×28
Luri, ‘nnnnnice ccccharts’ again. That’s me teeth chattering with fear!!
I however disagree with your D wave break down in the long view. You see ‘y’ waves need to be kinky too!!….and yours has no ‘kink’ in it. Now if you move your ‘y’ to where your ‘z’ is then you have a clear ‘kinky’ ‘y’!! ….I Lurve ‘kinky’ stuff.
Other than that you are good to go!! However what would be nice is some sort of projection for the end of the D wave. Now if you did that then I wouldn’t be able to contain my excitement. LOL.
p –
so here is my projection. go ahead and be critical – i can take it! and remember “i know where you live!”
https://invst.ly/38-x8
Sold my US equities Friday based on Lunar aspects entering post Full Moon, post Perigee, and defending to South Declination. Also February is usually weak and the Venus Inferior Conjunction is coming next month. Will be in cash until price reaches 4% below todays level.
hey valley,
we are upon the 1 year turn in the markets. The markets put in a low on 2/11/16, and started an epic run.
Is the astrology comparable from last year 2/11 and this year?
Wow Luri, I hadn’t thought of it like that. Looking at my darling DJIA, it went from 15400 to 20300 in a year. That’s a near 33% gain.
Now please somebody try and convince me that THAT is ‘normal’!!!
And this was the year when all the hell that the markets were afraid of has happened (Brexit, Trump, Renzi, bonds crash).
Astro wise it seems similar to me. Slight advantage due to year of Rooster. News wise the Trump Effect seems difficult to discount or short the market. And, I have been saying for years I believe based upon Jeff Hirsch’s Super Cycle Theory from Stock Almanac that we may have a 5 to 9 year rally as a new cycle of tech is unveiled (new materials (grapene), new energy (solar just the beginning), new robotics, drones, AI).
Good job Valley,
And thanks for sharing let’s see if the markets will drop 4%.
Mahendra is also convinced that we will drop 5% before March afterwards we will make a rebound.
But for the first time since 2009, he is not bullish for this year.
Best regards John.
Don’t forget LockheedMartin claims they will have operational nuclear fusion in 2020. If true, nothing is bigger than that.
Usually W5 is a quality with W1.. In the minute count W5 should have ended but it can go 1.618 of W1
1.618 puts us @ SPX 2320
HELLO JOHN
As you know i had a T.P. on 02/08/ and as we approached it i thought it would be a
top. But now it looks like a bottom or launch point for a break out to higher highs.
Still i think it needs more time to prove it self. will be watching your dates also…Nick
HELLO JOHN
MY next one is 03/13 ….Nick
Hey Nick,
Thanks ,
Let’s see what will happen this Monday if we do not turn my next date will be Februari 19/23
Let’s see what will happen .
All the best
John.
Well…astro-wise, considering the cycle, projecting the technical pattern, I’d say…PLEAASE DRRRRRRRRRRRRROooOOOooOP 😀
Have a nice weekend guys 😉
We have tidal inversions Monday and Tuesday. But not all inversions are equal. Some are stronger, Tuesday we have a strong inversion. Other timers also suggest Tuesday is important. I think it will be a high. Also think we are already in a leg down into 3/7.
I see a low 2/17, then a high 2/22. then 24/25 low and 27/28 high.
2/25 is a major date. Already told you 90 metonic years from 1929 gave 12/28/16. When we add half of a 1440 cycle, we get 2/25. The market has a tendency to test midpoints.
This is the main reason I think the big turn comes 22-25. So we need a low in between 2/17.
It is now possible to count a complete five up since the November 4 lows. It seems to be that these waves in SPX perfectly divide as zig-zags, with wave four retracing to wave one territory, and now a fifth wave overshoot of the 1-3 trendline. There is not an analyst that I have read who is not calling for all markets to move higher; Optimism market participants has now registered at a three decade high. Absolutely no one even remotely is considering we may have a GSC top in equities markets. It makes me wonder if folk think Mr. Market is going go hang out a gigantic neon sign blazing: “This Is The Top Everyone!!”
One or two analysts are grudgingly acknowledging the ED count is valid according all EW rules, but they insist all other indicators suggest it has a vanishingly small probability of being correct. We are after all, seeing bullish break-outs everywhere…
Verne,
What is a GSC top in equities?
Thanks!
Grand Super Cycle.
The late George Lindsay was the most consistent Market timer
in our life times .
To deny his work i feel is a mistake .
Here is why i am focused on Oct 2017 For the top
this is in addition to my other posts .
The late Jerry favors used to say that the nya was the
best index for market timing how ever he used the Dow
for patterns because everyone follows the Dow all over
the world .
Jerry Favors was the most influential and educational
person in my life in terms of understanding the stock market cycles,
timing as well as indicators .
If we see a decline ( Big IF ) ill add more to my bullish positions .
The Lindsay diagram Posted Below
http://imgur.com/MU0Tslz
Monthly $Nya showing the timing Below
http://imgur.com/k02KvS5
Peter Eliades is also looking at George Lindsay’s “Bottom to Bottom to Top” analysis.
For your information he is using the July 1932 bottom and December 1974 bottom…
Which he says are 2 of the most important bottoms over the past 100 years.
There are 15400+ days (I do not have the exact number of days in front of me) between the 2 dates. When you add those 15400+ days to the December 1974 low you get May 11, 2017. This lends itself to Peter’s analysis that wave3 is topping shortly…and after a wave 4… one more up in Peter’s wave5.
Not my analysis…Just passing that along! Not trading or investment advice!
I hope that information is helpful!
https://www.armstrongeconomics.com/markets-by-sector/stock-indicies/dow-jones/the-dow-beware-the-ides-of-february/
“Timing, we still see the risk that this week may produce the February high. Caution is necessary. February and April are the key targets on the monthly level here in 2017. Nonetheless, this still does not appear to be a major high from a long-term perspective.”
http://www.safehaven.com/print/43646/nowhere-to-go
“Continue to look for an important top in the Dow near February 10. As the Dow returned to near our price target (20,133) last Friday, this week is set to be a sideways consolidation as equities “spin their wheels” waiting for the big event to commence. Although the Lindsay work would have us erring later than earlier, equities may begin their drop earlier than forecast if they have nowhere to go but down.”
Peter,
Just curious…Was the site down overnight for some period of time? Trying to determine if there was a problem on my end or your end!
Site was definitely down in early a.m. I assumed for maintenance….
I don’t know. Could have been, but not to my knowledge. Looking at the server fault reports, I don’t seen anything major.
2 long term cycles turned 12/28/16 and 2/1/17. A shorter cycle that gave the august high gave a low in november and now gives a weaker high 2/14.
Yet another cycle gives a high 2/22.
So the trend is down for years. But these dates must be tested.
As we will be down for years the top is very round.
My understanding is that the 1942 low was significant. 40 years later a low in 1982 and 40 years later a low in 2022.
Cheers,
André
Andre’,
Do you have anything of importance around May 11th? See my reply to Joe…about 5 or 6 posts preceding this post! Not trading or investment advice.
Ed,
I have 3 crashangles that give 5/11. I have been wondering what that could mean. But it sure will be a significant date.
How about this, Andre! I was good friends with Joe Granville and when I showed him a completely separate calculation back in 1980 that pointed to April 1980 as an important bottom, it agreed with one of his calculations that was completely different and independent. Joe’s quote to me was “All roads lead to Rome,” i.e. it makes no difference how you calculate, if it’s a correctly based calculation, your answer could lead to the same conclusion as mine despite the different techniques used to determine them. With that in mind, watch this: Arguably, the 2 most important lows of the 20th century on the DJIA were July 8, 1932 and December 9, 1974. Adding the distance between those 2 dates in calendar days to December 9, 1974 gives you a date of…………………………………..May 11, 2017!!
The new blog post will likely be late today. I’ve had a lot of technical issues, which although resolved has put me behind.
A new post is live at https://worldcyclesinstitute.com/the-problem-worldwide-in-one-word-usury/
August 1982 to march 2000 , 211 months , added to march 2000-oct 2017
bottom to top to top count .
oct 1987 to oct 2002 180 months , plus oct 2002= oct 2017
bottom to bottom to top
oct 1997,oct2002,oct2007,oct2012,oct2017 , 60 months
from the low on October 1974 to October 2017 = 516 months.
41 month cycle peter talked about previously
8.6 years from march 2009 ? Oct 2017 ?
Longest Bull market in History ???? might as well set a few records
seeing how this thing is going to get very ugly when it ends
This website is for educational purposes relating to Elliott Wave, natural cycles, and the Quantum Revolution (Great Awakening). I welcome questions or comments about any of these subjects. Due to a heavy schedule, I may not have the time to answer questions that relate to my area of expertise.
I reserve the right to remove any comment that is deemed negative, is unhelpful, or off-topic. Such comments may be removed.
Want to comment? You need to be logged in to comment. You can register here.