
| “At the extremes, the herd is always wrong. One should not under estimate its capacity for stupidity.” |
| The Secret Life of Real Estate, Phil Anderson, p 329 |
I attended a meeting this weekend — an association meeting with my speaking peers. These are professional speakers (and those who would like to be). I have often referred to these people as “salespeople on steroids.”
One senior member of the group mentioned to me that he had just made a major stock market investment. I reminded him of what I’ve been saying for the past couple of years about the market topping and he said something like, “Well, if that takes place, a lot of people are going to lose a lot of money.”
I was thinking, “…. yes,” but didn’t bother saying anything. What do you say to someone who decides to buy high … and I would guess, eventually sell low? Hence my posting of one of my favourite lines at the top of this post. It’s amazing to me how some people have no concept of money and its value. But there you have it.
“Nobody” will have seen this coming.
This chart below appeared in a post on zerohedge, which you can find here.
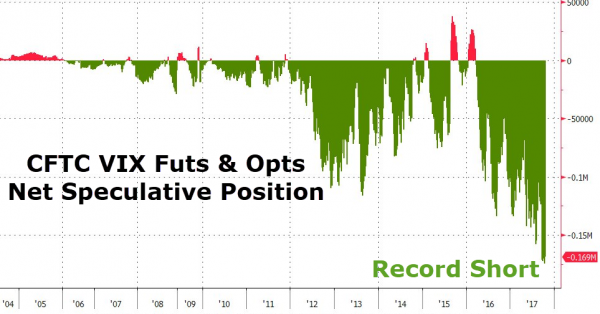
The chart of options strength signals, of course, that the top is near. The expectation of a higher market is now at all time highs. But, we’re not quite done. It should reach even crazier levels as we reach the ultimate peak. So, it’s not time quite yet to go long the VIX.
Herding Cats
During my 40 of so years as a television producer, I built a company with a team of creative types to support me in my work. There was an expression that I liked that usually pertained to IT people, but which also was a good descriptor of what it was like getting my staff into a meeting on time: It was like herding cats.
The market this past week reminded of that phrase, because there are times when it appears to make no sense … until I spend the time to review all the sub waves and determine wave counts sometimes right down to the one minute chart level.
I went into my analysis this weekend thinking that the US indices were completely out-of-sync with gold, the US Dollar, and other USD currency pairs. However, after a few hours of working through the subwaves on virtually everything, it’s become obvious to me that they’re not. What caused me some concern was the fourth wave we traced out in the US indices and futures. It was shorter than I expected and threw my thinking right out of whack (for Friday, at least).
I came back to one of my favourite rules about the market: The market does the most predictable thing in the most unpredictable way. And sure enough, that’s what my analysis has told me once again. We are going to end together, as I’ve been predicting for the past two years. The dollar is in charge (and it will signal the final trend change). All assets may not change direction the same day, but they don’t look to me like they turn that far apart.
This again reiterates the importance of considering all asset classes in the analysis of the ups and downs of this market. It makes my analysis here the “free blog” open to attack for the fact that you’re not privy to the extensive analysis I do each weekend across all major asset classes. If you don’t pay attention to the bigger picture, you can very quickly get lost in the very difficult structure of the US indices.
However, the entire market is moving as one. There can be no other conclusion than one that spells economic catastrophe is imminent.
_______________________
A true expert in Elliott Wave FL 2
A true expert in Elliott Wave …You are a true expert in EW analysis. What you provide is not available anywhere and is priceless. Subscription on your services is the best thing I have ever done. Many thanks for your effort to make me a better investor. I now have more trust in my investment decisions. I hope you will continue the excellent work! —FL |
The best of them JL 2
The best of them …Last couple of years, I subscribed to several ‘market traders’. You are by far the best of them and the personal contact is awesome. Daily and daily updates are very well written! Besides your expertise in EW, I also like your cycles analysis. Best investment I ever made! —JL |
Couldn’t be happier … KK 2
Couldn’t be happier …The analysis and insight you provide is simply amazing! I’ve been trading the futures and equity markets for well over thirty years and usually average around 5% monthly. Since joining your Traders Gold Service two months ago, that number has better than doubled. I couldn’t be happier.—KK |
Tops in your field DZ 2
Tops in your field …You are tops in your field. Tried to follow Elliot Wave international for years. They were always behind the market. After discovering you, I perceive that you are an expert in reading the waves, which puts you way ahead of the rest of your peers. And you can read the Waves like you are reading tomorrow’s financial section. I pray you stay healthy. —DZ |
Have not had a losing week RW 2
Have not had a losing week …I have been with Peter almost a year. The only thing that matters is have I made money with his service. I think I have finally turned the corner using Peter’s EW. I have not had a losing week in the last 5 months. Thanks Peter, for your amazing amount of hard work. —RW |
Get an upper hand … JC 2
Get an upper hand in trading …Seeing all the different currency pairs and the wave structures and hearing you explain why this has to do that on a nightly bases gives one a upper hand when trading. Elliott Wave applies to all stock and indices and can be applied to any candlestick chart. If someone ask what you want for Christmas – Tell them a membership to Peter’s “Traders Gold!”—JC |
the real deal SM 2
The real deal …‘Educational, insightful and thorough market analysis for all levels of traders. It’s Elliott Wave at its best….Peter Temple is the real deal’ —SM |
Rise above the rest … SM 2
Rise above the rest …I have only ever met a few people who, in their chosen fields (astrology, medicine, music, martial arts, technical analysis), rise above all the rest and you are one of them…you have ‘the gift’…and that’s why I’m a Trader’s Gold member. —SM |
The Market This Week
Here's the latest daily chart of ES (emini futures)
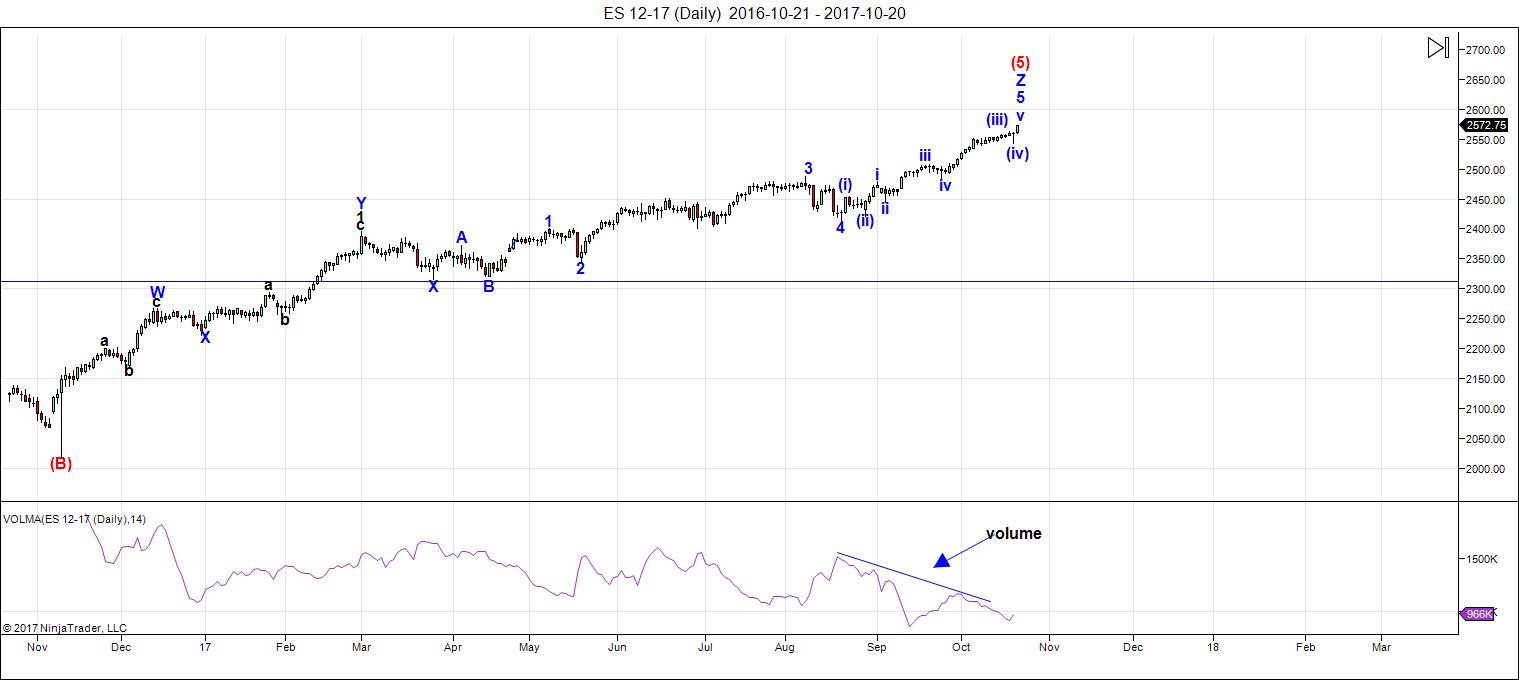
Above is the daily chart of ES (click to enlarge, as with any of my charts).
I have a full count on NQ/NDX but this week, ES faked us out with a very small fourth wave. We need a larger one to complete the wave count.
I spent many hours this weekend going through all the waves of all the assets I cover. That's because the US market appeared on Friday to be out-of-sync with the US dollar (something I didn't expect to happen). However, further reflection and analysis leads me to believe that's not the case. We're still on track for a final top ... it's imminent, but still likely a few weeks away ... we may move into November and there's no saying what the speed of the final fifth wave unfolding will be.
In any event, we're into the very final stages of this monster blow-off wave in the US indices. However, with the smallish fourth wave at the end of this week, the wave structure has an unfinished look to it. This supports a final fourth and fifth wave to parallel what's happening with the US dollar. Everything should top at the same time (as I've fairly vocal about since I began this site). This still appears to be the case. The market is "playing games" due to the difficultly of following the EW movement requirements across assets of different sized waves. It always amazes me how the market figures this all out without breaking any EW rules!
On a short term basis, I'm expecting a slightly larger fourth wave drop early this week (it may be another quick one and could be deeper than I expect—surprises are often to the downside in topping markets). My preliminary target is still 2530. The fourth wave we experienced this week was not large enough, and is now labelled as the fourth of the third of the fifth. The larger direction is still up. We still have the fifth wave of the fifth to go and that will play out across all asset classes, including gold.
Volume: Note that for some time now, volume has been expanding with selling, and drops considerably when the market heads back up. This is yet another signal of the larger, impending top. I've been predicting for quite some time here that it will drop off suddenly towards the top of the final fifth wave top. This it has indeed done.
Summary: The count is full for NQ, not quite full yet for ES. We're waiting for a valid fourth wave and then a final fifth wave up to a new high, to coincide with the currencies (most importantly, the US dollar).
___________________________
Trader's Gold Subscribers get a comprehensive view of the market, including hourly (and even smaller timeframes, when appropriate) on a daily basis. They also receive updates through the comments area. I provide only the daily timeframe for the free blog, as a "snapshot" of where the market currently trades and the next move on a weekly basis.
______________________________________
Sign up for: The Chart Show
Wednesday, November 1 at 1:00 pm EST (US market time)

The Chart Show is a one hour webinar in which Peter Temple provides the Elliott Wave analysis in real time for the US market, gold, silver, oil, major USD currency pairs, and more. You won't find a more accurate or comprehensive market prediction anywhere for this price.
Get caught up on the market from an Elliott Wave perspective. You’ll also get Andy Pancholi cycle turn dates for the SP500 for the balance of the current month. There’ll be a Q&A session during and at the end of the webinar and the possibility (depending on time) of taking requests.
All registrants will receive the video playback of the webinar, so even if you miss it, you’ll be sent the full video replay within about an hour of its conclusion. For more information and to sign up, click here.


“Herding cats” – I love it
🙂
My surprise at the failure of VIX to print a new 52 week low in the face of the relentless string of new highs could well be missing an obvious signpost. At a top of historic significance, VIX should indeed be expected to ominously diverge from market price. That zerogedge chart is instructive. Now in fact I would not be at all surprised to see the divergence continue and intensify. I expect few will pay any attention, or even notice…
Verne,
An explanation to the VIX suppression is contained in one of the most interesting articles I have read in the past year or two. It is over on zerohedge.com on the 3rd page entitled “In the Shadows of Black Monday – Volatilty is not Broken….The Market Is.”
Adds the “WHY” to Peter T’s 500 year Top! It a long long commentary but is well worth the read!
I hope Peter T will read it and comment!
Thanks Ed.
Peter
I might be short in the overnight session yet until I see
5 waves down my trading will be short term in nature .
everything I have been looking at from a broad view says
its over . shorter term I’m mixed .
A link to what is written below and it is worth listening
to the video .
https://www.bloomberg.com/news/articles/2017-10-12/ecb-is-said-to-consider-cutting-qe-purchases-in-half-next-year
Policy makers led by President Mario Draghi are becoming increasingly confident that they can agree on Oct. 26 to the specifics of how much debt the euro-area’s central banks will buy in the coming months. After more than 2 1/2 years of trying to revive the region’s economy through bond purchases, some governors see the recent period of robust growth as a reason to rein in the support. Others are concerned that inflation remains too weak.
The European community reminds of the great Roman Empire at its peak. The Roman Empire eventually caved in due to corruption, high taxes. Crooked politicians. We are now seeing the same thing in Europe, corrupting within the establishment. History does not always rhyme, but it certainly repeats it’s self. The problems in Spain is only the beginning. We will soon see the unravelling of the whole European empire, which will be reflected in their currency. Some of the money will be going into the US bonds and stock market as a safe haven. Good bye Euro.
Inflation is the issue. These bankers are old fashioned and used to inflation. The whole point of technology is to deliver lower costs and hence prices to consumers. Low inflation is not necessarily a bad thing but a product of advancement but these muppets only want higher prices as that all they know. Without wage inflation higher prices are bad but we need a new generation of central bankers to understand this. Deflation is brilliant if it’s due to cost cuts from technology but the bubble we have now will lead to deflation because of the bubble. I hope voters get hit hard in the coming depression so they only elect a government ready to dismantle central banks.
Sliding 2 batches of shorts this morning at the upper trend line. One batch tomorrow. Not expecting major correction. Just enough for a nice bottle of merlot for the weekend. Lol
Luri, I just saw your question on the former bog page. I did my best to answer it.
thanks dave,
my thoughts are clear….. ……'”why return to re-travel a path previously taken”….. Let us look toward the grandness and newness of light as it strikes the morning horizon, and journey upon paths yet untread…..
in other words, no looking back at old blog weeks…..we shall…. “fight club”…. it out in this weeks blog…….and the first rule of “fight club” is?………………………
correct!
Luri, one last note. ” Those who do not learn from the past, are doomed to repeat the Past”. End of discussion. Lol
EXACTLY! Here’s the combination I like: “Those who cannot remember the past are condemned to repeat it.” (George Santayana)
I’ve got news for Mr. Santayana: we’re doomed to repeat the past no matter what. That’s what it is to be alive.”
― Kurt Vonnegut Jr.
I like that last one !! Lol
Verne, you are looking like a genius, with those vix calls.
BTW, it is always a bit risky putting your money where your mouth is but I have learned the most over they years from posters who do just that, rather than blather on about probabilities, so I occasionally try to do the same. 😉
Unlike you Verne I did not put my money where my mouth is. Only 2 batches today. Not a full batch of 3. Looking for a retrace tomorrow to be fully short.
Looking for 50% retrace to be fully short.
Probably the more prudent approach. I have noticed that the times VIX begins to consistently diverge with market price are generally good predictors of what is coming next; not always, but often enough to offer a good risk/reward set-up…. 🙂
How sweet it is! Took profits on some nearer dated calls this morning; looking to roll remaining now that we FINALLY have some VIX B band expansion underway. I was prepared to be underwater for a bit but under these extreme conditions I suspected one was better off being a bit early…. 🙂
If this market continues to follow the inverted crash cycle
then we should see a temporary Low this week .
that said a bearish bias for the week . the next rally
will be important . A lower high would be ideal .
to many short term cycles to explain it all .
need to see 5 waves down and on the 1 hour dow futures
I can only count 3 waves down at this point .
the cash dow all time high at 23368 and change was just
1 point into the 23367-23471 range so price has been satisfied
and a bit of confirmation for the calculation yet I still
need to see 5 waves down before concluding we have topped.
monthly chart does not have a completed 5 wave pattern to the upside
at this juncture so this can be considered a 4th wave of sorts .
all for now and no real solid opinions at this point .
I think the odds are high that it is indeed a fourth wave. They have been frantically bought and so very shallow of late but we could finally see that 0.382 re-tracement ahead of one last wave up. I was on another site today and some goon that posted he was going to be 100% long come Monday had the temerity to start nagging me about how I have been wrong in my bullish sentiment on volatility since March. The funny thing is I have been posting all my trades in buying VIX under ten and selling the pops for the last few weeks and I still get grief from this guy. I told him I just hoped he had tight stops in place today. He apparently took umbrage over my saying that if I saw another 52 week low in vol, which could well happen if we get a fifth wave up, and which I expect, it would be the long vol trade of a lifetime. I guess you just can’t please some people. I tried my best to be gracious in my response to such idiocy.
Apparently Hochberg and company over at EWI are calling a top. Based on my own experience with that crowd, I will consider that prima facie evidence that a top is NOT in! 🙂
Good on you Verne. Taking the high road.
Peters has extensively researched the coming cold period. I wondered for some time on how one could take financial advantage. I asked Joe this very question when I saw him in Portland two weeks a go. He replied, wheat and natural gas. Looking at the charts, wheat is now approx a third of the price vs 2008. I feel like I need to start diversifying my portfolio. You do not need to be a rocket sciencetist to realize that wheat has been basing for the last several months. Having all your eggs in one basket is very dangerous. The risk reward looks very promising for the next several years. This investment will be part of my longer term portfolio. No, short term trading.
Pp
I do think that is wise. Sadly few people these days seem to be capable of taking that kind of long term view of things, whether you are talking about volatility or commodities. I think the explosion in food prices is going to be a great game changer for many who do not see it coming and another thing the central banksters will be utterly powerless to paper over. My thinking about these things involves not just positioning my portfolio for what is likely to happen, but also choosing a place to live where you can grow food year round. My home island of Tortola would be perfect if we could just figure out how to survive cat 5 hurricanes!
🙂
We all tend to be narrow minded and lack the vision to truly succeed. Most blogs are totally focused on sp ES ect. We all know what’s coming down the road thanks to Peters research. It is just a matter of degree on how severe it will be. We have some high calibre people on this blog, some who comment and some who do not. ( I am not one of them) lol. I would appreciate ,if all those who visit this blog please throw out some ideas. Ex investing in snow blowers vs lawn mowers, warm down jackets vs swimsuits . I would like to think this blog is for, exchange of ideas to help support each other. Unlike the other notorious blogs of endless debating on politics ect.
Sadly, most blogs are not places to glean very useful information. You see lots of sniping and various and sundry perspectives offered but very little talk of actual trades people make, and the success or failure of the rationale behind the trades. I guess one cannot expect too much these days huh? 🙂
I would like to think that are group of traders on Peters Blog are much more mature , respectful of each other beliefs and trading methodologies. Sharing and supporting each other to greater heights of knowledge and wisdom.
Can anyone tell me what they think of TSLA?
(a) Is it a C wave in a descending triangle, maybe go for a double bottom with July 10 low as target
or
(B) already topped?
The Economist flagged TSLA, UBER, NFLX in this article. https://www.economist.com/news/business/21730446-five-outliers-chesapeake-energy-netflix-nextera-energy-tesla-and-uber-have-collectively
In the fourth wave of an ending diagonal: TSLA.l One more wave up to a new high.
Thank you very much Peter T and Red dog!! <3
Peter, could you post a chart showing the TSLA waves. Earnings report in Nov. 2. That will determine a lot of the movement.
https://worldcyclesinstitute.com/tsla/
Random thoughts. Looking back late 2014, IYT, QQQ swing high 11/28/14. SPY swing high was 12/5 but all faded together Dec. 8th.
So far for 2017, IYT swing high 10/13, QQQ 10/18.
VIX, VXN nice daily hammer today. NUGT 10/2 low held.
https://www.youtube.com/watch?v=sot8sJej4iw
TSLA same boat.
I got that video update done tonight. I’ll post it in the free blog on the weekend: Big Picture, Volume 2
nice
Somebody wants to get their book out quick .
Harry dent and Andy pancholi
Might be a decent read
https://www.amazon.com/gp/product/B0755V9481/ref=as_li_tl?ie=UTF8&tag=hh0e9-20&camp=1789&creative=9325&linkCode=as2&creativeASIN=B0755V9481&linkId=d59b4a63e5954ef3c62cdc3487c129cc&inf_contact_key=7db78e30cc9b966ff3ad99ee3773ff90ace690f8e1ed0f2cd7933e65b1bd2e0a
The weak attempts by the bears are preventing a good down leg. Knocking the DOW down by 50 points is peanuts and we need a 200 point down day for things to accelerate. Until then its a slow grind up. Andy Pancholi has a major cycle date this month and Mahendra Sharma is still clinging onto the cliff edge with his pinky but i fear not much will happen until the bears overcome Cybernet and its machine buying.
still watching for the anticipated pivot, more likely Thurs a.m. and will not be happy but not surprised to see SPX tag 2583. Then it looks like a dropoff to 2475 area and it could take till January 2nd week. Follow the sun line……
Verne, what would be a good expiration for vix calls if that is my view, shorter term or longer term–how do you decide?
I’m holding Feb 2018 9 strike VIX calls I bought for just under 5.00 cost basis. I have been scalping VIX moves below 10.00 for the past several weeks and selling each time it goes back into the 10.75 to 11.00 area. The gains have been small but consistent and in fact has allowed me to get positioned long courtesy of the house. I will typically buy 100 9 strike calls, sell half when VIX pops above 10.50 and repeat the process. You can literally reduce your cost basis to just about zero in three or four scalping trades. For this approach I have been buying calls at least three weeks out. Hope that helps a bit.
but looking as if swimming upstream on those options would be better if you were short premium….
Not intended for extended stay. Idea is cash out and roll forward for accretive long vol position…
I will continue to be a contrarian to the crash theory. There will be no crash. In short, there will be a correction to the 2200 level in the coming months. This level will not be seen again for decades, although will be revisited on a larger wave retrace next year. This is the last chance to get long ( you should already be in )for the biggest bull market in history. By Peters own admission, he has been calling for a top for 2 years. During that time the SPX went from 1800 to almost 2600. I think Peter will adjust his EW count to reflect this as he realizes that it is a new era in market control.
I have not be calling for a top for two years. I have projected a top once the US dollar has reached its target and it hasn’t yet. It’s been my constant theme and I’ve even posted videos here to that effect and been told I didn’t know what I was talking about—that the dollar was not correlated with the market. Well, guess what, it is.
So let’s not put words in my mouth, PLEASE.
Ken! Can you explain using your economic genius why the business cycle of boom and bust does not exist any more? Perma-bears are stupid but so are perma-bulls.
Is it not obvious that Ken is pulling your leg? 🙂
After all the man is not insane.
Beware of “New Eras” in anything! No opinion on a crash or not, but your expectation that the 2200 level will not be seen again in decades is exactly the type of super-bullish mentality that a good market historian would expect to see at this stage of market overvaluation and extension. I know it may be considered an antediluvian valuation tool, but the dividend yield on the S&P Composite Index is below 2%. Whenever that has occurred over the past century and longer (using surrogate indexes before 1920s), the outlook for the next decade has been miserable with expected annualized returns between -3% and +3%. I expect you feel “this time is different” but it never has been in the recorded history of financial markets. The -3% annualized doesn’t sound horrible, but it doesn’t account for the dramatic declines that usually occur in the interim periods after such dramatic overvaluation. Your sentiment is mirrored by so many analysts today and I would be curious as to how you formulate such a super bullish opinion. I have surmised it’s from things you have read from others. If it’s your own opinion, I would love to hear your rationale.
When you look at P/E, current forward and trailing compared to historical, when you look at price to sales, when you look at equity value to GDP (currently 140%), when you look at the severity of overbought conditions by way of stochastics and/or RSI, when you look at volume, when you look at advancing a/d lines, when you look at the number of stocks hitting new 52 week new lows, when you look at where the bulk of the market’s advance is focused (remarkable example with IBM recently), when you look at global geo-political risks, when you look at history….you are really asking for a RATIONAL basis for such an outlook? You are a better man than I! 🙂
Oh yes, I did forget to mention sentiment didn’t I? 🙂
Bought my last batch 2568. 3 batches total. Last week, my model said the high for oct 24th. ES has not, but the Dow has made new highs today. I will sell out slowly each batch. Most likely Friday for lower lows. I am Not expecting anything to dramatic on the down side. Just enough for my bottle of Merlot. Lol
Listen to me now “DAVE”…….. and BE WARNED……..i hope you “BE” wearing diapers for the utter “shock” and “awe” you will experience at this “not expecting anything to dramatic on the down side”………..comment of yours…………………..
DIAPERS – DAVE!………. BE WARNED!
https://pbs.twimg.com/media/DM4_-L0X4AU9k06.jpg
Thanks Luri, Lol. I never get to excited at the extreme possibilities of a trade. If we get a 20 to 40 point decline, I would happy. If the slim chance that we have a greater degree of a correction I will have one batch to capture the bulk of the move. That is why I go in on 3 batches, buying in and selling out. Side note, I hope you are correct in your assessment of the waves and that I am incorrect.
Joe, I sent you a email.
For all you hard core bears. Every bearish article referring to today’s low volatility being similar to 1964. 1995. SP rose 8% and 20% the following year. I hear the same excuses from the bottom of 2009. Stock prices over valued, PE ratios out of wack, dividends yields not in line with the under line stock price, over valuations ect. Over and over the same excuses from the bottom of 2009. I suspect a lot of bears are wired up internally to fail in life financially . Always trying to top pick for a major crash that never seems to materialize. Some of the hard core bears need to first admit to themselves they have been wrong. The definition of insanity, doing some thing over and over and expecting a different result. Verne is a definite bear. 2 thumbs up thou ,for him. At least he has a plan with the vix calls to capture some of the spikes. Joe, is a remarkable man with his visionary insights into crunching numbers and implementing his trades. Any newbies, please do your own home work and leave the hard core BEAR PORN behind.
I can hear it now, Dave is going to be a great contrarian play. All I can say is , I will meet you at the sp 2600 level. – 2700 level with or with you over the next several weeks. All the best every one !!
I meant to say, ( with you or with out you )
I like a man that puts his money where…well, you know. So…how are you trading the anticipated move up? Not that I necessarily think you are wrong mind you. I sold 30 diamond 123 strike CALLS last Friday as my own count called for completion of a third wave up. Being bearish is not the same as being blind. The trend has clearly been up. I think that has now probably changed, or will soon. Good luck with your bullish trades!
Yes good to have a view Dave, we all negotiate probability. I’ve often questioned my BEAR traits over the past two years, but is it ‘insanity’ or just ‘impatient’ ???
We definitely know why the BULL returned in 2009 ….’QE’ …. this outright market manipulation was always BULL orientated, the greatest splurge in history deferring the biggest debt bust in history.
But I have a sneaky suspicion the definition we need to focus on is INSOLVENCY ….
http://www.usdebtclock.org/
A very smart person once told me ‘reality bites’. They also mentioned that ‘patience was a virtue’ ….. good luck which ever way the cookie crumbles.
https://am.jpmorgan.com/us/en/asset-management/gim/adv/market-insights/5-myths-about-u-s-government-debt
The cash dow poked above its upper resistance today at 23471 .
the slight poke above at 23485.25 is all i can accept at this juncture.
if the dow closes above that high the next upside target becomes
31,200 which is a long ways away .
the dow futures appear to be falling in a 5 wave structure yet that
cannot be labeled until after i see a bounce and see how all the sub waves
look after the fact.
Key support is now the oct 2017 low at 22416.00 and 21766.41.
Despite the extremely bullish potential i still see next year as bearish.
How ever i do not want to see the dow making any more new highs
or ill have to accept im wrong .
Bottom line : sticking to my bearish view until proven wrong .
the initial topping range was labeled as 23367-23471 range .
this range has now been satisfied and then some
( 14 pts above the upper limit )
that’s all i m giving it .
the timing into oct 19th has come and gone .
the initial strong move oct 14th to oct 19th has come and gone .
we still need to get through the ven merc sun conjunction which concerns
me from a price point of view .
price is done as far as i can see ( unless 31,200 is next ) timing
still runs into dec 1 also dec 13 and jan 2 2018 .
Nov 7 im questioning as a wild card ( its the typical seasonal low )
wheat and nat gas appear to be at the least basing .
My issue with the dow monthly chart is i do not see a 4th wave nor
a final 5th . while shorter term charts ( weekly ) also needs a 4th and 5th .
the only way these waves can be considered is if the assumptions of a completed
impulse ( 5 waves ) is the correct point of view .
3 wave moves do not need 5th waves .
Hence staying cautious yet bearish and being patient .
Wayne
i don’t feel that QE turned the market around in 2009 yet i do think
it has helped the market along since 2010 .
Mario Draghi is what concerns me on the bearish side of things
the ECB tapering is what i think kills the bull market which is why
i posted the link on the previous thread .
the 2009 low bottomed exactly to the day of both a puetz crash window date
as well as the mars Uranus cycle low in addition to Venus mercury and the sun
and several George Lindsay time counts . we had many cycles some together back then just as we have coming together today as we near the top or have topped.
What i find more amazing is this market is going higher in a crash pattern.
the panic is on the buy side .
The us dollar has retraced back to its .382 retrace level from the 2008 low
to the 2017 high .
while i cannot see a good reason to be bullish the us dollar using my own indicators i can see the the dollar on a monthly basis has turned up .
resistance sits in the 95857-96002 range .
The best i can see from all of this is a long sideways range bound market
for the next year .
the worst is we have seen the high yet we get some choppy action
for another month ( i do not want to see any more highs in the dow )
anyways
the 2009 lows were cyclical lows despite QE
the bear market from 2000 lasted into 2009 ,
a 9 year bear market for the most part ( 8.6 years )
and we now have 8.6 years of upside so the moves are balanced
at this juncture .
I sold my house back in 2005 near the highs of that year and had to
wait until april 2009 to buy another house , i ended up being 3 years early .
home prices bottomed in Feb 2012 .
I recently took long positions in etf’s using Weat and Ung because i feel that
they are both longer term over done on the downside just as many see
the vix as overdone on the downside . using various etf’s gives me the ability
to ride out swings vs using vs futures or options which are leveraged.
They say buy the rumor sell the news .
The stock market has been up based on tax cuts . that is the rumor
The other rumor is reductions in regulations and overhauling healthcare.
sell that news . ECB cutting back on QE will kill Europe and probably the entire
bull market but what will be the Trigger ?
confidence will be the trigger .
At some point someone comes out and say hey nothing changed and poof
markets turn on a dime.
Bottom line : i leave myself with a manageable amount of stocks that i hold long
and a fair amount of cash .
Leaving things for the most part as they sit until Jan 2019 and sticking to my
bearish thoughts .
Sideways or down hard i would consider both as bearish.
I don’t want to sound churlish but when I looks at charts I see bearish rising wedges in all the indices. I see people everywhere making outlandish predictions on how bullish the markets are and keep wondering “What the hell am I missing? Are these people looking at the same charts?!!” Forget about the historic complacency , the true state of the economy and myriad geo-political risks. Smart money in the form of the instiututional investors have been leaving the market steadily for some time now – just look at their money flows!
On the other hand, bearish traders agonizing about every market tick are also wasting their time. The charts say a big move down is coming, and the nature of rising wedges is that when they break to the downside, nobody sits around scratching their heads and wondering about whether a turn has taken place or not, Trust me folk, it will be obvious, even to the blind!
Oh Wayne
my last thought and i view it as poetic yet its very speculative.
Just as Ben Bernanke ( helicopter Ben ) was the right guy for the right
time so is Donald trump . who is the guy who understands bankruptcy ?
If Trump was to start talking about renegotiating our debts just as he has
been trying to renegotiating everything else then the united states
would be flush with a lot of cash ( no debt to service ) . The us dollar would
decline possibly under that scenario yet it gets complicated since interest rates
would spike which would strengthen the us dollar.
Keeping my eyes on the ECB since they are what i think kills the bull market
the rest above would probably be the aftermath ( trump and debts etc…)
1 day doesn’t make a trend yet i see money going into the dow and into semi conductors and thats about it .
my view is we are about to begin a longer term commodity cycle
so for my money that is where im looking to position myself from a longer term perspective .
Appreciate your content Joe, the markets such a conundrum these days, both fundamentally and technically. I experienced the fundamentals first hand in late 2008 working for a UK institutional bank that dissolved within a few days, shortly after Lehmans. Was a hard pill to swallow but reserve bankers and government officials were proactive in saving the global financial environment and avoiding contagion that threatened serious serious trouble (shareholders and employees paid a price). Money print stance has been maintained but the fall out is massive credit growth in a world of low inflation and limited revenues. Even helicopter Ben couldn’t provide the amount of US dollars now required to repay the snowballing (leveraged) debt. Anyway enough about funnymentals…….
I’m short S&P500 at 2570 based on techs (yes worried – close stops)
Liked 2580 top based on Gann Sq of 9 (opposite 666 and 4500 degrees).
Dow also hit my trend line last night – start from Oct ’02 low through Jun ’05 / Mar ’07 / Aug ’07 / Nov ’07 lows and extend right…
Can see an Andrew’s Pitchfork resistance at 24,000 also off Oct 2002. This could align with trend line off top Feb ’04 through top Oct ’07 around 23rd Jan ’18.
Even broken clock is right twice a day : )
Joe I have quick question if you don’t mind. I have heard so many cycle watchers comment on the fact that many expected turn dates have come and gone this year it has me wondering why that is happening. A number of predicted Gann turn cycles came and went this year and when you mentioned the same thing in your post it had me wondering if you had any thoughts on this. Thanks!
Verne, possibly due to big Gann cycles due in 2019…
supposedly generational (90 years…45 years…144 years…12 years or 144 months)
Possibly add 180 weeks and 90 weeks?
11th Feb 2016 low plus 180 weeks = 25th July 2019
25th July 2019 less 90 weeks = 2nd Nov 2017 (a check date???)
Could 2019 be significant High or Low ?
Thanks Wayne. One guy i know (Flannigan) was really focused on what I thought was a 30 year cycle whose window closed sometime back in August. I could have possibly confused it with some other cycle, not Gann.
Sold one batch 2557 level. Verne I am off for my Starbucks coffee. Will respond later with your questions
Another batch sold 2553 via 3 x short etfs waiting for retrace to buy back shorts one batch left.
Wow. Should have listened to Luri. Lol should of waited before bailing on my shorts.
Bought 1 batch 2551 level. Now 2 batches short.
The “Galatic Cross” is upon us — be at one with the god of all oneness – …..oh yes….. and ……………………
BE WARNED!…………………….
https://invst.ly/5kly5
Taking profits on my VIX calls. I fully expect the clueless lemmings to provide another oppotunity for reload.
Dent. Has some kind of news conference today at 4.00 it is free. I am not a big fan personally, but will listen if I have the time.
Out of one short 2544. One short left every trade posted within 2 min.
Sold 2543. No more shorts. Good enough for my bottle of merlot and a 6 pack will wait for a possible retrace.
Going back in these shark infested waters again. Not smart thou, as Peter as stated before do not over trade. One should not go to the well to often, or they find the well dry. Just bought a one short at the 2550 level.
“Not smart thou”
Waiting to buy anther batch shortly.
Looking for the 2555 level to buy anther batch.
how “pretty”………………this pattern is playing out in “textbook” form…….. for those too young to remember ………. a “textbook” is an old school term for brain “drugs”……..
https://invst.ly/5kon5
I like that 2520 level. Expecting to break the lows of today to head on down to the 2520 level, after this retrace.
That may take til Thursday
hmmm dave………….. food for thought?…………….
https://invst.ly/5kp77
My line in the sand is the 2558 level. I am going to wait for that area. I do not want to give back my merlot, 6 pack okay. Lol
yes, already – “the galatic cross” was only predicted precisely thousands of years ago by the Mayans – but they were so technically “primitive” …. yesssss …. it could never happen!!!
https://invst.ly/5kpp1
I am wondering if those aLgos are looking for that 2558 level and decide to stop short of that level before heading back down. Hhhmmm
I did not go for the 2nd batch, will look at it tonight for a game plan for Thursday.
Long lower wick on candle today bullish. The decline was bought with deep pockets once again stepping in to arrest and reverse it. Let’s see what futures bring….quite a battle underway….
verne,
my liege – long lower wicks are mostly bullish …..yes………….but on the occasion of the “galatic cross” ………….. well who knows?
https://invst.ly/5ksdo
Our friends in the cabal are thrashing around methinks. Wait till the real selling starts. That lower wick is going to probably get swallowed like a whale swallowing plankton…. 🙂
Verne
reposting your question since it is a good one.
I began responding yet decided I’m going to think it through
in order to give you a better answer .
ill answer this later today. sorry just have my head somewhere else at the
moment .
Joe I have quick question if you don’t mind. I have heard so many cycle watchers comment on the fact that many expected turn dates have come and gone this year it has me wondering why that is happening. A number of predicted Gann turn cycles came and went this year and when you mentioned the same thing in your post it had me wondering if you had any thoughts on this. Thanks!
Gann cycle dates have not come and gone yet.
Gann did not use the solar calendar to compute his dates. We have decades, years, months, hours, and minutes, measured by celestial objects. One just so happens to be the rock we live on, the other, the Sun.
Now think in terms of other objects out there — Uranus, Saturn, Jupiter, Mars… They all have different orbit times around the Sun. Ours is 365 days, Mars is 687 days, etc…
I do not have this figured out yet. It can’t be just the sidereal cycle of one planet, because the 1929 top occurred when Saturn was at 270.5°, slightly into Capricorn and in 1987 the top occurred 10° earlier.
I’m quite sure he used the slower planets to look at the larger window. He had to narrow it down by either looking for certain aspects (like conjunctions, squares, etc) or by calculating the angle between two planets at the start of a cycle and knowing the angle and date for the cycle end.
In the 1929 to 1987 cycle, Saturn & Uranus started out with a 100° angle and ended within 5° of a conjunction.
Saturn does not enter Capricorn until Dec 23, which just so happens to coincide with a Solstice, another important Gann date.
We also have a Mars window cycle opening up. Exact date Nov 6, but could start 3° earlier — so I’d say there’s a possibility we run to a new high (after this leg down is done) then drop down again next Thur, Fri, or Monday, or if the market Gods are on our side, all 3 before the next bounce up.
Hopefully someone here can take this info and run with it to make more useful for trading. If you decide to tackle the task, use a heliocentric ephemeris, not the geocentric stuff common on all the astrology sites. Yes, it matters. I’ve back-tested some strategies and the accuracy rate was unusable with geocentric data.
Thanks Mike. My understanding of Gann is limited but I briefly subscribed to a newsletter that outlined a 30 year cycle window that closed in the July- August time frame. It could be I mis-read what was expected but I got the impression that the window was missed.
Mine is limited as well. I posted what I knew in case someone else would be able to figure it out. It’s tricky to figure out which cycles are overlapping which as well. Are we on a 45 year cycle from 1972 along with a 30 year cycle from 1987? Or is it 45 from 1973 & 30 from 1988. Then there’s all the 10 year tops and bottoms to match up. The astrological research is so intense, I downloaded the heliocentric data from NASA’s website, put it in an SQL database, and wrote my own routines, since no common astro program can run these calculations. The Gann cycle programs are absurdly expensive for what they do, but may be worth it, since I’m going nowhere fast. Let’s just see what happens with the Mars cycle, if it acts as the second hand on the clock, while Saturn is the minute hand and Uranus is the hour hand. The next Mars window after Nov 6 is not until April 2018.
This is just a wave iv, no need to panic. We still have a wave v up to finish a 3, then a bigger wave 4 down, and a wave 5 up to finish. IMHO.
Am I correct in assuming you think this is a fourth wave at minor degree then?
If so, what degree of third wave are expecting to be completed by the subsequent fifth wave up if you don’t mind my asking? Thanks!
the next wave up finishes intermediate wave iii, then we have int. wave iv down, and int. wave v up to finish. What wave that actually finishes is debatable at this point, but there will at least be a big pullback. Hope that helps.
Yep. My favorite count has us completing an intermediate five of primary five after this move down, which I have as being an intermediate four. Thanks again. You count is one degree lower than mine.
The email I sent you last week, did that help and did you like it?
One of the best analysts I have seen. Thanks! I think he also has us just concluding a minor three.
https://www.youtube.com/watch?v=A-sXx-WpMVk
http://tinyurl.com/y8xdp7yp
“Bubble Denial… Just As It May Finally Be Peaking” – Harry Dent | October 25, 2017
http://tinyurl.com/y9xeha9k
“Andrew Pancholi’s model has the strongest turn point in decades this month”
I hope no one takes this the wrong way,
I have a lot more respect for people who can say this is the call I made and it was wrong, Now here are some possible reasons.
As opposed to people who just seem to forget that fact, and plow ahead with yet another dogmatic , attention grabbing assertion. It really wears me out having to listen to that kind of analysis. No disrespect to Mr. Pancholi or Mr Dent.
The ironic thing is I actually share their bearish outlook. It seems it should be clear to them and everyone else listening to them that none of us know exactly when this thing is going to turn. Enough with the predictions already!!! 🙂
“Enough with the predictions already!!!”
Does that include your posts?
Absolutely! At least I offer full refunds! 🙂
BTW, can you show me a single prediction made by yours truly?
Opinions and predictions are not the same amigo…
Just to be fair, I found Harry Dent’s most recent presentation and listened to his most recent take on how he views the market going forward. The presentation still has as its core message that demographics has “the power to predict”. Sadly, he still appears to be insisting that he can forecast with good precision what the market will do and when. I do not doubt the validity of what he is saying about the usefulness of demographics. He has already amply demonstrated that he does not know, demographics notwithstanding, when the market will top. No one does. We can at best make intelligent approximations as a result of application of the various analytical tools at our disposal. Been there, done that….
the series of responses to my posts are fascinating…my reason for posting was crystal clear…”NOT A FAN OF HARRY DENT’S…HOWEVER, DENT’S PUBLIC ARTICLE REFERENCES ANDY PANCHOLI’S CYCLE WORK AND EXPECTATIONS”…Andy Pancholi publishes a monthly Market Timing Report…it would have been inappropriate to post Pancholi’s subscription material…however, a public article is fair game…for a very long time Pancholi has been forecasting a major turn in the October 2017 time frame…here we are…Pancholi NOT Dent!
Verne
the main cycles this year beginning Jan 20th and march 27th
were cycle lows which pointed higher into Dec 1st and mid Dec early January 2018 . May 17 2017 was a very short term cycle low as well.
with those cycles pointing upwards the best you should have expected from
a bearish point of view was that the turn dates would be short term only
and that the longer term move would be upwards .
if anyone tried to use gann dates they may have been correct in the short term
yet the larger cycle was pointing higher so they didn’t call for any major top.
It is the analyst that gets it wrong in his interpretation of the cycle .
the same holds true with Elliott wave theory .
you cannot trade the markets based on your opinion, you must trade the markets
based on what is right in front of you . To many people form a bias and then try to
create a wave count or cycle count to confirm their view rather than look at the market for what it actually is and see how well the wave counts or cycles dove tail into what the market is actually doing.
I cannot make any claims to any gann turns dates because it is not a method I use
but I do make notes of my own cycles and turn dates and I look at the internals of the market as it comes into its turn date and see if the technical back up my cycles work . Case in point was the august 21 date , when I saw that it was not going to be a High and I understood I still was looking for a high into oct 19th as well as dec 1 etc… I had to conclude that we were going to see an inversion and the market would rise instead of fall , and I changed my mind based on my understanding of the puetz cycle and the fact that is has been prone to inversions for the past couple of years . It comes down to being flexible and accepting you were wrong in your prior assumption and adjusting to it in real time since you now have more data to digest.
I made a comment on here several months ago that went like this .
your on a beach and the sun is out and the weather is beautiful in July august for example , a guy comes up to you and tells you that in 1 1/2 hours its going to pour down rain, do you go out and buy an umbrella ? or do you look up at the sky and
say I don’t think this is right so ill watch for dark clouds or something to give me some kind of warning ? what I wrote was something to that effect anyways .
the same holds true with the stock market or any market for that matter.
The turn dates or cycles are just a window of opportunity where the odds go into your favor if a turn is going to happen , yet that is all it is .
The puetz window tends to follow a somewhat predicable pattern so I pay attention to it on a short term basis ( 52 trading days is all it lasts yet you get 2 of these per year hence 102 trade days of the year ) How many trade days in a year are there ? 260 ??? somewhere in there ? rough math yet 102/260 is 39%
so roughly 40 percent of the year in terms of trading days correlates to the puetz cycle and the past couple of years I have seen several inversions .
One thing I do when I read anyone claim a specific cycle and they come up with an outcome that is what ever % accurate . I actually look at it and analyze it and see if what this person is saying is actually true or not . One thing I have seen many times is people claiming certain planetary pairs imply x and more times then not what I see is more of a 50/50 odds at best, and sometimes even worse .
So , yea we have seen many turns dates come and go this year yet they are now in the past ( that was my point , they are now behind us ) we have new cycles coming up which are calling for tops as well as pointing to lower prices .
Does this mean we should expect dow 10,000 or lower ?? definitely not .
what it tells me is I should expect lower prices and I should do my own detailed
analysis based on wave counts or pattern analysis to define where I feel a minimum objective should be and I should look out to January 2019 before expecting a bottom .
To wrap this up : Lets say that between now and January 2019 the stock market just goes into a huge sideways pattern ( not saying this will happen or making a forecast ) but lets go with it and say that in January 2019 the dow is in the 19000-20000 area as we come into the cycle low . At that point in time I will look at the internals of the market as well as the longer term and shorter term indicators along with my oscillators and if they are showing oversold readings which correlate with previous lows in stock prices then I will turn bullish regardless of price. I’m not going to say hey the dow failed to get to my lower target so ill fight the new trend.
on the other hand lets say the dow tanks and were now at much lower prices and the indicators are oversold and everyone is stating we are going into the next depression etc….. I still turn bullish because my cycles are pointing to a low and I’m seeing oversold readings .
Long story short the reason a lot of people have been wrong is because they have based their own studies on other peoples work and they have failed to truly understand the work that they claim to be their own . I do not understand
a lot of ganns work so I do not use it . Andre does a great job of explaining what he sees and explains how he goes about it . many times his works comes to the same dates as me yet at times we do not agree on direction. I have seen Andre be dead on accurate enough times on his turn dates that I pay attention to them yet I do not trade based on others work , I trade based on my own work .
A statement was made last week that we should buy Mondays collapse ( this past Monday being 2 days ago ) my comment to that was it made no sense because the market was doing the opposite so I would not expect a big dump id expect a high . How did that guy come up with that idea to buy a big decline on Monday ?
He used the crash of 1987 as his thought process and assumed a down Monday because of what happened 30 years ago . yet that is not what happened 30 years ago . 30 years ago the had been falling and it crashed , this time around the market has been in rally mode ( the exact opposite ) .
If more people would toss out their bias and use something to keep them honest with themselves they would not be blindly taking trades under the assumption
that the market will do x because it always has . the fact of the matter the market does both the exact same thing as well as the exact opposite more times then not .
4 hour dow futures shows 3 waves down . the hourly cash dow can be considered a wave 1 2 set up yet the retrace is a bit weak .
we have seen the dow come into the 23367-23471 range and drop back below it
with todays close at 23329.46
for the week the dow is up less than 1 point .
For me I want to see 5 clean waves down followed by 3 waves back up .
its to soon the claim we have seen any impulse to the down side .
Hopefully you got your question answered .
Research anyone’s work before trading and if you cannot understand what it is
they are doing then use it as a guide only . if they wont teach their methods in their newsletter then do not subscribe . their is no need to pay for multiple subscriptions from any one person . My feelings is if they are selling multiple subscriptions on the same markets then it is more about increasing their own income at your expense vs actually teaching you anything .
That said, if you find someone that you respect and appears to know what he is doing then by all means pay for a year and see what you can learn .
The key point is learn something from them, not just follow along .
Trading is a never ending chess game, as each piece is moved you have several different options to consider. Keep your eye on the board and watch all of the pieces .
As peter has stated many times , he watches several different asset classes and he sees how they all correlate with each other . its not hard to do this but it does take time .
that’s it
Joe thanks so much for that detailed response. It is the most cogent ( and I might say accurate) description of what price has actually done this year. I am still learning how critical it is to do my own due diligence even when I consider what others might think about price action in the market. I learned a hard lesson recently in this regard. I was also thinking that the market was going higher and was sitting on 100 DIA 122 strike call options as I was thinking that the third was was not yet done. Without going into a lot of detail I ended up holding only 30 of those contracts for the last run higher because I did not have the courage of my convictions. One of the reasons I solicited your opinion is that you were one of the very few people calling for a top later in the year, and despite the fact that my own count agreed with you I acted like a WUS and bailed! Thanks again for the very detailed and insightful reply to what I know was not an easy question to tackle. I am confident the other readers on the forum are going to really benefit from what you outlined.
Mike
here is something that may peak your interest
https://www.bing.com/images/search?view=detailV2&ccid=1XEoGA0%2f&id=A7B4CC2353B4F1FFE917EEC7FC6590286B880F3E&thid=OIP.1XEoGA0_-eo_pG8RhXIIsgEsCd&q=james+mars+langham&simid=608043851983818738&selectedIndex=9&ajaxhist=0
Thanks Joe!
I’ll dig into this more tomorrow, but it looks helpful. At a first glance, the Jupiter/Uranus distance traveled from the 2009 bottom to the 2010 top seems to be near 30°, which this chart has as a marker for their timeframes. Will back-test it and see what I come up with.
I spent quite a while working with Langham’s book… I don’t recommend spending time with it.
Verne, I apologize for not getting to you. My main computer completely crashed. I had to go out today after the closing bell to purchase a new one. It is going to take a me 2 days or more getting my old charts, data ect up and going. With out it, I am a fish out of water. Now I know how Peter feels when his computers crashed in the past. A pain in the ass. I will get back to you soon, I hope.
No problem Dave. I am always trying to pick the brains of experienced traders to see whether I can pick up a thing or two! 🙂
I feel for you …
🙂
So kind of you Peter, but you really shouldn’t.
You opined that it was a bit early to be bullish on VIX.
I took the plunge and bought a ton of SVXY 106 puts on Tuesday when it was trading at 107 and sold ’em at 94 Wednesday morning for a quick triple!
Best trade of they year, even better than the VIX calls! 🙂
“I feel for you …” – Peter
“So kind of you Peter, but you really shouldn’t.” – Verne
Peter was obviously replying to Dave regarding his computer issues!
http://tinyurl.com/ydemodur
Then I stand corrected if he was. I misunderstood. My apologies Peter.
Sorry, haven’t been following this … I was expressing empathy for Dave in the fact that I had a slew of computer, monitor, and software issues earlier this year.
OK, I feel compelled to comment on some recent comments. 1st of all, I am impressed not only with the quality of posts on the site, but also the apparent quality of the posters. Very little, if any, bickering and no name calling…a general respect for everyone’s post…it reflects positively on the website and on Peter T as well. He is, after all, the one who has attracted the posters. That having been said, I am assuming we all know there are no “sure things” in market prognostications. We all deal in probabilities and possibilities. I do not agree that no one should attempt market forecasts. They are fun and can prove to be remarkably prescient or remarkably wrong. That doesn’t change the facts that may have been used to make the prediction. Here’s an example. Since 1898, there has been a very major market turn every 17 years. Here are the years for those who are lazy or mathematically challenged 🙂 1898, 1915, 1932, 1949, 1966, 1983, 2000, 2017?? OK, I will concede that 1983 was 5 months off with a very major bottom in August 1982 instead of 1983…but every other year in the series has been a spot on major inflection point in the market. That, to me, strongly suggests 2017 will end up being a very major turn for the market. But now to the point. If 2017 does not turn out to be a major turn, are you going to blame me for a bad call or an incorrect projection? Sorry, but whatever happens from here on in does not change the fact that the pattern I pointed out exists. Will I be wrong if there is no important turn in 2017 or within a few months of 2017? Wrong about what? Do you see the point. If you give me solid reasons for your opinions, whether it be cycles or Elliott Waves, I will listen. If your wave count changes based on market action, so be it. That does not make you wrong. We all deal with probabilities in this crazy game. I hope I don’t sound like I’m preaching because I am not. Keep making the market calls everyone. I enjoy reading them, and let’s all continue to be kind and respectful to our fellow posters… As a sidelight, I have been analyzing cycles in the market since the late 1960s. That’s where I come from…
Makes perfect sense to me Peter G. I have to say I do agree with your points. I guess I get a bit frustrated not that some people make a call that did not turn out to be exactly right, but that so few sometimes are willing to admit it. I was a subscriber to Harry Dents Elite Boom and Bust for many years starting in 2012 and he called for a top that year. He had a megaphone pattern that he insisted showed an absolute top around 17,000.00 which at the time was well over a thousand points away. He called for a top every year since 2012 and it was only in late 2015 that he FINALLY did a mea culpa and admitted that he hat totally underestimated the power of the central banks. We all know calling direction is a matter of probabilities so it is not logical to expect anyone to call direction with 100% certainty. My beef is only with those who think they can, and attempt to persuade others that they have that illusory power. Thanks again.for your perspective/
BTW, I like Dent’s research very much and STILL think he is fairly good at what he does. I just think it took him too long to admit he was on the wrong side of the market for many years.
The point now is that Harry is going to be right at some stage and that period could be closer than we think especially since he has miss read this market since 2012. You could even date that back to 2007. As you say he has been right on the money pre that.
Fair enough. I remained puzzled by why his being wrong previously had done nothing to dampen his cock-sure presentation about when the market will top. Don’t get me wrong. I do think we are close based on my understanding of where we are in the EW count and considering a host of other signals. There is no way I am prepared to tell the person who thinks we have at least another year of the bull run that he/she is wrong, although I disagree with the view.That would be simply arrogance. I thought when Joe voiced the opinion that this market could continue higher into November some time back that there was no way that was going to happen. None of us knows for sure. Only our trading accounts knows if we are right or wrong, bottom line. Speaking of being wrong, a failure to move below 2547.92 tells me my expectation of an intermediate degree fourth wave correction is incorrect, but if price takes out that level, it cannot be a correction of minor degree based on how I see that possible count. Clearly, any move above 2578.29 confirms a top is not in, and that anyone who made that claim, including the folk at EWI, simply were wrong.
NEWS ALERT!!!!! Mahendra has updated his site and now expects a 5% drop in the next week. Big change from the 20% drop originally expected. I hope no-one had become to excited about an imminent crash written in the stars and planets.
He is STILL predicting?! I am curious to know if he has explained his prior mis-calls.
It would be nice to know he might have learned something the rest of us fallible mortals could derive benefit from. I guess I am just saying I don’t trust the man, even when he agrees with me. lol! 🙂
I figured the long lower wick yesterday was short term bullish. Sold DIA 232.50 calls expiring tomorrow for 1.80 after snagging ’em for a buck. See??!!
Even we bears can pull off a bullish trade every now and then! 😉
Nice play Verne ! Good to see that you are not afraid of your own shadow. LOL
I hear ya Dave. One of the things I really hate about what the market has become is how it turned so many of us from investors into day traders.
I disagree with my bearish friends who said buy and hold was dead. While I had so many reasons for being afraid to be fully invested long in this market, we have to admit that those who followed that strategy the last few years have not done too bad. As an options trader, I got totally frustrated getting repeatedly whipsawed and watching winning trades turn into loosers or break-even whenever I tried to hold a position long term or even swing trade the market. I therefore adopted a philosophy of NEVER allowing profits to sit in the market and cashing out winning trades the minute they hit a pre-determined profit target. I know we all have different trading styles but that has worked well for me personally.
Speaking of which, today I am reloading VIX calls as I suggested yesterday the lemmings would probably give another great entry; I was right. Picked up VIX 10.50 calls expiring next week for a measly 1.15 Yipee! 🙂
Yeh he still is. He doesn’t seem to learn from past mistakes because he has full faith is his Astro charts, a bit like Donald Trump has full faith the record markets are all his doing. I don’t base any trading on his calls and he charges the most extortionate fees which I am sure will change soon when most his followers leave him. I can’t imagine how misleading he could be for new traders and personally unless he stops saying crap like “the market will fall 5% between 26th-31st October…the chances of this failing are 0.5%” I hope his website is shut down by the internet police! I mean there is no one who can predict with 99.5% probability. He has made some good calls like in Feb 2016 when he was buying as the world panicked as markets dropped hard but this call would basically suggest his Astro model is broken if it doesn’t play out. Let’s give him till the end of the month before saying much more.
My one batch short, selling at a lost. 2557 es approx 7 point loss I will have to take back the 6 pack of beer to the liquor store. I did manage to keep the merlot. lol Verne, I was wrong. lol
Having a stop is critical trading discipline, but I think you got rolled Dave. When you get past all the jawboning about wave counting etiquette and what kind of wave something is which some folk wrangle about ad nauseam, the only thing that matters is TREND! If the trend has changed from up to down, you should have given yourself a more generous stop as that loss would have been temporary. Just one man’s feeble opinon! 🙂
Dave
……could you ………”recover”……. from me – walking up to you, grabbing your …..”merlot”……………… opening said merlot………….. and chug “a” lugging that merlot leaving only a few “raindrops” of merlot remaining within the bottle?
[speaking parenthetically, i am “assuming” it is a “bottle” of merlot and not a “box” of merlot]…………
could you recover dave……………………… HUH………..” could you?”
[next phase of the unravel is upon us all at the galatic crossing……….]
the cosmic fingerprints are smudging the entire surface of our cosmic lenses……………………..
………and what remains is our absolute ability to “listen”
https://invst.ly/5l57w
No problem Luri, a bottle of Merlot usually takes me a few days to drink. I am not much of a drinker. Drinking one glass of wine is the equivalent of some one who had 6 glasses of wine. So if you are ever in Vancouver, I am sure I would have a few drops left in the bottle. LOL
I still maintain, we will see lower lows into the Nov 7th gann date.If not before. I have been very vocal with my opinion for the last two weeks. Last Sunday, I mentioned I was going long for the week while the prevailing view was some what bearish. I also mentioned that the markets would top out Tuesday oct 24th , than the down trend would begin. I will be sliding in the shorts again shortly for lower lows. My model says a fake out to the down side for a week than a melt up in the markets for several weeks. PLEASE NOTE. This is only a opinion, an observation, with my model. This is NOT a prediction !
Please note Newbies, I am a 300lb old long haired hippie man I only started trading the markets a year ago. I have no idea why I trade. Looking back on my trades, I usually get one trade correct out of every 10 trades I make. I have lost over one million dollars this year a lone. If in Doubt, I flip a coin. Heads, the market is going down. Tails, the market is going up. I also follow all the so called financial gurus, Mahendra, Prector Dent ect.
Bottom line, Do not follow me. All the best
Potus will be in South Korea on Nov. 7. Maybe something happens?
Also, I’m encircling Nov. 1st on my calendar because..cough..cough…
it’s a 11-1-9 day so there may be a lot of 911 calls. It’s okay, I cannot see you guys rolling your eyes.
Maybe this will help: https://rainbowmonkey9.deviantart.com/art/Rolling-eyes-animation-35321381
🙂
DAVE……….
…………………..”i am YOU”…………..”as YOU are me”………”as WE are we”…….. “as WE are all together”……………………………….
……………………see how they RUN………..like pigs from a gun………see how they fly………………………….. i am FLYIN”…………………. [song: i am the walrus – beatles 1967]
goo goo goo joob!
Thanks LizH, I appreciate all the possibilities you bring forth. As I am a fan of numerology. I may have to flip a coin on that Nov 1st day. LOL
Very cute Peter! Luri and Dave 🙂
Oh MA GAWD liz…………. “L-I-Zzzzzzzzzz………………….mine eyes are firmly glued in mine sockets…………… although i do “roll” my ……”R’s”………..on occasion……..
111 can “ONLY” be heard BY those with ears to hear 111……………..
10/28/2017 is the next true 111 day
Pretend it’s yesterday. Do you think it’s possible for a blue chip stock to crash back to near its 8/24/15 low price in this bullish 2017 market? Live example right now. Celgene almost near the crash low of 92.98.
liz…….
risk parity funds.
cta’s.
vix leveraged short to the extreme…………….
YES!……….absolutely…………………air pockets, and much worse………….
…….also liz, in a “margin call” event potential – they will sell holdings that are most liquid FIRST [think DOW STOCKS] to meet the call………
Did anybody listen to the Dent interview ? Did he mention the date of Pancholis turn date ? I am not being lazy, just trying to get my new computer up and going with down loads. Thank you
I dug through some old notes of RN Elliott .
I saved the file and just printed a few things .
I’m not sure when this was written but it is from a long time ago .
According to Elliot ( not Prechter )
From 1857 to 1928 ( not 1929 ) Grand Super cycle wave 1
so I took that in for a moment as I read that and I pondered
WTF ?
1932 low and 1857 Low = 75 Years Low to Low
adding 75 Years to 1932 you get the year 2007 <—
Bottom of wave 1 to bottom of wave 2 to Top ( you label that how ever)
it was a 75 yr bottom to bottom to top count .
RN Elliott said he labeled the top on Nov 28 1928 as the orthodox top
and his reasons is that the move into the high in 1929 was only 3 waves.
To me this is significant .
George Lindsay has written about his 3 peaks domed house pattern
and I do not have my notes in front of me to quote him yet I have always
felt that 3 peaks domed house pattern is a 3 wave move pattern .
Many years ago Robert precther compared the 3 peaks domed house pattern
to an Elliott wave count and I shook my head in disagreement .
why do I bring this up ????? From 1997 to 2009 the dow went through
a very clean 3 peaks domed house pattern in almost perfect textbook form.
This implies to me that the 2007 top was a B wave high and it also puts in question the year 2000 top. ( I'm not going to argue the fact that the top in 2000 was important , it definitely was )
What this tells me though is that despite the rally from 1997 to the year 2000
the Dow orthodox top might be better placed in Feb 1997.
From the lows in April 1997 the highs in Jan 2000 I do not see a clean
5 waves ,
As for the 3 peaks domes house pattern , This is my own Plot
and I had followed it in real-time to the Top in 2007 .
The wave counts at this juncture ( top in 1997 vs 2000 ) Are not cast in stone.
RN Elliott did accept the Irregular top as part of his original works from what
I'm seeing.
https://imgur.com/cZtkCVV
Triangles
Just thought id mention RN Elliot also noted the Triangle wave 2
yet Prechter says the triangle is the last move preceding the top .
Something to that effect . Basically you measure the widest points of
the triangle and the project that distance from Point E and it becomes
the measured objective .
Here is a sample showing Lam research , Symbol LRCX
This is one of the stocks I sold and ill ask the question
was it a great trade or not ????
Normally I don’t follow stocks once I sell them yet I came across this today
and so here it is
I got long following the Point E low and I exited near the measured objective .
The other question is this , what do you do if the measured move
gets broken ??? what if the stock fails to break down after that triangle thrust ?
https://imgur.com/cYoJ0vy
Last chart
Before posting I’m right there with hippie Dave yet plus a few more pounds.
Diod is another example of a multi year Triangle thrust in process .
I don’t sell every stock blindly and this one ill hold .
the question though ill ask is this .
What if the measured objective gets taken out to the upside ????
https://imgur.com/U6d58O1
Verne and Joe, and all other viewing ‘eyeballs’…………
a little “what if” potentiality here………..[ for those of us that think the cycle potential for October 2017 as a market top/and a change in trend is very great]…………………………………
i had a small 5 count [a/b/c] megaphone topping pattern in the ES to a potential top……….. “WHAT IF” the first move off the top is its logical and very necessary ancillary – a leading expanding diagonal????………………………….. hmmmm…..what if??
comments? observations?………. classic victorian cucumber sandwiches?
https://invst.ly/5linx
This website is for educational purposes relating to Elliott Wave, natural cycles, and the Quantum Revolution (Great Awakening). I welcome questions or comments about any of these subjects. Due to a heavy schedule, I may not have the time to answer questions that relate to my area of expertise.
I reserve the right to remove any comment that is deemed negative, is unhelpful, or off-topic. Such comments may be removed.
Want to comment? You need to be logged in to comment. You can register here.