

Pundits — A Good Laugh!
I found myself chuckling this past week as there were so many predictions of a turn down in conjunction with the Fed announcement this past Wednesday, which didn’t have a chance in Hell of happening: Events don’t affect the market in a lasting technical manner.
We were still expecting a new high (the previous wave down was in three waves, so it had to completely retrace). But, some people never give up holding on to inherent biases that are mostly a result of propaganda.
It’s akin to the problem that economists have. We still think they’re gods when it comes to predicting the economy. However, they’re ALWAYS wrong. That’s because they’ve never been taught about cycles. They seem to think that things move in a straight line.
However, there are no natural straight lines in nature. NONE. The Universe is an electrical entity influenced by spinning globes and electromagnetic waves (in the form of sine waves). There is no straight line anywhere to be found … anywhere in the Universe.
On top of that fact, is this (apparently) little known phenomenon: The market moves in pre-determined patterns and these patterns always play out to their predictable ends.
But … pundits have to make a living! They’ve certainly created a platform for themselves by constantly drilling in the lie that somehow every word of any politician affects the ups and downs of the market. Never going to happen.
There are lots of lots of laughable predictions this weekend about the future of tech, the market, the economy, hyperinflation, and the future in general … none of which make a whole lot of sense if you understand the past, cycles, or how the international banking system works (or doesn’t … haha … as the case may be).
Take it from Lee Iacocca, who was the guy who turned Chrysler around in the 1980s by creating the minivan …
But, back to the pundits …
This weekend, the press is promoting gold as being in a bull market. Not a chance. That’s your first indicator that it’s going to implode — as soon as the pundits hit the airwaves and all agree on the direction. You don’t need Elliott wave or anything else to figure that one out!
The fact is that … This weekend, with the solstice, EVERYTHING is set up for a MAJOR turn. I’d expect to see that turn in the first part of the coming week.
It’s been a lucrative time for the Trader’s Gold folks, with wave structure clearer than it has been for a long time. After all, as I’ve been predicting for over three long years, we finally have virtually all asset classes moving in tandem … and that extends to major international indices, like TSE and DAX.
Fourth waves are the worst of all the patterns. In the NYSE, we’ve been in the largest one I’ve ever seen since the end of January, 2018 – a year and a half!
Generally, I recommend NOT trading them because they’re so unpredictable. This one has been that, and more.
But this fourth wave was SO LARGE, that you pretty much have to trade it — after all, we’ve been in it for so long …
We’ve had the largest non-confirmation I’ve ever seen, with SPX, the DOW, and Russell 3000 rising into that rare boarding top pattern I outlined a few weeks ago, while the NYSE has roamed about as a clear fourth wave. This means that, while the mother exchange (NYSE) shows a fourth wave, these sub-indices are actually at the top of a third wave. That’s the largest non-confirmation I’ve even seen, something that only happens near market tops.
The immense size of the first wave confirms that the waves up in the NYSE are corrective, and have been since 2009. We have a B wave in progress, as I’ve been saying for years. There is no other possible explanation for the current wave structure.
The US indices will all get back in sync with this next move to a new low. The NYSE will complete a C wave down of the fourth wave, while the sub-indices will start and finish their fourth wave as the C wave of a regular flat (most likely).
You don’t want to miss the coming turn and the NYSE group is apparently going to make it a little easier for us. I see an ending diagonal that’s about to trace out the final wave up this weekend.
The wave down will bring to an end the ugly fourth wave we’ve been in, what I’ve been dubbing, “The Fourth Wave from Hell.” At the bottom around the September timeframe, I’ll do a summary of the entire experience, likely entitled, “I told you so … ”
It’s going to be a summer to remember.
___________________________
Elliott Wave Basics
Here is a page dedicated to a relatively basic description of the Elliott Wave Principle. You’ll also find a link to the book by Bob Prechter and A. J. Frost.
____________________________
Registration for Commenting
Want to comment? You need to be logged in to comment. You can register here.
If you register, it protects your information. It also allows you to comment without filling in your information each time. Once you’re registered, simply go to the home page and click on the login link top right in order to log yourself in. Usually, you’ll be logged in for several days before needing to be logged in again.
______________________________
Problem receiving blog comment emails? Try whitelisting the address. More info.
______________________________
Have not had a losing week RW 2
Have not had a losing week …I have been with Peter almost a year. The only thing that matters is have I made money with his service. I think I have finally turned the corner using Peter’s EW. I have not had a losing week in the last 5 months. Thanks Peter, for your amazing amount of hard work. —RW |
Tops in your field DZ 2
Tops in your field …You are tops in your field. Tried to follow Elliot Wave international for years. They were always behind the market. After discovering you, I perceive that you are an expert in reading the waves, which puts you way ahead of the rest of your peers. And you can read the Waves like you are reading tomorrow’s financial section. I pray you stay healthy. —DZ |
A true expert in Elliott Wave FL 2
A true expert in Elliott Wave …You are a true expert in EW analysis. What you provide is not available anywhere and is priceless. Subscription on your services is the best thing I have ever done. Many thanks for your effort to make me a better investor. I now have more trust in my investment decisions. I hope you will continue the excellent work! —FL |
Couldn’t be happier … KK 2
Couldn’t be happier …The analysis and insight you provide is simply amazing! I’ve been trading the futures and equity markets for well over thirty years and usually average around 5% monthly. Since joining your Traders Gold Service two months ago, that number has better than doubled. I couldn’t be happier.—KK |
Rise above the rest … SM 2
Rise above the rest …I have only ever met a few people who, in their chosen fields (astrology, medicine, music, martial arts, technical analysis), rise above all the rest and you are one of them…you have ‘the gift’…and that’s why I’m a Trader’s Gold member. —SM |
the real deal SM 2
The real deal …‘Educational, insightful and thorough market analysis for all levels of traders. It’s Elliott Wave at its best….Peter Temple is the real deal’ —SM |
Get an upper hand … JC 2
Get an upper hand in trading …Seeing all the different currency pairs and the wave structures and hearing you explain why this has to do that on a nightly bases gives one a upper hand when trading. Elliott Wave applies to all stock and indices and can be applied to any candlestick chart. If someone ask what you want for Christmas – Tell them a membership to Peter’s “Traders Gold!”—JC |
The best of them JL 2
The best of them …Last couple of years, I subscribed to several ‘market traders’. You are by far the best of them and the personal contact is awesome. Daily and daily updates are very well written! Besides your expertise in EW, I also like your cycles analysis. Best investment I ever made! —JL |
US Market Snapshot (based on end-of-week wave structure)
This chart is posted to provide a prediction of future market direction. DO NOT trade based upon the information presented here (certainly NOT from a daily chart).
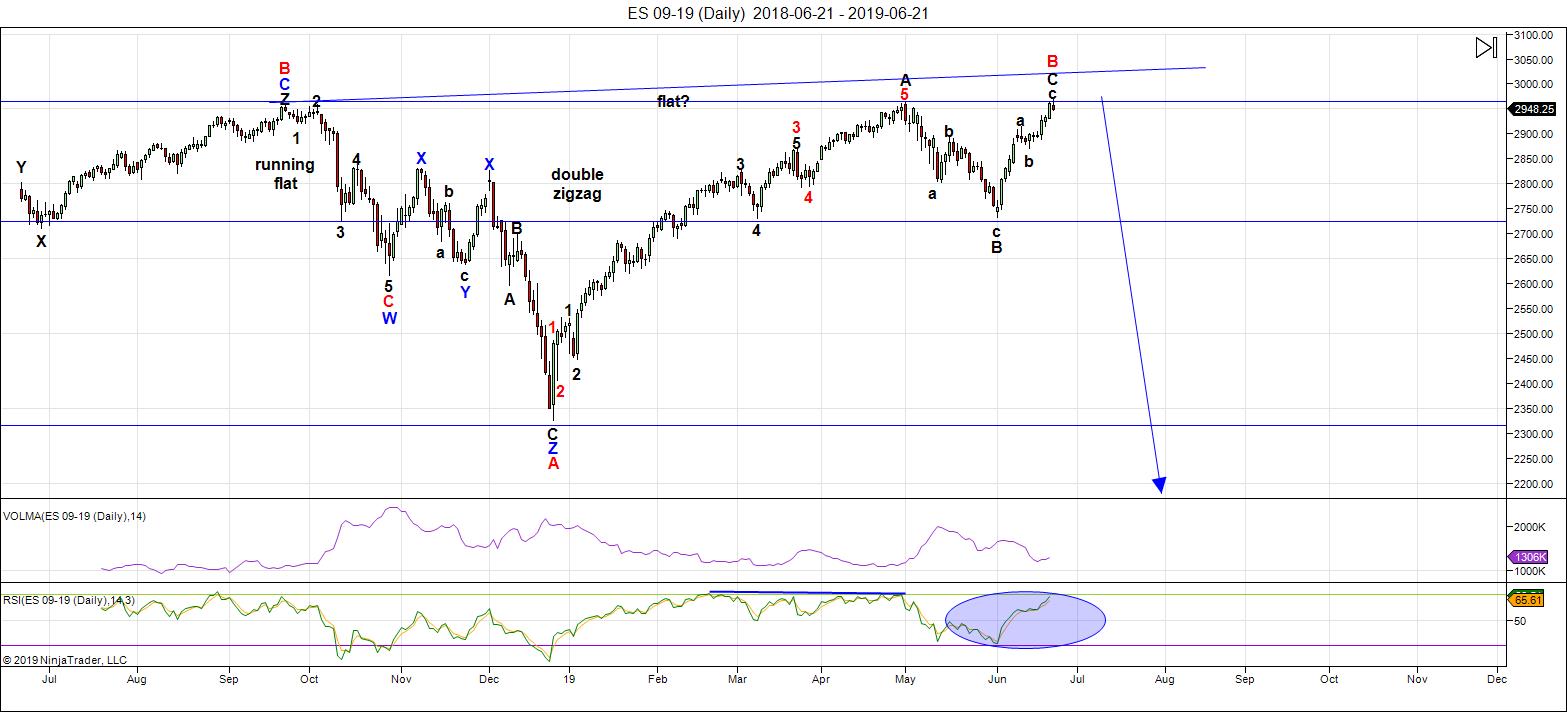
Above is the daily chart of ES (click to enlarge, as with any of my charts).
All the assets I cover have continued to perform as predicted. Across the board, they're now sitting at the targets I've been predicting for weeks now (gold, silver, oil, USD, USD currency pairs, US indices). All these asset classes are now moving as one (as I've been saying for the past three years that they eventually would do). This turn will affect all of them.
Trader's Gold subscribers have done well over the past few weeks, with setups across the board. The opportunities are increasing, as virtually everything is aligned.
The broadening top we're completing is not an Elliott wave pattern; they're so rare, that experience in trading them is minimal. The sub-waves up in emini futures (on hourly charts) have been the most difficult waves to predict due to the fact that they don't display the usual expected ending-wave pattern. In ES, they're clearly corrective (zigzags), while those in NQ appear to have traced out a motive set of waves. NQ is still searching for a new high.
ES has traced out an ending diagonal. Expect a turn earlier in the week than later. It appears the equinox of this weekend (with all the energy it unleashes) is having the final word.
The opportunities setting up this weekend extend to international exchanges like TSX and DAX. The coming drop will be a world-wide phenomenon across all most all sectors. It will last throughout the summer months and most likely culminate in a low and final round of QE.
As I've said since the low on Dec. 26, the waves up are corrective in the NYSE-related indices, and as a result, will completely retrace. Expect an imminent top and a major move to a new low under 2100.
Summary: Expect an imminent top to complete this large, corrective "B wave" up from the Dec. 26 low. The overall pattern is a record-breaking broadening top (not an EW pattern).
I'm looking for a dramatic drop in a 4th wave to a new low. ES will eventually target the previous fourth wave area somewhere under 2100.
Once we've completed the fourth wave down, we'll have a long climb to a final new high in a fifth wave of this 500 year cycle top.
___________________________
Trader's Gold Subscribers get a comprehensive view of the market, including hourly (and even smaller timeframes, when appropriate) on a daily basis. They also receive updates through the comments area. I provide only the daily timeframe for the free blog, as a "snapshot" of where the market currently trades and the next move on a weekly basis.
I do a nightly video on the US indices, USD Index (and related currency pairs), gold, silver, and oil).
______________________________________
Sign up for: The Chart Show
Next Date: Wednesday, June 26 at 5:00 pm EST (US market time)

The Chart Show is a one hour webinar in which Peter Temple provides the Elliott Wave analysis in real time for the US market, gold, silver, oil, major USD currency pairs, and more. You won't find a more accurate or comprehensive market prediction anywhere for this price.
Get caught up on the market from an Elliott Wave perspective. There’ll be a Q&A session during and at the end of the webinar and the possibility (depending on time) of taking requests.
For more information and to sign up, click here.
| "I think you are the only Elliot Wave technician on the planet who knows what he's doing.” |
| m.d. (professional trader) |
All registrants will receive the video playback of the webinar, so even if you miss it, you’ll be sent the full video replay within about an hour of its conclusion.


Wave three NOT shorter than wave one so no cigar on potential ED. Rats! 😬
Verne, there is a cure for that but it’s not cigars!! 🙂 This market is listless right now so it is hard to position. It is more OS than OB by my indicators, with indices running into resistance and VIX coming down into support. Whether they bounce or get hung up in the zones is the question I am watching for. Data driven drzzle.
Sorry, VOL more oversold, markets more overbought. Whether they can push through the MACD mud and continue wave or pull back will be something to watch.
I figured that is what you meant my man.
The put call ratio supports that viewpoint.
They are trying mightily to negate May’s bullish candle on this last trading day of the month but at best it seems we will have some kind of stale-mate, unless we see some fireworks into the close in one direction or another.
Stentorian snores coming from Mr Market so far as I can tell…..somebody wake him up will ya? 🙂
Guys, may have a “silly” question, but not very familiar with derivatives. I tried only once and lost all! 🙁
My question:
– in case we are witnessing a huge markets’ drop, which could definitely occur, how are you sure that the banks selling those derivatives wont be bankrupt and you loose everything?
Thanks for your views….
Serge
IMHO, when you looks the banks’ derivatives exposure as compared to their capital ratio, the are ALREADY bankrupt….
Yes, like Deutsche Bank with dozen trillions €uros in derivatives!
But if you buy a put at DB, what will happen when the indices drop 30%?
Not sure stop loss will work…. 😉
DB To Launch €50 Billion “Bad Bank” Housing Billions In Toxic Derivatives
https://www.zerohedge.com/news/2019-06-16/deutsche-bank-launch-eu50-billion-bad-bank-housing-billions-toxic-derivatives
IMF’s chart showing the key linkages of the world’s riskiest bank:
https://www.zerohedge.com/sites/default/files/images/user5/imageroot/2016/06/27/DB%20IMF%201.jpg
It’s risk management!
Why would you care about a stop-loss on a put with the indices going down 30%?
Am I missing something? Did you mean to say going UP 30%
Sorry Verne, what I meant is that if the bank is bankrupt, no way to make a “stop loss” and you loose all. It did happend to a friend loosing millions in derivatives.
These triangle patterns in the indices are interminable!
What the…!!!??? 🙂
@Peter Temple,
Would you kindly consider providing a wave count for the various FANGS at this stage? Are there any that are ready for 3rd wave down or are they all following the market?
A seven wave “chaos clamshell,” eh? Goofy. Are you sure this guy isn’t coming from a craps game in the backroom of a fishery? lol.
I like clams…I like ’em crispy!! 🙂
Perhaps you should investigate his work before being so snarky. It is excellent..
Well this stuff I’m seeing is dead wrong; it makes no sense from an EW perspective (or what’s happening across every known asset class — certainly the ones I cover) and if somebody’s going to post alternative counts to mine, it’s fair game, if I even allow it … while this free blog remains alive …
Folks just seem to want to keep pushing me … I push back!
Another black mark for the free blog comments idea. We’re about on the ninth life.
I’m not intending to make or call this market wave wise on here
Cash Dow – Failed to make a higher close than last weeks close
Cash Spx- Failed to make a Higher close than last weeks close
Cash Ndx- – Failed to make a Higher close than last weeks close
Cash Nya – successfully made a higher close than last weeks close
Cash Tran- successfully made a higher close than last weeks close
5 Day trin has generated a Sell signal
10 day trin is in ano overbought condition yet has Not generated a sell signal.
The 5 day trin sum readings are sitting at : 1.10+1.42+.97+1.11+.74 = 5.34
Traditionally you look for a reading of 4.00 yet readings below 4.5 are more typical of a very short term overbought reading .
it will take a minimum of 2 trading days to create a reading of 4.00
the 1.10 and 1.42 readings will fall off . .97+1.11+.74 = 2.82 hence is Monday and Tuesdays readings are below 1.00 and ill guess .80 each as example
then on Tuesday the 5 day trin sum would = 4.42
not saying that is going to happen just saying a 5 day trin sum reading below 4.50 is a typical very short term overbought reading .
Since the 10 trin has yet to give a sell signal I would expect that sell signal to be generated at some point later next week .
I still feel a high should be seen in early July ( July 2-7th )
5 day and 10 day advance decline line: Neutral reading and pointing upwards
5 day and 10 day Issue : Pointing higher yet not far from its typical upper range
5 day and 10 day Upvol minus down vol …..pointing higher yet sitting at its mid point between its typical upper and lower range .
Hourly Tick : Neutral readings
Heavy weights with in the dow : Down the past 6 trading days ( today a slight up close from yesterday )
lesser weights with in the dow : Down the past 5 trade days with a slight up close from yesterday .
SPX / VIX Weekly : successfully made a higher close than last weeks close
The Spx / Vix goes higher with the mkt rising and goes lower with the mkt falling .
This weekly chart peaked the week of jan 1 2018 ( last year ) at a reading of 304.83
and since this high it has made 5 swings in a narrowing range .
these swings are noted in price and date below :
week of dates :
Jan 1 2018 print high 304.83
Feb 5 2018 Print low 53.70 ( not a typo )
Aug 6 2018 Print high 280.43
Dec 24 2018 Print low 65.18
April 15 2019 <– Print high 262.51
May 6 2019 – Print low 123.01
The widest point of this range in swings is from the week of jan 1 2018
to the week of feb 5 2018 .
this range 304.83 – 53.70 = 251.13 pts
The 5th swing of this narrowing range was at a level of 123.01 which was printed in the week of may 6th 2019 ( The low printed in the week of june 3 was a higher low )
adding 251.13 points to the 123.01 close of the week of may 6th targets a level
of 374.14 ( this would be a new all time high extreme reading )
This high reading would ideally be seen in the week of Aug 28 2019 or
the week of Nov 4 2019 . ( call it the time range of Aug 28 to Nov 4 2019 as a guide )
If this extreme reading is seen at any time it would be wise to exit bullish positions .
Summary : The Major Stock Market Averages are in the final stages of a topping process that still shows several reasons to wait a bit longer before taking on any aggressive bearish positions . because of these reasons I remain bullish yet I do think it will be wise to begin selling portions of individual stock holdings as the markets rise . ( sell on strength ) in doing this you may see some stocks continue to rise yet at the end of the day this bull run is closer to its end point so preservation of capital is going to be key .
IMHO, this market is about to separate the EW thoretician men from the boys, no disrespect intended to the ladies on the forum. It has been quite a challenge for even competent analysts to correctly call the short-term ditection of this dicey market. Most counts I am seeing, in keeping with prevailing bullish sentiment, call for a fairly shallow second wave correction in an unfolding impulse. Two of the best at their craft, imho, including, of course our very own host, are predicting a substantial decline to complete a major degree fourth wave that will take SPX down to the 2100 region.
This is a very big deal, and I for one am looking forward to learning more about their approach to EWT from the guys that got it right. My own indicators are pointing to something big on the horizon, so you can well imagime whom I am paying close attention to!
Have a great week-end everyone!
Thanks Joe,
My astro dates are, June 24, July 4 ,July 7 and 10.
If I’m correct we will see a low on July 4 up into July 7 ( Mercury retograde) after that down into July 10.
Have a nice weekend all
A new weekend post is live: https://worldcyclesinstitute.com/a-swift-kick-to-the-dollar/
This website is for educational purposes relating to Elliott Wave, natural cycles, and the Quantum Revolution (Great Awakening). I welcome questions or comments about any of these subjects. Due to a heavy schedule, I may not have the time to answer questions that relate to my area of expertise.
I reserve the right to remove any comment that is deemed negative, is unhelpful, or off-topic. Such comments may be removed.
Want to comment? You need to be logged in to comment. You can register here.