

A Major High Dead Ahead
There’s a lot of unpredictability built into the market overall at the moment. We’re close to a major top, so you have to expect some volatility and a lot of uncertainty. It’s a dangerous market.
While this weekend’s prognosis across the various asset classes seems fairly obvious, it also signals the need for some caution. It’s often better to get in a bit late once we see the move, and to keep stops relatively tight.
The current pattern in the US indices is a broadening top and from the book I cite below (Murphy), here’s the quote that worth paying attention to: This is an unusually difficult pattern to trade and fortunately is relatively rare.
However, it will lead to a major high and a short that will last for weeks, if not months, and probably take us into the early fall. At the bottom of the pattern (somewhere under 2100 in the SP500), I would expect lots of fear and a final dose of QE, which will be enough to get us back up to a new high, but not much more.
It’s all slowly playing out as predicted.
_______________________________
Broadening Tops
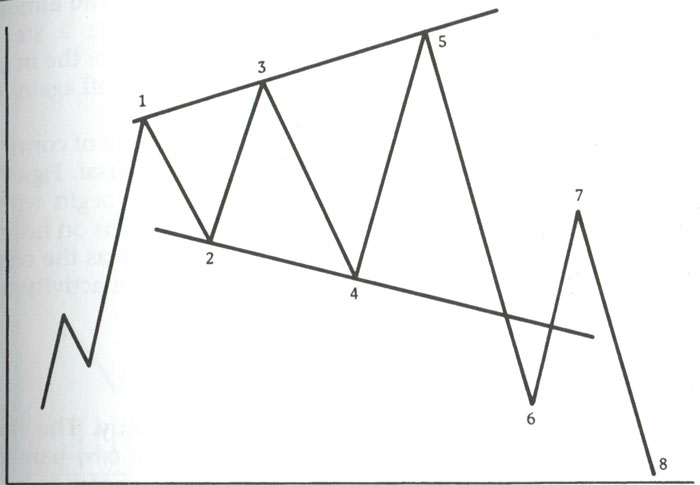
As mentioned last weekend, broadening tops are not Elliott Wave patterns, so require a bit of additional research to stay on top of them. They’re extremely difficult to trade and we’re seeing that in the current subwaves (not reasonable retrace of the B wave … so far).
In any event, here’s a bit more information from one of my favourite resource books on trading …
From Technical Analysis of the Financial Markets — John J. Murphy:
 In other triangle patterns, volume tends to diminish as the price swings grow narrower. Just the opposite happens in the broadening formation. The volume tends to expand along with the wider price swings. This situation represents a market that is out of control and unusually emotional. Because this pattern also represents an unusual amount of public participation, it most often occurs at major market tops. The expanding pattern, therefore, is usually a bearish formation. It generally appears near the end of a major bull market.
__________________________________
NYSE Update
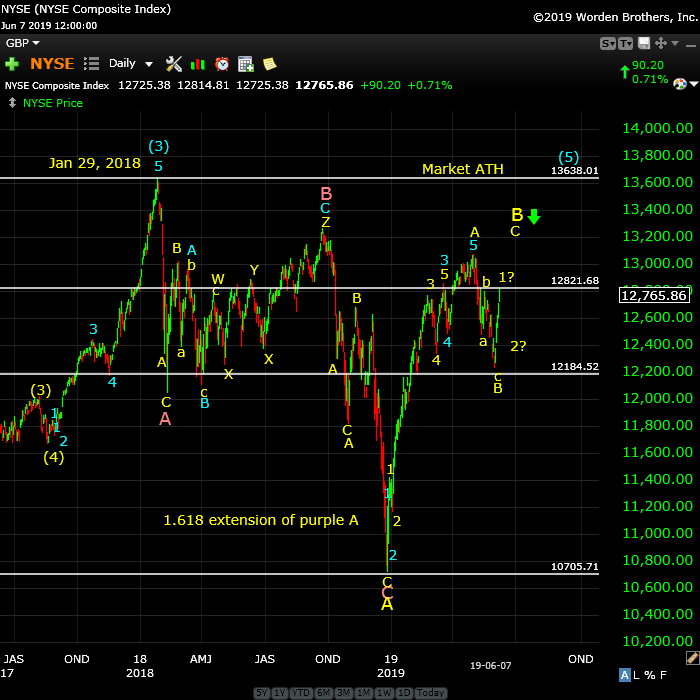
Above is the daily chart of the NYSE showing the large ABC fourth wave that we’ve been in since the top of blue circle 3 on January 29, 2018.
The most recent wave up from Dec. 26, 2019 is corrective but I’ve numbered it in five waves (they don’t follow the impulsive wave rules, so they’re corrective). I’ve re-labelled the first portion of this A wave up as a 1-2,1-2 pattern, resulting in a 3-4, 3-4 pattern at the top of the yellow A wave (slightly above 13,200).
This weekend, we have a triangle forming as a small B wave in a projected move up to a new high above 12,821.68. A top will result in a very deep wave down to a new low below 10,700.
Possible timing: I’m now expecting a high somewhere in June now (the market is moving quickly now), with perhaps our big drop beginning then and lasting through early September (my dates here are speculative).
As I often say,
“Trade what you see, not what you think.”
___________________________
Elliott Wave Basics
Here is a page dedicated to a relatively basic description of the Elliott Wave Principle. You’ll also find a link to the book by Bob Prechter and A. J. Frost.
____________________________
Registration for Commenting
Want to comment? You need to be logged in to comment. You can register here.
If you register, it protects your information. It also allows you to comment without filling in your information each time. Once you’re registered, simply go to the home page and click on the login link top right in order to log yourself in. Usually, you’ll be logged in for several days before needing to be logged in again.
______________________________
Problem receiving blog comment emails? Try whitelisting the address. More info.
______________________________
Rise above the rest … SM 2
Rise above the rest …I have only ever met a few people who, in their chosen fields (astrology, medicine, music, martial arts, technical analysis), rise above all the rest and you are one of them…you have ‘the gift’…and that’s why I’m a Trader’s Gold member. —SM |
Get an upper hand … JC 2
Get an upper hand in trading …Seeing all the different currency pairs and the wave structures and hearing you explain why this has to do that on a nightly bases gives one a upper hand when trading. Elliott Wave applies to all stock and indices and can be applied to any candlestick chart. If someone ask what you want for Christmas – Tell them a membership to Peter’s “Traders Gold!”—JC |
A true expert in Elliott Wave FL 2
A true expert in Elliott Wave …You are a true expert in EW analysis. What you provide is not available anywhere and is priceless. Subscription on your services is the best thing I have ever done. Many thanks for your effort to make me a better investor. I now have more trust in my investment decisions. I hope you will continue the excellent work! —FL |
Have not had a losing week RW 2
Have not had a losing week …I have been with Peter almost a year. The only thing that matters is have I made money with his service. I think I have finally turned the corner using Peter’s EW. I have not had a losing week in the last 5 months. Thanks Peter, for your amazing amount of hard work. —RW |
the real deal SM 2
The real deal …‘Educational, insightful and thorough market analysis for all levels of traders. It’s Elliott Wave at its best….Peter Temple is the real deal’ —SM |
Tops in your field DZ 2
Tops in your field …You are tops in your field. Tried to follow Elliot Wave international for years. They were always behind the market. After discovering you, I perceive that you are an expert in reading the waves, which puts you way ahead of the rest of your peers. And you can read the Waves like you are reading tomorrow’s financial section. I pray you stay healthy. —DZ |
Couldn’t be happier … KK 2
Couldn’t be happier …The analysis and insight you provide is simply amazing! I’ve been trading the futures and equity markets for well over thirty years and usually average around 5% monthly. Since joining your Traders Gold Service two months ago, that number has better than doubled. I couldn’t be happier.—KK |
The best of them JL 2
The best of them …Last couple of years, I subscribed to several ‘market traders’. You are by far the best of them and the personal contact is awesome. Daily and daily updates are very well written! Besides your expertise in EW, I also like your cycles analysis. Best investment I ever made! —JL |
US Market Snapshot (based on end-of-week wave structure)
This chart is posted to provide a prediction of future market direction. DO NOT trade based upon the information presented here (certainly NOT from a daily chart).
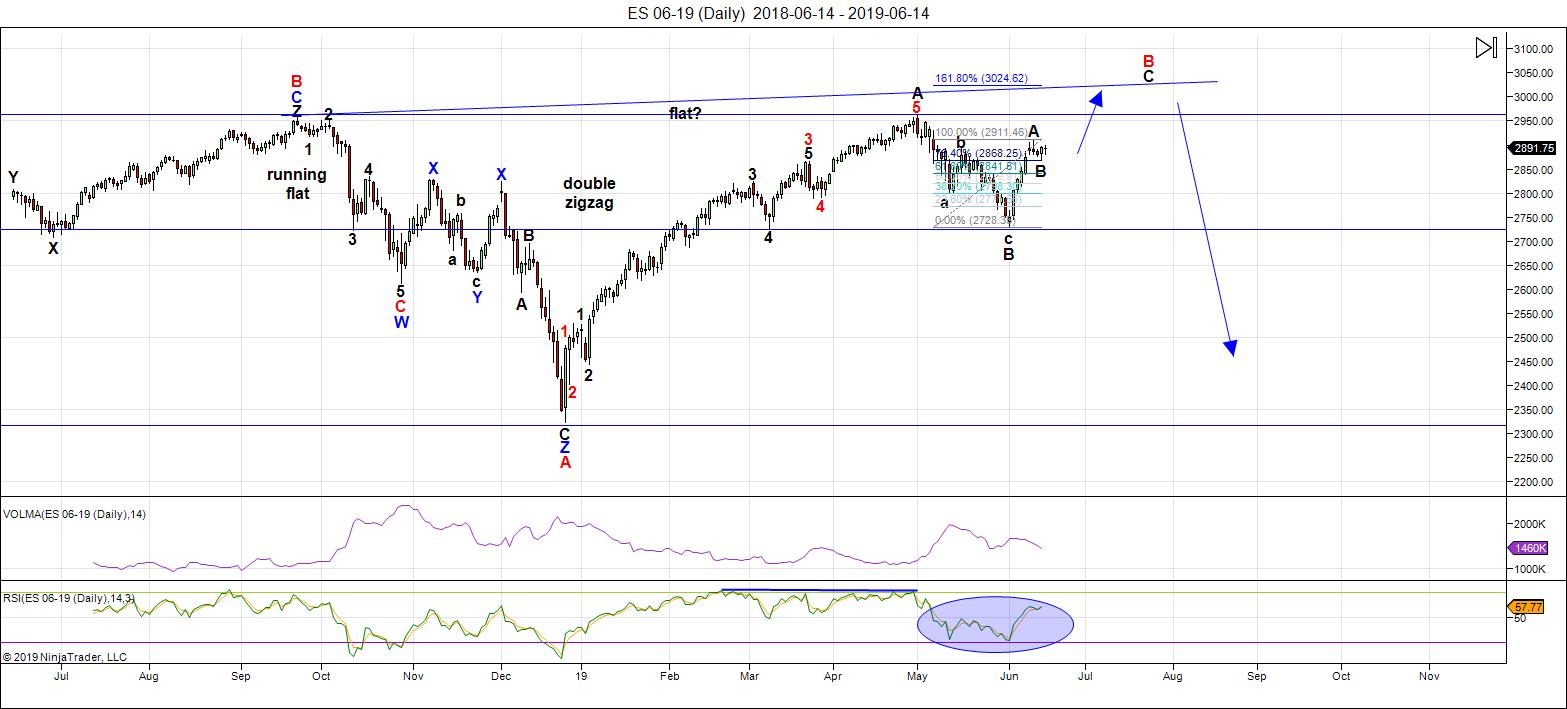
Above is the daily chart of ES (click to enlarge, as with any of my charts).
After last week's predicted turn up from the 38% retrace level, we've plateaued in a shallow retrace, which appears to be tracing out a contracting triangle. There's still a chance we could see a deeper retrace to the downside, but with currency pairs (and the US Dollar Index) very near inflection points, the likelihood now is that the triangle will act as the launching pad for the final C wave up to a new all-time high.
After we reach the final high, we'll see a turn to the downside with a major move to a new low under 2100.
It's impossible to successfully analyze this market without taking into account the movement of a number of related asset classes. The market has gradually been aligning across these asset classes and now virtually everything is moving more or less in "lock-step." When you trace out a major top, all major indices have to top at the same time. This 500 year topping process will include many international exchanges.
Summary: Expect this extreme rally to continue to a new high to complete this large, corrective "B wave" up from the Dec. 26 low. The pattern is a record-breaking broadening top.
Once we reach the high, I'm looking for a dramatic drop in a 4th wave to a new low. ES will eventually target the previous fourth wave area somewhere under 2100.
Once we've completed the fourth wave down, we'll have a long climb to a final new high in a fifth wave of this 500 year cycle top.
___________________________
Trader's Gold Subscribers get a comprehensive view of the market, including hourly (and even smaller timeframes, when appropriate) on a daily basis. They also receive updates through the comments area. I provide only the daily timeframe for the free blog, as a "snapshot" of where the market currently trades and the next move on a weekly basis.
______________________________________
Sign up for: The Chart Show
Next Date: CANCELLED for June 19 (US market time)

The Chart Show is a one hour webinar in which Peter Temple provides the Elliott Wave analysis in real time for the US market, gold, silver, oil, major USD currency pairs, and more. You won't find a more accurate or comprehensive market prediction anywhere for this price.
Get caught up on the market from an Elliott Wave perspective. There’ll be a Q&A session during and at the end of the webinar and the possibility (depending on time) of taking requests.
For more information and to sign up, click here.
| "I think you are the only Elliot Wave technician on the planet who knows what he's doing.” |
| m.d. (professional trader) |
All registrants will receive the video playback of the webinar, so even if you miss it, you’ll be sent the full video replay within about an hour of its conclusion.


Head line :
https://www.msn.com/en-us/money/markets/stocks-close-higher-after-fed-hints-at-possible-rate-hike/ar-AACZkVf?ocid=spartandhp
Stocks close higher after Fed hints at possible rate hike.
Odd Closing numbers
SPY up .66 and closes at 293.06
SPX up 8.71 and closes at 2926.46
Dow up only 38.46 closes at 26504.00
Nothing seems to be in sync to me .
spx would have been closer to up 3.8 to match the dow
or the dow would have needed to close up closer to 87 pts to match the spx
and spy vs spx also don’t appear correct ( they have to be though because the mkt closed at those numbers )
these differences will need to work themselves out in the coming days is all im getting at .
short term thoughts on the market other than above I have nothing to say .
silver to gold ratio
or the gold to silver ratio
it should be looked up and thought about .
Well our market is blowing off here in Oz, and S&P500 looks like it wants to print a new all-time high very much sooner rather than later. Per previous comments, the S&P is following a variation of the eclipse cycle and we are 6 weeks from the previous high which is the usual timeframe for the topping process . The current window has a few more days to run so it will be interesting to see if we in fact turn down in a serious way – that is a retest of the December low before a blowoff rally gets underway. Bond/eurodollar/money markets are giving everyone a serious hint that there is something seriously bad in the pipeline. Let’s hope the Fed with all of its backward looking indicators pays more attention thsi tie around, than when they dismissed it out of hand back in 2007.
Dan
Do you have any references I can look up to make sense out
of the variations you speak of ?
I missed your previous comments on this .
Thanks
Joe
Paying more attention will not save them from what’s coming…they are poweless to do anything to stop it.
It would appear they have opted for even more leverage, no doubt to bring on board any remaining recalcitrant bulls, and demoralise any remaining stubborn bears. The funny thing about leverage…it eventually ALL has to be unwound. Momentum chasers are going to be stunned…norhing new, under the sun…
The imminent new highs for b means an expanded flat unfolding, imho the banksters’ most potent weapon of misdirection. This sub-wave c has a ways to go to equal the a wave…
Fasinating how many pundits interpreting removal of “patience” from the FED statement as all but naking a July cut a certainty. If you read what was actually said, that conclusion is debatable. What is clear is that the board is divided on the question of the size of any cuts, and whether there should be any. Some argue additional tightening is in order. With less than 300 basis points to deal with the coming recession, the FED is in dire straits. With indicators already rolling over, the big question for them is how much ammunition will they have when the down-turn inevitably arrives. Do they deploy it in an attempt to delay the inevitable, or do they save it for an official declaration. It seems to me if jawboning alone serves to galvanise bullish frenzy, why on earth would they they expend real bullets?
Yeh, and whether they use their ammo after the battle is over. The Macro gang sees growth, earnings and inflation slowing on a ROC basis that will take market by surprise (accelerating slowing), and leave Fed behind in the ammo game. If they are right, those numbers will reveal in July/August so there is time for the party to continue a while. Verne, if we get that c=a you mentioned in post above, that would hit the 161.80% fib at 3024 ish that Peter T put in his chart this week. Watching for keys to next moves across sectors and factors.
Up, up….and away! 🤗
I am curious. Is anyone else amused by the market bolting higher on what was essestially a FED TIGHTENING decision?
FED funds rate now comfortably above the 3 month and 10 year yield. 10 year fell below 2% Are market participants stupid? (I happen yo think it is all bankster leverage).
Oh, I get it, the easy money is on its way…next month for sure. Maybe this time the inverted yield curve will lead to something different! 😎
I am starting to migrate towards Joe”s camp on where this market is headed.
The megaphone poo pattern seems increasingly plausible with price headed toward the upper boundary. Once we get there, a move to the lower boundary will issue in a bear market technically, even if a C wave. Looking at the time relationships of the prior two legs, that move could easily be over in two or three months. What happens next is where our scenarios diverge. A down market next year would imply the next move down will be the beginning of a lengthy bear market and any bounce would be corrective in a new long-term down-trend. McHugh is in this csmp. While certainly open to this possibility, I still lean toward an upcoming brutal “C”, as opposed to a larger “One” down.
A move above 3000.00 on a close would cause a re-think…
Fed ease is a done deal. They use specific words to signal action – removal of patience was just that. The talk will shift to how much (25 or 50). If you think otherwise, look at all the previous Fed statements (I have read each and everyone published since 1986).
Keep in mind : Sell equities after the first rate cut. Buy it on the last one..
I’m still curious what my astro point 25/26 June will yield, it suspect it will be a top.
https://www.youtube.com/watch?v=r7kMSqgruOY
I will suggest slightly different pattern – flat b/B is running. Next lower to around 2700 for 40 week cycle low and finished b/B.
Then c/B for 3-4 months to around 3050 and 40 week cycle high.
At this level c=0,618xa(of B), B=1,38xA huge expanded flat, the trend line connecting the tops will be hit and B=A in time. Perfect fibo and time….
In Q4 C lower begins to finish the whole pattern which begun early 2018 with important cycle low 2020 – 4/9 year cycle low.
See DAX or EEM fit very well.
This gap up today looks to me remarkably contrived.
It smack of leverage running wild.
I would not be in the least bit surprised if that’s all she wrote.
Banksters!!! 🙂
Haha!
My assessment of how the banksters would respond to the formidable resistance the market was facing was right on the money. They would either have to lever up big time to gap price past it or they would throw in the towel and unwind the already massively leveraged trade that got us to this point.
I am exiting remaining calls from straddle, thank you very much. Put will probably expire worthless but calls more than made up for that.
Does anybody out there really buy the poppy-cock that this kind of market move is due to retail investors, who are all going to suddenly turn bearish en masse at the top and cash out, sending the market tumbling?
It is impossible to understand the thrashing around in these markets unless you consider the role of the banksters! ;Nuff said! 🙂
Man Oh man!
I almost got smacked in the hiny as I exited those SPY calls!
I literally felt the wind on my rear end I rushed out the door slamming shut…hehe!
We can notice that the Banks Index remains weak and do not follow the uptrend of everything!
http://schrts.co/KbfEmBRY
Serge
Surprise, surprise! 😀
I once knew a bankster named Moe
Who opined that stocks only Grow
So he used lost of Shtick
To just pump up the Tick
And trap traders in oodles of Woe! 😀
Do we need to see the Nasdaq and RUT overcome Late April/Early May highs before this rally is finished? I would like to see a bearish divergence on the vix daily for the S&P 500 (higher S&P Print without a lower VIX print) which makes me think we have at least one more high out there to short at.
RUT just has a ways to go, about 3.8%.
Vix divergence from this mornings SPX high to now
Next Lehmann Brothers?
http://schrts.co/Gaqyxbyw
Serge
No one one cares apparently. To go with the ugliest chart in the business, they also have the most bloated derivatives book.
What could possibly go wrong…?! 😀
For the average person who uses their credit card
interests rates from 15-26% is the norm .
Not everyone pays that rate because they can pay off the debt monthly .
Some pay lower rates and I wont dispute that .
The government is the largest debtor in my eyes so the fed raising or cutting rates at these levels doesn’t really do anything ( just my opinion )
Interest rates moving from 3% to 6 % will kill Federal budgets
Corporate buy backs are driving stocks higher and even buffet has
done this with Berkshire .
The question im asking today though is why is this becoming an overnight market here the cash index’s close ok and yet the overnight action pushing it up ?
The is a lot of foreigners who have debt based on the us dollar and as the dollar rises those debts rise as well . he only way to hedge that debt is to buy us dollars or us dollar assets .
I don’t know much about Foreign Account Tax Compliance Act FATCA
but from the little I do know it has turned the united states into a tax haven .
All of these things get priced into the charts if you believe in technical analysis .
I cant prove any of this so im just speaking my opinion here .
It appears to me that money is coming from outside the united states and moving into the us markets in the overnight sessions .
I have seen this in the past and questioned it then as I do now but I cannot
back it up with any proof .
My basic thoughts on trump are he tends to have a best seller at the top and ends up in bankruptcy court at the bottom .
He has been taking the united states through bankruptcy court on a world scale with trades wars and he is trying to re organize the usa financially . that is my opinion here only .
Lastly larry kudlow was apart of Reagan omics . They are just doing the same thing that was done back then . The difference though is back then interest rates were through the roof and coming down . Today interest rates are in the toilet
and from my perspective on the rise ( big picture )
The us dollar rising will squeeze corporate profits
and now they say trump is moving towards a currency war vs trade war ???
—————–
Cyclically only and being very strict id say no way in hell trump gets re elected !
My reasoning is come august – early sept we begin a 10 month bearish cycle
and come January we begin a 1 year bearish cycle .
that implies a potential crash or even a couple of mini crashes between August and Nov and Jan 2020 through jan 2021 .
These cycles do not work every single time mind you yet if I include Peter T
and Elliott wave theory ill conclude that :
given all of the negative biases towards trump the only way to get him out would be to tank the stock market .
who does not want this ??
on the positive trump has benefitted by the strong economy .
Back in 2012 Obama got re elected following a sideways move and then the market went higher afterwards .
This time around, while im thinking somehow trump pulls it off and gets elected
for him to do so the markets would have to at the very least flat line .
I cannot call for that based on the cycles we will be in .
Next year is flat out bearish on many fronts .
I can see in a simple explanation that most market participants will simply
sell this year and sit out next year and take a wait and see approach because of the political uncertainty. I view next year as a huge political battle and no stops to be pulled as everyone take the we have to beat trump attitude .
Its not going to be about what can we do or about any plan per say .
it will be I can beat trump .
cycle wise he loses yet im so not sure that is what actually will happen .
come mid august I begin selling portions of stocks I own .
by early September I want to have my selling finished up .
Come early sept I want to be fully hedged with any remaining stocks I own .
the January cycle high I speak of leaves me mixed .
In the mean time im letting the wave count unfold .
Long term I think it is the Bond markets that get Crushed
Joe, the volume profile simply does not support the theory of foreign inflows driving prices higher imho…
The bond market is going to be most interesting. I am curious to see how traders are going to handle the initial stark divergence between Treasuries and corporate issues…
Verne
you may be correct yet im just posting my thoughts so im not basing this on anything factual .
The year 2021 is cyclically mixed .
the 20 month cycle turns up in June yet the 2 year cycle points higher .
as the spread between these 2 cycles widens my work will probably fail more often .
I view the year 2021 as the end game . ill go into detail another time .
5th waves are end games yet so are 2nd waves or B waves .
The end result is after trump we get higher taxes and more social programs if the democrats get elected .
Under Elizabeth warren : she says she will help with the student loan problem
the younger generation who is still living at home at 30 yrs old wants to be taken care of .
Come election time nov 2020- Jan 2021 ( cycle low ) we should expect a relief rally .
whether this means change for those hoping for more freebies or more of the same wanting trump it will begin civil unrest as everyone battles for what they thought they wanted but did not get .
The stock markets depending on the outcome of the elections will still most likely bounce yet depending on who is in office its still an end game .
This entire run since 2016 has been an inversion . it has taken everything in the book to get this market to move higher .
Fed stimulating, corporate buy backs , Low interest rates and a hell of a lot of manipulation .
Everything has a point where the cycle is done and in this case . this entire run from 2009 to date has essentially run its course .
Right now the stock markets are not trading on anything fundamental .
When the money flows out of bonds and into stocks and we start hearing about
government pension problems not to mention social security means testing you will know it is game over on an epic scale .
Global cooling added to the mix and when people actually finally realize they have been fed a line of bs the proverbial crap will hit the fan .
Again im just talking my opinion here in a very broad view yet I thihk we all see whats coming .
in the end its about getting the timing correct .
I would not be surprised to see the final Brexit exit in September nor would I be surprised to see mr trump fail to get a deal with china near that same time frame.
There is typically a news event that brings these cycles together .
That’s it for me for a while .
I have a lot of longer term cycles to tie together and it takes me weeks to lay everything out .
Ill try to stay quiet for the next month ( going to be tough but ill try )
We taking side-bets on you keeping quiet?
🙂
I’m in!! 😁
July 2 a high and the lunar eclipse in late july a low
then another blow off move into mid august early sept the top .
I wont call it the final top but my bias is that it will be .
The jan 2020 cycle high really makes for an interesting discussion yet were months away .
a drop from early sept into nov is a must in what im looking at
then the Christmas rally would be nov to jan then by by for 2020 .
Im not changing my mind on that until im proven wrong .
Im finished 🙂
🙂
Thanks Peter
I haven’t read your other work, but will tonight. 🙂
toooo funny peter.. 🙂
Johannes..thanx for posting that video..good one to catch..
💥June 20💥 is a dual PD-1 & PD-2
https://twitter.com/allerotrot/status/1141348220670545921
there are two more dual PD-1 & PD-2 pivot dates in 2019…one of the future dates will be the single most significant date during the remainder of 2019…mucho $$$ will be made by those who play ‘the date’ correctly!
Thank you.
Hey Joe,
The best source by far is Puetz’s book and then his newsletters, because all I have ever found on the web is essentially only a part of his work on this. Essentially the Puetz eclipse cycle is an idealised cycle of how prices behaves over the entire 5.5 month eclipse cycle. We are all familiar with the most likely setup: top on the NM prior to the SE, fall into NM, pop into LE/FM then panic, and also the windows that centre around a FM that is also a LE or within one cycle of a LE. The variations on a theme are the timing of the top – it can be the 2NM prior to the eclipse like 1929 or it can be the FMLE like that of the Tulipmania – the length of the topping process which is usually 6 weeks but can extend to 10 or essentially be nil in the case where markets top on the FMLE and finally the length of the panic. The current price action would resemble the 1929 example. Now having said all that, the Puetz eclispe cycle is more potent when it aligns with the seasonal cycle. Given that we are not yet in a period of seasonal weakness, this suggests the current price action, while it may look like an eclipse cycle playing out, is in fact just merely coincidental. I believe that to be the case, but Im not dogmatic in that stance given all the warnings i have been talking about like the Eurodollar pricing in 4 cuts over the next 12 months. So I think it is plausible we start to sell off really soon, and then the Fed come to the party with a 50bp cut, markets party like it was late 2007. If you email me at clubrioinc at yahoo dot com dot au I can send you a bit more stuff on the cycle.
Tom do you have a read on the energy for tmo going into next week?
What do you guys think of the RUT chart?
Trading is war!
Every trader has seen his stops placed in the market violently run only to have price “suddenly” reverse and head in the opposite direction.
We have all seen the “Max Pain” of OpEx as market price seems to get mysteriously “pinned”
I could give countless other similar examples of how market makers even collude to cheat market participants.
My point is the market, in my opinion, is subject to sinister forces intended on separating you from your hard-earned money, and which cannot always be predicted.
I raise these points to talk specifically about yesterday’s gap higher, which remains open.
You know my theory about gap’s being evidence of bankster leverage more than bullish enthusiasm. I had in fact speculated earler that they would have to use leverage to get past resistance and I believe that is exactly what they did.
Someone sent me a chart wondering if it could be an “exhaustion gap”, and it well could be.
The question is, “How would we know?”
There was a time when a gap to a new high, filled in the same or next session could indeed be considered a bearish reversal signal.
If you have been paying attention lately, you know better. We have watched in amazement as price moved well below an open gap area, giving the impression that the gap failed to prove support, only to turn right around and go on to new highs, this sometimes taking place even after island reversal patterns. While some would argue that this is just the waves playing out, as an active trader I have seen this kind of thing too often to not conclude this price action is the result of purposeful, intentional behavior, intended to ambush traders looking for these kinds of patterns. Perhaps there really is no conflict here as the waves ultimately reflect, often in complex ways, the buying and selling decisions if market participants.
Bottom line?
I would NOT consider a closure of yesterdays gap, in and of itself to be bearish, as it well could be a trap. Especially if it happens slowly. If I am correct about price and leverage, the unwind will be unmistakable, and swiftly take us back below the 2900 price area, where the leverage presumably was deployed. Anyone chasing the rally will he hopelessly trapped, as was the intention!
Despite the negative divergences at these new highs, we have yet another even larger sideways consolidation pattern than the last one. Personally I don’t particularly like it, but frankly it looks very bullish for obvious reasons…
BTW, larger consolidation not in time but price range…
Interesting RUT divergence. Is it leading, or will it follow? Gap below so far filled. Looking to see if that move negated or we head lower. If so it could be leading the way…
I was right.
Selling DJIA 265 calls for a nice 50% pop.
If I only had the cohones to actually trust what I see in the markets I would much bigger trades on these kinds of set-ups. I am just a WUS, plain and simple…! 🙂
Sorry, 269 calls…
Now…let’s see if the banksters really unwind. There will be no mistaking the event. They can run, but they CANNOT hide…he!he!
We have a good idea how the shenanigans are going to end.
We just don’t know just when.
I am going to take a new low today in RUT as probative and load the short-side wagons for August expiration….just in case…! 🙂
Just to piss off the market makers, I am buying DIA 269 strike puts expiring today for 0.30. Now watch them trash around but I am going to have a bit of fun with house money! 🙂
Someone had mentioned Gold Silver ratio. My 2 cents. I am always long that ratio going into economic weakness (like right now). That ratio peaks well into a Fed hiking cycle. For example, it peaked in November 2008. That ratio peaking signals a reversal from panic to stability. At some point, Dollar will head higher and when that happens, this ratio will go even higher. I would not take the other side till at least 4 or 5 rate cuts / QE restart.
I have found it useful as a buy/sell trigger for Silver. 🙂
That was quick!
Sold half for 0.72
Two can certainly play the OpEx game!
I am really surprised more traders don’t make the MMs pay for their OpEx skulduggery!
Selling next half for 0.85 and rolling down to 268 strike puts, again for 0.30
What fun! he!he!
Dummies! 🙂
Let’s think logically for a moment.
If Peter T is correct and this market is going to revisit the Dec lows to complete this interminable fourth wave down (and I think he most certainly is!), AND, if am correct in that the banksters have moved price up to these levels with very limited additional upside ( and I think I most certainly am!), what on earth is there to militate against trader immediately taking a short position a few months out to capture the coming carnage?
Even if SPX does hit my max upside target of around the round number 3000 level, the draw-down on any carefully chosen puts at least two months out is 3-5% at most. I think it is nuts to let the market maker push us around with this ridiculous whipsaw trading considering we know where this market is ultimately headed. Why are we such WUSSIES??!! 🙂 🙂 🙂
You know what I am gong do.
I am setting a hard stop on short positions on any CLOSE above SPX 3000.00 and off to make myself useful in ways other that watching this side-show.
Have a great and relaxing week-end everybody! Cheerio! 🙂
Bis repetita?
https://drive.google.com/file/d/127RwCkHoodZcs8fJFcMI_7gxUOyHyHpg/view?usp=sharing
SPX drop could eventually occur faster than thought and quite badly around September 2019 (graphically, but not precise at all).
Time will tell….. soon.
https://worldcyclesinstitute.com/reaching-for-the-top/#comment-40647
Outstanding chart! Love this perspective. Thanks for sharing.
Yep! The quant gurus at Artemis and Fasanara are predicting Volocaust II is going to be historic!
BTW, so far as timing the September period looks to align quite well with a possible third down of a C monster wave…
A new weekend blog post is live at: https://worldcyclesinstitute.com/a-summer-to-remember/
This website is for educational purposes relating to Elliott Wave, natural cycles, and the Quantum Revolution (Great Awakening). I welcome questions or comments about any of these subjects. Due to a heavy schedule, I may not have the time to answer questions that relate to my area of expertise.
I reserve the right to remove any comment that is deemed negative, is unhelpful, or off-topic. Such comments may be removed.
Want to comment? You need to be logged in to comment. You can register here.