

A Major High Dead Ahead
There’s a lot of unpredictability built into the market overall at the moment. We’re close to a major top, so you have to expect some volatility and a lot of uncertainty. It’s a dangerous market.
While this weekend’s prognosis across the various asset classes seems fairly obvious, it also signals the need for some caution. It’s often better to get in a bit late once we see the move, and to keep stops relatively tight.
The current pattern in the US indices is a broadening top and from the book I cite below (Murphy), here’s the quote that worth paying attention to: This is an unusually difficult pattern to trade and fortunately is relatively rare.
However, it will lead to a major high and a short that will last for weeks, if not months, and probably take us into the early fall. At the bottom of the pattern (somewhere under 2100 in the SP500), I would expect lots of fear and a final dose of QE, which will be enough to get us back up to a new high, but not much more.
It’s all slowly playing out as predicted.
_______________________________
Broadening Tops
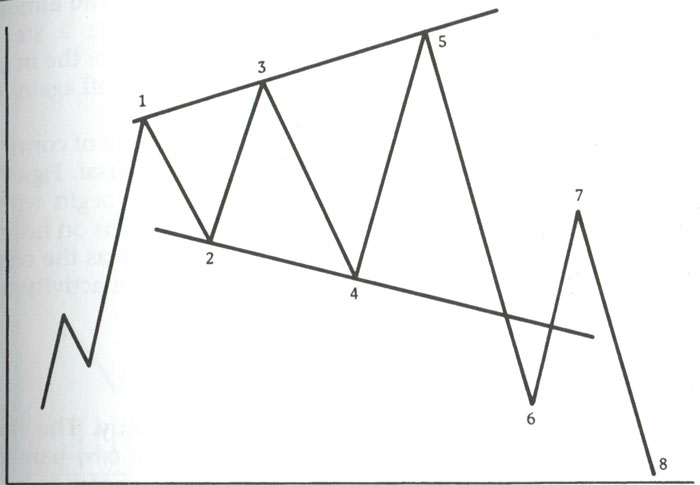
As mentioned last weekend, broadening tops are not Elliott Wave patterns, so require a bit of additional research to stay on top of them. They’re extremely difficult to trade and we’re seeing that in the current subwaves (not reasonable retrace of the B wave … so far).
In any event, here’s a bit more information from one of my favourite resource books on trading …
From Technical Analysis of the Financial Markets — John J. Murphy:
 In other triangle patterns, volume tends to diminish as the price swings grow narrower. Just the opposite happens in the broadening formation. The volume tends to expand along with the wider price swings. This situation represents a market that is out of control and unusually emotional. Because this pattern also represents an unusual amount of public participation, it most often occurs at major market tops. The expanding pattern, therefore, is usually a bearish formation. It generally appears near the end of a major bull market.
__________________________________
NYSE Update
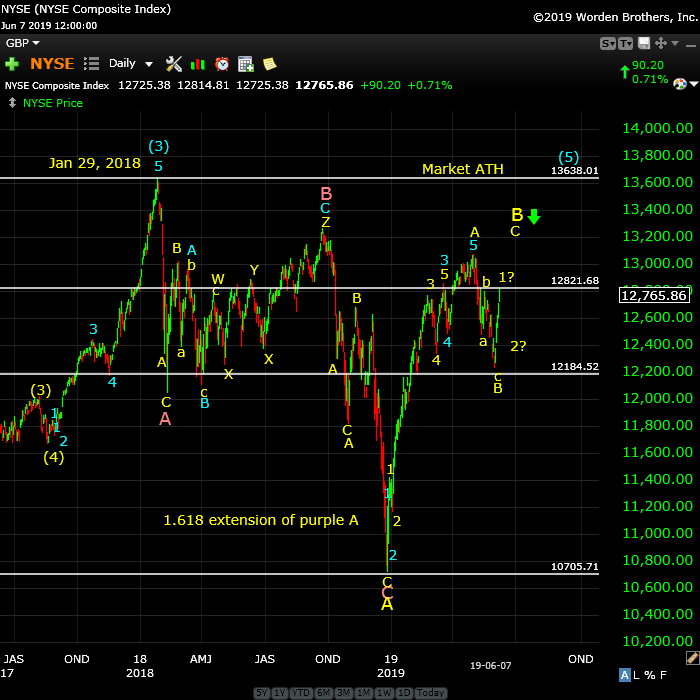
Above is the daily chart of the NYSE showing the large ABC fourth wave that we’ve been in since the top of blue circle 3 on January 29, 2018.
The most recent wave up from Dec. 26, 2019 is corrective but I’ve numbered it in five waves (they don’t follow the impulsive wave rules, so they’re corrective). I’ve re-labelled the first portion of this A wave up as a 1-2,1-2 pattern, resulting in a 3-4, 3-4 pattern at the top of the yellow A wave (slightly above 13,200).
This weekend, we have a triangle forming as a small B wave in a projected move up to a new high above 12,821.68. A top will result in a very deep wave down to a new low below 10,700.
Possible timing: I’m now expecting a high somewhere in June now (the market is moving quickly now), with perhaps our big drop beginning then and lasting through early September (my dates here are speculative).
As I often say,
“Trade what you see, not what you think.”
___________________________
Elliott Wave Basics
Here is a page dedicated to a relatively basic description of the Elliott Wave Principle. You’ll also find a link to the book by Bob Prechter and A. J. Frost.
____________________________
Registration for Commenting
Want to comment? You need to be logged in to comment. You can register here.
If you register, it protects your information. It also allows you to comment without filling in your information each time. Once you’re registered, simply go to the home page and click on the login link top right in order to log yourself in. Usually, you’ll be logged in for several days before needing to be logged in again.
______________________________
Problem receiving blog comment emails? Try whitelisting the address. More info.
______________________________
A true expert in Elliott Wave FL 2
A true expert in Elliott Wave …You are a true expert in EW analysis. What you provide is not available anywhere and is priceless. Subscription on your services is the best thing I have ever done. Many thanks for your effort to make me a better investor. I now have more trust in my investment decisions. I hope you will continue the excellent work! —FL |
Couldn’t be happier … KK 2
Couldn’t be happier …The analysis and insight you provide is simply amazing! I’ve been trading the futures and equity markets for well over thirty years and usually average around 5% monthly. Since joining your Traders Gold Service two months ago, that number has better than doubled. I couldn’t be happier.—KK |
Tops in your field DZ 2
Tops in your field …You are tops in your field. Tried to follow Elliot Wave international for years. They were always behind the market. After discovering you, I perceive that you are an expert in reading the waves, which puts you way ahead of the rest of your peers. And you can read the Waves like you are reading tomorrow’s financial section. I pray you stay healthy. —DZ |
Have not had a losing week RW 2
Have not had a losing week …I have been with Peter almost a year. The only thing that matters is have I made money with his service. I think I have finally turned the corner using Peter’s EW. I have not had a losing week in the last 5 months. Thanks Peter, for your amazing amount of hard work. —RW |
the real deal SM 2
The real deal …‘Educational, insightful and thorough market analysis for all levels of traders. It’s Elliott Wave at its best….Peter Temple is the real deal’ —SM |
Rise above the rest … SM 2
Rise above the rest …I have only ever met a few people who, in their chosen fields (astrology, medicine, music, martial arts, technical analysis), rise above all the rest and you are one of them…you have ‘the gift’…and that’s why I’m a Trader’s Gold member. —SM |
Get an upper hand … JC 2
Get an upper hand in trading …Seeing all the different currency pairs and the wave structures and hearing you explain why this has to do that on a nightly bases gives one a upper hand when trading. Elliott Wave applies to all stock and indices and can be applied to any candlestick chart. If someone ask what you want for Christmas – Tell them a membership to Peter’s “Traders Gold!”—JC |
The best of them JL 2
The best of them …Last couple of years, I subscribed to several ‘market traders’. You are by far the best of them and the personal contact is awesome. Daily and daily updates are very well written! Besides your expertise in EW, I also like your cycles analysis. Best investment I ever made! —JL |
US Market Snapshot (based on end-of-week wave structure)
This chart is posted to provide a prediction of future market direction. DO NOT trade based upon the information presented here (certainly NOT from a daily chart).
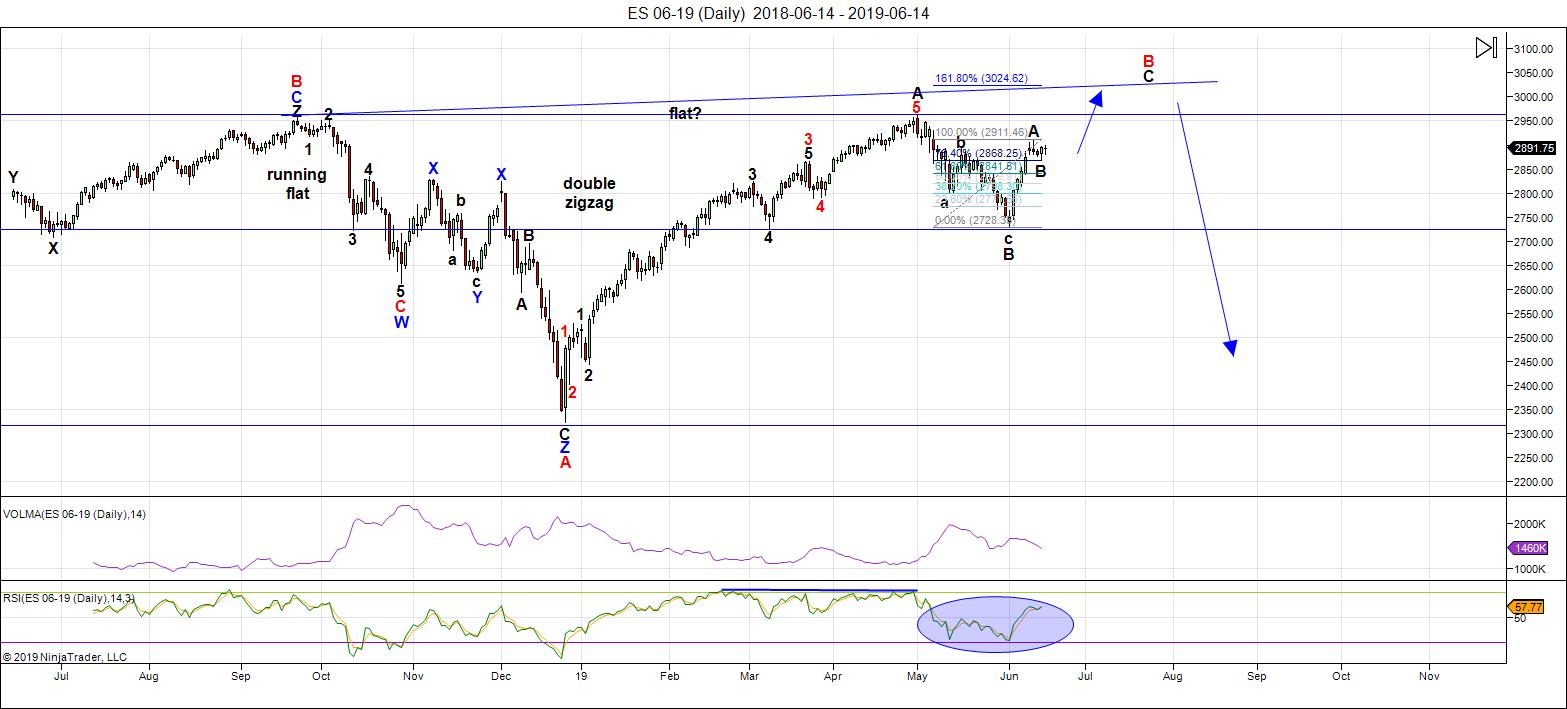
Above is the daily chart of ES (click to enlarge, as with any of my charts).
After last week's predicted turn up from the 38% retrace level, we've plateaued in a shallow retrace, which appears to be tracing out a contracting triangle. There's still a chance we could see a deeper retrace to the downside, but with currency pairs (and the US Dollar Index) very near inflection points, the likelihood now is that the triangle will act as the launching pad for the final C wave up to a new all-time high.
After we reach the final high, we'll see a turn to the downside with a major move to a new low under 2100.
It's impossible to successfully analyze this market without taking into account the movement of a number of related asset classes. The market has gradually been aligning across these asset classes and now virtually everything is moving more or less in "lock-step." When you trace out a major top, all major indices have to top at the same time. This 500 year topping process will include many international exchanges.
Summary: Expect this extreme rally to continue to a new high to complete this large, corrective "B wave" up from the Dec. 26 low. The pattern is a record-breaking broadening top.
Once we reach the high, I'm looking for a dramatic drop in a 4th wave to a new low. ES will eventually target the previous fourth wave area somewhere under 2100.
Once we've completed the fourth wave down, we'll have a long climb to a final new high in a fifth wave of this 500 year cycle top.
___________________________
Trader's Gold Subscribers get a comprehensive view of the market, including hourly (and even smaller timeframes, when appropriate) on a daily basis. They also receive updates through the comments area. I provide only the daily timeframe for the free blog, as a "snapshot" of where the market currently trades and the next move on a weekly basis.
______________________________________
Sign up for: The Chart Show
Next Date: CANCELLED for June 19 (US market time)

The Chart Show is a one hour webinar in which Peter Temple provides the Elliott Wave analysis in real time for the US market, gold, silver, oil, major USD currency pairs, and more. You won't find a more accurate or comprehensive market prediction anywhere for this price.
Get caught up on the market from an Elliott Wave perspective. There’ll be a Q&A session during and at the end of the webinar and the possibility (depending on time) of taking requests.
For more information and to sign up, click here.
| "I think you are the only Elliot Wave technician on the planet who knows what he's doing.” |
| m.d. (professional trader) |
All registrants will receive the video playback of the webinar, so even if you miss it, you’ll be sent the full video replay within about an hour of its conclusion.


“India is now considering possible retaliatory measures, and has been edging towards closer economic ties with China for a few years. This move may push them all the way into China’s camp.” ~ June 12, 2019
http://alt-market.com/articles/3801-the-trade-war-is-about-to-become-an-economic-world-war-iii
“India to slap tariffs on 28 US products on Sunday” ~ June 15, 2019
https://www.rt.com/news/461965-india-slaps-tariffs-us-products/
Thanks for the update Peter!
Another excellent analyst, Mchugh, has recognized the broadening top pattern that has befuddled a lot of EW analysts. I think you will be proven correct with a sharp upside break from the sideways consolidation. I do suspect its duration points to a higher move than most traders expect.
Thanks Peter, It is inline what I expect right know.
June 17 is a turning point and my first thought was it will be a bottom,but I think it will invert into a top after that we will see a bottom June 20/21 after that we will go up once more till June 24/26.
June 24/26 is very important, it will be the start of a bearmarket lasting till into late summer 2021.
kinda like this John?
https://imgshare.io/image/june-10th-21st-energy-chart-blue-line-black-background.CZbZ9
Thank you Tom. Have a green week 🙂
Hi p.
looks like another inverted week?
https://imgshare.io/image/june-10th-21st-energy-chart-blue-line-black-background-inver.CXJCQ
Thank you sir!
Hi Tom,
It is not easy to predict what will happen right now, but it looks like that we will top around June 24/26, maybe sideways or small dip by then and higher again…
As per https://www.swpc.noaa.gov/products/3-day-forecast
lot of ups and down next 3 days.
16th – Buy early sunday open if down sell midnight
17th – Buy RTH open if down and sell late in the evening
18th weak open and ramp through out.
Peter, may I ask you a question about Armstrong, maths and finance guy.
I never followed him…. Is it serious?
What is your opinion about him?
Thanks
Cheers
Serge
Ser Ros,
I don’t understand the first question .. is what serious?
The second question is far too vague for me to answer. Opinion on what exactly?
Someone told me that he is doing long term studies based on cycles.
Do you find his work serious and relevant?
Yes, he was Executive Director of the Foundation for the Study of Cycles, as was I for a short time. I know his history. I don’t follow his current work.
Thanks Peter
Peter T,
Thank you for your wave count and thoughts on how this plays out. I don’t know if you will comment on this, but would appreciate your thoughts and comments from others on how this looks with the wave and technical indicators. It sounded like you were expecting a deeper wave B down this week but shallow retrace may be enough to get big move up. I thought the move down and rebound since 5/1 looked much like initial drop 10/1/18 with rebound into 11/7, which resulted in a move from X to Y-X-Z on 12/24. If we get a big move to ATH off this 4 day shallow pullback (PB), it could look a lot like the X-Z from 12/3 with a small A-B (except the move is inverted).
TA shows this as exhaustion from 12/3 at 200EMA; now we are seeing strength off the rebound on 6/3 (at the 200EMA). I still see resistance but I get your vibe that these are challenging times. Thanks again Peter.
The Dollar and related currency pairs are set up for a turn, so they’ve completed the correction I called for, but eminis have not corrected to the same degree (in fact, I’ve never seen such a muted correction). They’ve traced out a bullish triangle that hasn’t retraced to the typical EW level. On the other hand, the larger broadening top pattern isn’t an EW pattern and is so rare, I’ve never analyzed one before. So, we’ll see what happens this weekend. My Trader’s Gold folks have the numbers for what to watch for and how to respond.
I know where it’s going longer term, just not how it’s going to get there (based on the most recent action). As I’ve said before, many times “The market does the most predictable thing in the most unpredictable manner.”
I know where everything else is going, but futures are a bit of an enigma in the next 48 hours.
Thanxxxx Peter!
Thanks for the new post Mr. Temple!
If that 4 day consolidation last week was a bull flag (some say it was negated), a move up to match the pole would be QQQ ~195. Have a great week folks, just trying to keep both eyes open.
Well it’s going to be an interesting few days to say the least.
Market has priced in up to 3 rate cuts over the next 6 months or thereabouts, with the first cut most likely in July. And the looming fed meeting is 2 days after a FM, which is important in that the S&P500 has been moving in a manner consistent with the Puetz eclipse cycle. This FM is 6 weeks from the top which is the most likely outcome for the lower/final high per the eclipse cycle. Now there is a chance this is all purely coincidental given the low geomagnetism numbers coming through but then again inverted bond and Eurodollar markets, the fed’s inability to influence/control the one lever they have, significant weakness in commodities are all screaming all is not well in the global financial plumbing. Now for the record I still feel the S&P 500 has another high in store; my only question is on the timing of that event.
I am so fascinated by how we are daily fed the propaganda of both financial and lame stream media that market price action is some kind of primeval battle between bulls and bears. Balderdash!
Does anyone really believe this is what is really going on when we see cash infusions in the amount of billions of dollars to defend critical price levels? Are we really that gullible?
I know some disagree, but I have come to the conclusion, based on observation, that market price action is primarily a function of central bank activity and only peripherally so-called “herd sentiment’
Here is what is absolutely fasinating about where we are.
For ten years central banks, including the FED, have supplied virtually unlimited liquidity to equities markets, and have done done so with little or no concern that such action would imperil their own existence. To me the billion dollar question is have we arrived at a juncture where the FED ( and other assorted banksters) will have to contend with the Gordian Knot of either their survival or the market’s. I, for reasons previously cited, contend that the interest rate connundrum puts them exactly in that position. Some think the FED is suicidal, and they well may be. I think not.
Verne, I like the way you think… central banks have messed up natural cycle over the last decade, and when they are no longer effective (if they are) will be messy, like a freighter trying to avoid an iceberg at the last minute. A direct correlation means giving too much credit to CNBC and other talking heads that KNOW the reason for every market move. I’m sticking with reduced position size in this wave 4 (quad 4) environment until I see momentum change or increase (as people realize rate of change is overcoming the Fed and BTD.
VOL up a little (with VXX,TVIX) down a little leaves me with little interest until market decides on VIX 10-15 range or 15-22 range. buona notte!
Smart Mojo.
I am doing the same thing I do on every occasion of FED speak as the results are always predictable- an options straddle. Generally both contracts pay and the idiot initial reaction ensures a big pop in one or the other contract. It is quite interesting to note how market makers are priicing Friday expiration SPY 290 calls and puts. This morning the former traded for 1.53, the latter for 2.53 so you can see how the market makers are thinking. Total cost of the straddle was 4.00 evem and it is quite the no-brainer trade, as many of you no doubt are aware….
Verne – I don’t think Central Banks are worried at all about their own survival. That was the most important achievement of moving away from the Gold Standard. All Central Bank crisis in the past came from a similar sequence of events : (1) CB buys assets with artificial liquidity. (2) Value of those assets fall hard. (3) The artificial liquidity that was denominated in Gold suddenly becomes a real liability that the Central Bank can no longer honor. The only way out in that situation was that the central bank would “devalue” their currency with respect to Gold. The citizens would get hammered and foreign creditors would get paid in Gold. That’s the reason every central bank economist thinks of Gold Standard as an archaic prehistoric medieval monetary system. Under the Fiat system, the central banks “believe” that they will never face that outcome and hence are comfortable inflating asset prices at every dip. BoJ, ECB and BoE are all further ahead of the FED in this exercise. I am sure FED is headed in that direction. Given that mind set, I doubt the FED will be worry about long term implications of their actions. I fully expect them to take away all obstacle to a rate cut on the 19th and then start the easing cycle next month. Shorting the market rally that happens due to the first FED rate cut is one of the best times to short. Thats the time when the herd buys saying : “Don’t fight the FED”. But history shows that fundamentals keep deteriorating for weeks after the FED cut and the market starts clamoring for more rate cuts. The bottom comes when the FED panics and throws the kitchen sink at the economic slowdown, with the herd saying : “FED knows nothing” !!
Careful, because the CB have limited control on rates, but lead by bonds market!
What China does with its huge reserves in bonds could have tremendous impact on US economy.
Excellent point. Some contend that the FED actually has VERY LITTLE actual control of long term rates and that they have to follow the lead of the market.
The coming wave of corporate bond defaults could well see an initial flight to the “safety” of Treasuries and an initial fall in rates of that particular instrument, and divergence from the carnage in the rest of the bond world. I suspect the contagion will eventually reach even Treasuries. Not sure how this plays out in a deflationary environment but the debt crisis seems to be to be destined to send all rates ultimately higher…
Great points Vivek!
It may be they no longer care about their own demise, but I doubt that. One give-away is their on-going pre-occupation with inflation, which has been their vehicle of choice for surviving the mess they have created. If you are correct that they no longer care about their own survival, then onset of a deflationary depression that totally undermines thier typical means of escaping the coming carnage, as welll as having less than 300 basis points to deal wirh the nexr recession mean a speedier ruination than most expect in my view.
It is truly amazing how clue-less some of the wave counters out there are.
How can any reaonably informed analyst, much less a trader, call what is so clearly sideways consolidation in a uptrend the start of an impulse down?? These people are dangerous…! 😎
26065 remains my key pivot on the cash Dow .
There is a price targeting method using a failed
Head and shoulders top formation .
It’s been a long time since I’ve used this method yet I think
It’s worth looking at .
A normal head and shoulders top formation .
You take the price movement from the Top ( head ) to the bottom
Of the left side Neck . You then project that price movement from
The right side Neck low .
When your looking at a failed head and shoulders top formation
You take that same price movement from the Top ( head ) to the bottom
Of the left side Neck and you project that same price movement
Measuring from the Top of The Left Shoulder Peak .
If that price level is taken out you then measure upwards a total of 1.618
Times that same initial price movement ( the Top to the left side Neck )
Since we have both an inverted head and shoulders pattern as well as a head and shoulders top formation .
It is obvious the market is confused .
Running both price projections should give us a guide as to where
Price may end up at the final top .
Peter T
Just food for thought for you if you find an interest .
It’s easy to look up mercury retrograde periods .
Normally ( my observations ) it’s a 10 day lag from start date
To end date that needs to be looked at .
The mercury retrograde time periods in 2019 :
March 5 to 28
July 7 to August 2
October 31 to November 20
Under the typical set up we will see a low 10 days
After the start date .
Under what I call a mini crash scenerio we will see a high
10 days after the start date and the final low would be 10 days
After the end date .
July 17 2019 would under normal circumstances be a low .
July 16-17 2019 is the next lunar eclipse .
July 2 being the solar eclipse and adding 6 weeks being mid August .
10 days after the end date of the mercury retrograde period is
August 12 th .
Going out further
The Oct 31 start date of the last mercury retrograde of 2019
Adding 10 days I would expect Nov 10-11 th a low
( this goes somewhat against the mars Uranus cycle high due Jan 10 2020 )
Lastly
Looking at Chris carolans work ( spiral calendar )
Keeping it very simple .
A low is due 55 hours prior to the new moon :Oct 24-25 2019
As well as near Nov 11 2019 .
It’s going to be very interesting see how the wave count forms
Over the next month .
From July 2 solar eclipse into the July 16-17 lunar eclipse should
Be bearish if I have all of this calculated correctly .
Dangerous market no doubt
Joe it seems to me that the relentless cash infusions are being deployed to defend the round number of DJIA 26K.
So far as near term signals are concerned, inability of the bears to close pricr beneath it for the past week does argue strongly for an upside break. Not even futures moves below it have been sustained. The level is clearly significant.
Thanks Joe, solid information your Cristall Ball also knows what Draghi is going
to tell…hahaha.
The mid August time period should ideally produce an important Top .
I’m not changing my mi d on that .
We may end up with just a 3 wave move .
It’s all coming together 🙂
If we are in some kind of triangle in the cash session, I suspect we will not take until August to complete the final wave up.
Interesting dichotomy between your astro prognostication, and simply looking at the wave structure! ☺
( I know, you will probably end up bring right!)
I have to give credit to some Elliotticians who are now charting the real possibility of an upside break from some kind of triangle. DUH!
The sideways consolidation from the uptrend one would think should have made that abundantly obvious! 😛
We know triangles are penultimate patterns. Right in line with this site’s call for a swift march to new highs! 😇
Joe thank you for the knowledge appreciated..M.A has first week of August as possible TP, and directional change..
So amusing…
The idiot talking heads attributing the thrust uo to the other idiot Draghi.
Anybody with eyes to see knew that was what was expected upon triangle completion.
Let see what other moronic attribution will be seized upon to explain the coming reversal.
I am just about ready to turn off all the talking heads so I can tune out the babble.
How can people stand it???! 😰
I turned off that noise a long time ago …
🙂
Wise man…! ☺
Speaking of Draghi
His term is scheduled to end on 31 October 2019
Damn it. I was planning on buying calls today to set up for the fed meeting.
Upside break being signaled for many days…! ☺
I know – was trying to not pay too much decay…
Unloading half of calls on upside break.
Looking for VIX confirmation of reversal to ditch the rest.
This move ahead of the FED-speak is telling you a lot…! 😉
Classic banksterism on display.
Make no mistake about it. This move is designed to intimidate bearish traders and violently shake out weak hands on the short side just ahead of what’s on deck. Lots of suckers are probably going to chase it. Volume a dead give-away. It is a LEVERAGED play, engineered by the totally corrupt cabal.
Note what happens when they unwind… 😊
If they get some support from the FED, they will try to push it for a few more days… Most likely try to take out 3000 on ES.
Yep!
They are fighting the larger context of a bearish monthly engulfing candle.
Remarkable how otherwise savvy traders let themselves get bamboozled by by short-term shenanigans of the banksters! 😁
The weekly dow chart is following the script .
This week the lesser weighted dow stocks have now hit a New All time high
while the larger weighted stocks that make up the dow are still
below the all time highs made in oct 2018 , the lower high made in feb 2019
and the even lower high made in late april 2019 .
If BA ( Boeing ) can just go back and fill the Gap it would add roughly 500 Points
to the Dow .
Im not trading Boeing just noting .
Every once in a while a guy gets it right ( even if just for a while )
This market is textbook perfect in my eyes and the end result
is an outright crash if it continues .
July 2 ish solar eclipse a high then a sideways or deep retrace into the lunar
eclipse and then a spike higher into mid august to early Sept and then a HUGE DROP.
At some point this may all fail yet if so it would be the month of October !
Until I see the failure though I have to stick to the pattern which is ( on a weekly chart ) exactly as expected .
26864 By july 2, if not higher than that .
Further upside targets being : 27160-27212 and then 27648
28652 might be about it .
27,467 would be 10 times the 1987 top .
We also have to consider the geo-political component of banksterism.
If the current administration is exercising any measure of control over the conduct of the FED, no way the crash happens leading into the election. You can be assured that whatever combination of rate cuts and announcement of resumption of Q.E needed to keep prices elevated through November next year will be forthcoming.
I strongly favor Peter’s call for that dramatic drop toward the December lows coming sooner rather than later, in time for them to pull out all the stops in the months leading up to the election. Just my two pence…!
Hear me now and believe me later (apologies to Hans and Franz!).
If we fill that open gap today, the FED is FRICASSEE!
Anything they have to blather tomorrow would have been stentoriously rendered NULL & VOID! 😎
14198.10 2007 High
570.01 1974 Low
———
13628.09 Points
*1.618
——————–
22050.249
Year 2009 Low : 6469.95 + 22050.249 = 28520.199
1982 Low = 769.98
1987 High = 2746.70
1987 crash low = 1616.20
Im looking at a quarterly chart .
2746.70 – 769.98 = 1976.72 * 13.618 = 26918.97
26918.97 + 1616.2 = 28535.17
Bottom Line : 28520.20 – 28535.17 appears to be a resistance area on a
long term chart .
Im not saying the dow will hit that im just noting the math in case it happens to get up that high .
Note :
Nothing I have posted has ever included what the Fed may do or say .
Nor have I ever included anything news worthy in my work .
If the mkt is going higher the fed can do anything and it wont matter .
The news media loves to try to explain why the market does such and such
yet its all coincidental .
The mkt rises because there is more buyers than sellers
the mkt falls because there is more sellers than borrowers .
The drop from through out may was called for in advance .
This rally was set to begin between may 21- june 3 ( and it did so )
The rally from late dec ( dec 26 ) was set tp bottom in early January
it began early .
If the fed raises rates and the mkt rallies the news will state we are in a growing economy .
If the fed lowers rates the news will state the fed is stimulating the economy
The fed follows the market and the market already lowered rates .
End result : The fed is a Non Event !
2 more weeks of upside following this week .
Added Note:
Past results are not indicative of future events
Please do not trade based on my research .
Today is 6-18 . enjoy the fib day
I think you’re too modest about your predictions, I don’t know anyone else who can make these predictions, so Chapeau.
My turning points are June 17, 24/26 and July 4.
Typo yet kind of funny mistake
The mkt rises because there is more buyers than sellers
the mkt falls because there is more sellers than buyers
In my humble opinion that depends on WHO is buying/selling.
In a market of low volume a minority of sellers/buyers can indeed drive market direction depending on how deep their pockets. Market direction is ultimately a matter of buying/selling power, NOT a plurality in either camp.
Well looky here!
Is VIX about to demonstrate that it also knows how to break out of sideways consolidation??!! He! he!
Negative momentum divergences persist at the new highs….
Man, Oh Man do I love trading triangles!
They are probably the best-behaved EW and regular T.A. pattern I know.
A real “bread-and-butter” trade!!
Joe what also is interesting is the Gann Cycle on Vix..intermediate not major points to a high on VIX on Aug 12…Major shows November..
didn’t mean Gann Cycle..sine cycle circles
John – Thank you 🙂
Verne – If the market rises next year then id say im dead wrong about next year cycle wise . Yet until im proven wrong I have to stick to my work .
If the mkt fails to drop next year then the year 2021 would be crazy bullish .
At this point though sticking to my plan.
Marie – I take it your seeing to cycle periods one in august ( Aug. 12 ) and another in November. Both interesting time periods for me as well .
Joe, when it comes to how the movement and positions of heavenly bodies affect and/or correlate with market price, my own ignorance is profound. There is absolutely no way I could make an intelligent informed assessment of what you do for that reason. We do completely agree the validity of any predictive methodology must be evaluated based on its results, assuming the method is correctly applied to reach stated conclusions. Results are accessible to any observer, whether or not he understands how predictive statements were arrived at.
So far as where this market is going, what is accessible to me is the pattern of the completed waves, their time relationships, and the way price has traded around important long-term moving averages. I agree, based on what I see, with analysts who believe that we are currently in an INCOMPLETE primary degree fourth wave. I disagree with analysts who claim we have a final top. I am OPEN to the idea that we may be in the final wave up in a “broadening top” pattern, also called a “Jaws of Death” by some, and if so, the market will top in 2019. If we are indeed in an incomplete primary fourth wave, and needing a big C wave down to complete it, you will certainly be proven wrong about your expectation for market direction next year. That is what would be predicted by the wave time relationships. We have been in this fourth wave for well over a year. You could be proven correct under a scenario where we see conclusion of the fourth, followed by completion of a primary fifth wave in six months. If wave degree means anything, to say nothing of the “right look” for the EW structure, that serms to me highly improbable, so yes, one of us will cerainly be proven wrong. Spectacularlly so, I am afraid! 😛
I changend my name on the this blog from John into Johannes, it is easier with all those John’s…
Am I the only one that thinks much about the markets’ price action seems a bit strange of late?
I am referring specifically to the remarkable number of triangle-like formations we have been seeing lately. While it is true that expected upward breaks have materialised, what has been glaringly different is that these patterns were NOT a prelude to a final wave up, but a part of larger, more complex continuation patterns. Frankly I was expecting the current upward thrust to be a terminal wave. So far that is NOT what I am seeing, but rather more sideways consolidation of the move up. It would indeed appear, unless we see a sharp cash session reversal, the bulls are not yet done.
I wish I knew more about EW counts, when the counts change, and when there may be 2 or more interpretations of patterns and counts. That’s what keeps me using OB and OS (oversold), with momentum and trend indicators, and see how it fits. I kinda get Peter T’s comments that if it is a corrective wave, it can’t just turn into an impulsive wave, but I find it hard to trade (guess if I get more time I should become a Gold member 🙂
That being said, with demographics and cycles turning down sometime between now and next year (Andy Pancholi, part of this site and others), I believe one of these up moves will fail miserably… maybe this one. I don’t how that fits (or doesn’t fit into EW, but I presume that means trade what you see until the waves play out. I guess what I’m saying is I (we?) have this big bag of systems, indicators, setups, and triggers we use, and continue to learn more about EW and how to use it. Thanks to Joe, Verne, Marie and others for your comments and methodology, and would appreciate any feedback or direction this takes you in your trading. Cheers!
Mojo…honestly the only to learn it and I am not an expert..is time and work..and a lot of reading good and bad about EW….and constant consistent charting and finding a good chartist who charts on the 5 min who you can use as a mentor..
so you can see the intricate detail of counting..and use it for day trading..
.Peter is excellent for the larger picture and intermediate…and guide..
the minute charting day to day is the hardest..always trying to look forward to what something can potential morf into..
with that you have to also chart its peers because the all work off each other then you can better see all the relationships to be able to predict off
indu, dollar, gold , tlt..examples..
You should read Elliot Wave Principle..as Peter has rec too..yes dry..however..
I started with that and memorized it..
I started by large charts monthly..then worked to daily 2 hour then 5 and 1 min
its a process..
.finding a good chartist on the one min..helps..not that they are always right..sometimes I see things they dont’t or visa versa..
But in the beginning, I used it to try to use the rules and chart..knowing I was making many mistakes then would go back and compare..and analyze and compare mine to theirs..I learned a lot that way..
Nothing is perfect.. Oscillators are used a lot….and when corrections happen it is very hard to sometimes see when the first impulse wave is beginning..and if anyone says something different they are lying… 😉
Thanxxx Marie, that is a lot of what I do. I appreciate your feedback.
Conflicted about holding remaining calls. Price action STILL looks like consolidation to me. This implies the initial reaction to FEDSPEAK will be a sharp decline followed by an equally sharp reversal. It truly is amazing how predictable this outcome always is. I reject the notion that people are this stupid and easily manipulated and think this kind of price action is due to the trading bots.
There are two events within the FOMC – one is the statement and another is Powell Q&A. The market can easily reverse direction between those two.
Charts already telling us how whipsaw likely to unfold…
Are seeing a death rattle?! Lol!
BTFD…
Ha!ha! You sure ’bout that?! 🙂
HHMMM… 🙂
Chart Show: I’ve had to cancel it for today, as I’m still having technical issues.
Peter
Bummer! 🙁
Let’s get ready to rumble…! 😀
Verne
Many years ago I was forced to look into the markets by using several different methods .
Each year I tested something new . I bought a few books and I went into it all
from a timing perspective .
The reason I say I was forced into this was because back then I found that many times the markets would do things that made no sense to me and I had been taken out to the wood shed as you would say far to many times .
I will admit that past mid august im not so sure what comes next .
There are only a few set ups that I rely on because there consistencies.
When im seeing a mixed picture I accept that maybe ill be right or wrong .
You mentioned your seeing many triangles of late , ill agree
im also seeing head and shoulders top formations in both larger and smaller degrees .
I cant say we are in the middle or latter stages of a larger head and shoulders top formation yet I tend to think we are .
The broadening top formation included .
Technically I still see bearish divergences .
Timing is the only thing I see as a reason to stay bullish .
To sum it up :
As this cycle continues I will take it for what its worth yet come mid august to early Sept I must consider selling a larger than normal portion of the stocks I own .
Ill let the market prove itself afterword’s
I am No die hard bull by any means
I’ve gotta hand it to you Joe.
Your calls on the forum have by far been the most spot on!
Don’t know how you do it, but that is quite immaterial! 🙂
Ill agree with peter T
Elliott wave theory is the only way to measure the market
That by itself though ( for me ) lacks timing .
So I try as best I can to include both with a bias towards timing first
and I do that by A Lot of research using cycles ( planetary timing as well as mathematical time counts )
Doji at prior overhead resistance. Looks like the banksters need more leverage to overcome. Do we gap past it…or do they give up the ghost??! Lol!
Fed easing in July is a done deal. History shows us that selling the rally after the first ease is the way to go. You sell the first ease and you buy the last ease. Pretty much sets up early to mid August as a potential top.
I maintain they will not ease until we have the first negative quarter GDP print.
If they do, I will happily concede your point regarding their no longer caring about their own survival! 🙂
This website is for educational purposes relating to Elliott Wave, natural cycles, and the Quantum Revolution (Great Awakening). I welcome questions or comments about any of these subjects. Due to a heavy schedule, I may not have the time to answer questions that relate to my area of expertise.
I reserve the right to remove any comment that is deemed negative, is unhelpful, or off-topic. Such comments may be removed.
Want to comment? You need to be logged in to comment. You can register here.