
 The Megaphone Pattern
Broadening tops are not an Elliott Wave pattern. The question I’ve been attempting to research this weekend is if we are going to have a wave up in three waves, or five waves.
My conclusion (because I’ve found examples of both), is that we’re likely to get an ABC wave up in the SP500. However, there may be a “corrective” fourth wave in ES while NQ completes a normal fourth wave.
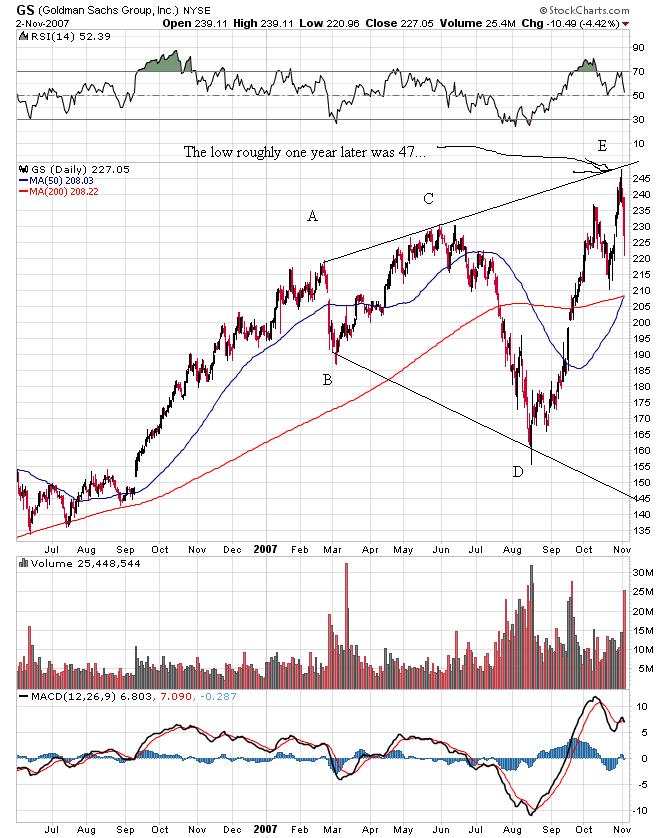
I don’t know for sure, but these charts may come in handy for you as you contemplate how to trade this extraordinary rally … the last one of these we’ll see for a while.
Broadening tops are extremely bearish and I expect this wave down after the top is one that will hit the headlines all over the world. Stay tuned.
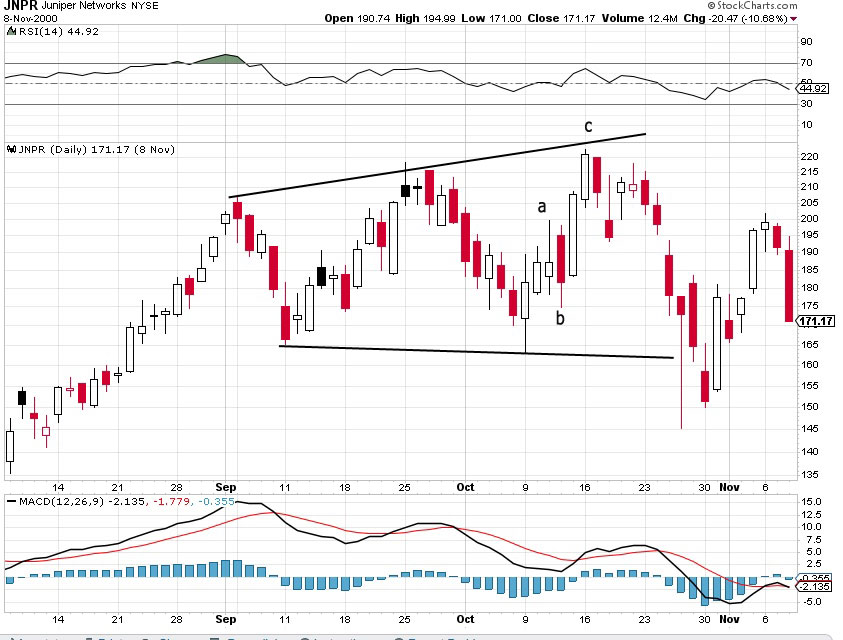
The broadening top here shows three waves up in the final wave, while the first example above shows five. We’ll have to see what happens.
_______________________________
Technical Challenges at Cycle Tops
One of the central themes of any cycle top, but particularly the 500 year cycle top, is the explosion of complexity within society.
You see it everywhere; it’s becoming extraordinarily obvious. Governments are so huge that nobody is in control; there are vast amounts of taxpayer money spent with no oversight. Teslas are exploding left and right, and of course, we’ve had a couple of 737 Maxes fall out of the air. That plane may never fly again.
You also see out-of-control complexity all across the internet, something I have to deal with everyday; it’s getting to the point where most of my time is just dealing with technology. It starts with the fact that web applications change every day, with little to no explanation. I have to learn new screens every week, because buttons move, or pages get re-designed, or pages just aren’t there anymore. But, it’s gets much worse.
The week before last was with Apple’s icloud technology. There’s hardly any understandable information out there on how this system works, but it’s like One Drive in Windows. It’s a file sharing and backup system.
This system stopped updating some of my applications (specifically my calendar) but I was forced to ignore it for almost two weeks. I was simply too busy to do the research on how to get around the problem of a full drive without just blindly paying more money to Apple to increase the size.
The issue was that my calendar had lost some of the dates for meetings I’d scheduled into July. I don’t knowing use the technology (it’s on by default) and so I was not going to pay more money for something I don’t use.
I contacted Apple, and after the first “techy” hung up on me, the second higher-end expert (I got upgraded to him during the call) ended up losing ALL my dates and leaving me with blank screens before quietly hanging up on me. It became obvious that his Apple representative had no training on how to work with a customer, as he didn’t explain anything he was doing (I had shared my computer with him online); he just did it.
After he left, it took me a couple of hours to figure out how to get most of it back.
Next came trying to fix two WordPress websites that members of my favourite professional speaking organization had almost destroyed. After spending an entire night (yes, around the clock) trying to fix it (I fixed most of it), I’ve turned it over to the developer of one of the plugins to try to finish the final “fix.” That one’s in the works.
There isn’t the knowledge out there amongst the general public to be able to use any of this technology properly. People are destroying website due to lack of knowledge (and apparently no desire to learn).
And now this week, where I find that NVidia, a company that provides display drivers for Apple computers is having some kind of war with Apple. On May 15, their drivers got updated on Macs (without anyone really being aware) and now my cursor doesn’t show up in the live webinars I do on Wednesdays.
It took me 12 hours on Saturday to finally get to what the real problem is, because this information is out there, but it’s incredibly difficult to find. At the point I discovered the display problem, I’d spend eight hours testing just about everything else.
So, I still have to come up with an alternative to this for Wednesday, which may mean rolling back to another computer with an earlier system on it. One way or the other, I’ll figure it out (without wasting my time with “tech advisors” — a complete waste of time).
That’s why this blog post is down to the wire this weekend.
This technology “stuff” just doesn’t end. The next task for me is to find out why, when I make a currency trade, the chart for that currency goes blank. That’s on Windows. It isn’t just Apple that’s having problems; it seems to be right across the board.
So, I’m starting to think about how to simplify things going forward, because I think we’re seeing just the start of these kinds of issues. Just keeping my website ticking along is a full time job and is robbing me of my ability to do just about anything else.
More to come …
__________________________________
NYSE Update
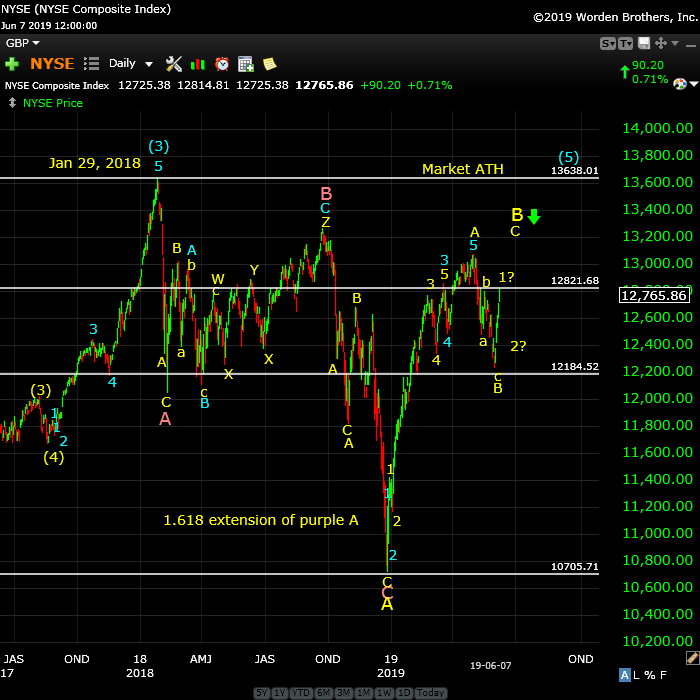
Above is the daily chart of the NYSE showing the large ABC fourth wave that we’ve been in since the top of blue circle 3 on January 29, 2018.
The most recent wave up from Dec. 26, 2019 is corrective but I’ve numbered it in five waves (they don’t follow the impulsive wave rules, so they’re corrective). I’ve re-labelled the first portion of this A wave up as a 1-2,1-2 pattern, resulting in a 3-4, 3-4 pattern at the top of the yellow A wave (slightly above 13,200).
This weekend, we have a B wave down complete (the white line at 12,184.52 is the 38% retrace level), and we’ve begun the predicted bounce. Normally, I would expect 5 waves up in this subwave, but I’m not sure we’ll get it, with the corrective wave that’s possible in SPX. A top will result in a very deep wave down to a new low below 10,700.
Possible timing: I’m now expecting a high somewhere in June now (the market is moving quickly now), with perhaps our big drop beginning then and lasting through early September (my dates here are speculative).
As I often say,
“Trade what you see, not what you think.”
___________________________
Elliott Wave Basics
Here is a page dedicated to a relatively basic description of the Elliott Wave Principle. You’ll also find a link to the book by Bob Prechter and A. J. Frost.
____________________________
Registration for Commenting
Want to comment? You need to be logged in to comment. You can register here.
If you register, it protects your information. It also allows you to comment without filling in your information each time. Once you’re registered, simply go to the home page and click on the login link top right in order to log yourself in. Usually, you’ll be logged in for several days before needing to be logged in again.
______________________________
Problem receiving blog comment emails? Try whitelisting the address. More info.
______________________________
the real deal SM 2
The real deal …‘Educational, insightful and thorough market analysis for all levels of traders. It’s Elliott Wave at its best….Peter Temple is the real deal’ —SM |
A true expert in Elliott Wave FL 2
A true expert in Elliott Wave …You are a true expert in EW analysis. What you provide is not available anywhere and is priceless. Subscription on your services is the best thing I have ever done. Many thanks for your effort to make me a better investor. I now have more trust in my investment decisions. I hope you will continue the excellent work! —FL |
Tops in your field DZ 2
Tops in your field …You are tops in your field. Tried to follow Elliot Wave international for years. They were always behind the market. After discovering you, I perceive that you are an expert in reading the waves, which puts you way ahead of the rest of your peers. And you can read the Waves like you are reading tomorrow’s financial section. I pray you stay healthy. —DZ |
Get an upper hand … JC 2
Get an upper hand in trading …Seeing all the different currency pairs and the wave structures and hearing you explain why this has to do that on a nightly bases gives one a upper hand when trading. Elliott Wave applies to all stock and indices and can be applied to any candlestick chart. If someone ask what you want for Christmas – Tell them a membership to Peter’s “Traders Gold!”—JC |
The best of them JL 2
The best of them …Last couple of years, I subscribed to several ‘market traders’. You are by far the best of them and the personal contact is awesome. Daily and daily updates are very well written! Besides your expertise in EW, I also like your cycles analysis. Best investment I ever made! —JL |
Rise above the rest … SM 2
Rise above the rest …I have only ever met a few people who, in their chosen fields (astrology, medicine, music, martial arts, technical analysis), rise above all the rest and you are one of them…you have ‘the gift’…and that’s why I’m a Trader’s Gold member. —SM |
Have not had a losing week RW 2
Have not had a losing week …I have been with Peter almost a year. The only thing that matters is have I made money with his service. I think I have finally turned the corner using Peter’s EW. I have not had a losing week in the last 5 months. Thanks Peter, for your amazing amount of hard work. —RW |
Couldn’t be happier … KK 2
Couldn’t be happier …The analysis and insight you provide is simply amazing! I’ve been trading the futures and equity markets for well over thirty years and usually average around 5% monthly. Since joining your Traders Gold Service two months ago, that number has better than doubled. I couldn’t be happier.—KK |
US Market Snapshot (based on end-of-week wave structure)
This chart is posted to provide a prediction of future market direction. DO NOT trade based upon the information presented here (certainly NOT from a daily chart).
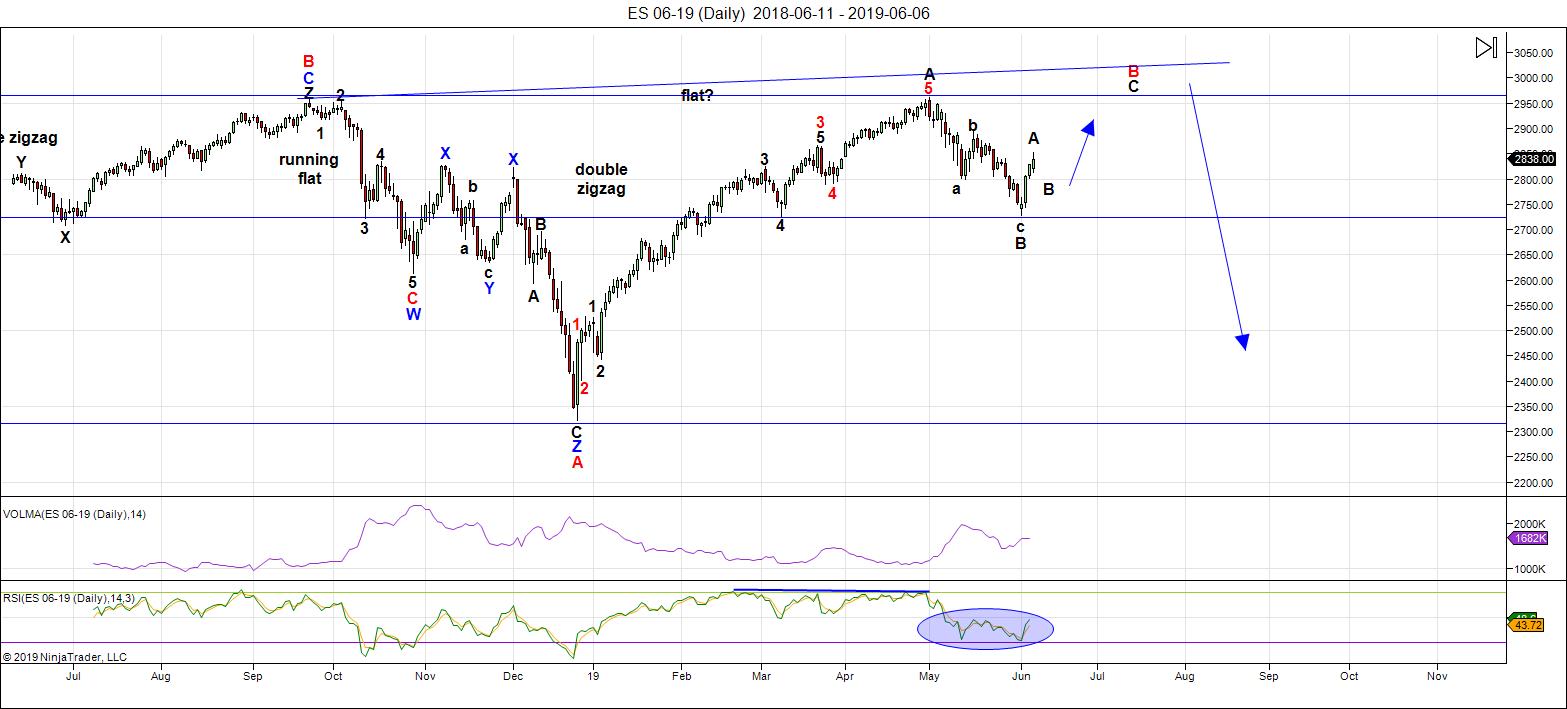
Above is the daily chart of ES (click to enlarge, as with any of my charts).
As predicted last weekend, we bottomed and rallied strongly the remainder of the week. While I expect weakness this weekend, more rally will follow.
It's important to remember that we appear to be in a broadening top and so the expectation is for a corrective wave to a new high, but not above the upper trendline. Then down, down, down in possibly the C wave of an expanded flat (there are other possible patterns, but this seems the most probable at the present time.
As I've been saying for some time, after we reach the final high, we'll see a turn to the downside with a major move to a new low under 2100.
It's impossible to successfully analyze this market without taking into account the movement of a number of related asset classes. The market has gradually been aligning across these asset classes and now virtually everything si moving more or less in "lock-step." When you trace out a major top, all major indices have to top at the same time. This 500 year topping process will include many international exchanges.
Summary: Expect the bounce to continue to a new high to complete this large, corrective "B wave" up from the Dec. 26 low. That will result in a very large ABC corrective wave, which must fully retrace to a new low.
Once we reach the high, I'm looking for a dramatic drop in a 4th wave to a new low. The culmination of this drop should mark the bottom of a large fourth wave in progress in the NYSE since January 29, 2018 - a year and a half of Hell. ES will eventually target the previous fourth wave area somewhere under 2100.
Once we've completed the fourth wave down, we'll have a long climb to a final new high in a fifth wave.
___________________________
Trader's Gold Subscribers get a comprehensive view of the market, including hourly (and even smaller timeframes, when appropriate) on a daily basis. They also receive updates through the comments area. I provide only the daily timeframe for the free blog, as a "snapshot" of where the market currently trades and the next move on a weekly basis.
______________________________________
Sign up for: The Chart Show
Next Date: Wednesday, June 19 at 5:00 pm EST (US market time)

The Chart Show is a one hour webinar in which Peter Temple provides the Elliott Wave analysis in real time for the US market, gold, silver, oil, major USD currency pairs, and more. You won't find a more accurate or comprehensive market prediction anywhere for this price.
Get caught up on the market from an Elliott Wave perspective. There’ll be a Q&A session during and at the end of the webinar and the possibility (depending on time) of taking requests.
For more information and to sign up, click here.
| "I think you are the only Elliot Wave technician on the planet who knows what he's doing.” |
| m.d. (professional trader) |
All registrants will receive the video playback of the webinar, so even if you miss it, you’ll be sent the full video replay within about an hour of its conclusion.


The year 2000 Top
Many will call the 2009 the important low and ill agree
but what about a cycle low ??
The year 2011 was a benner business cycle low
how ever :
March 24 2000 was the high in the spx and Nasdaq
There also a secondary high in the spx and Nasdaq on Sept 1 2000
The NYA put in its final all time high back then on Sept 1 2000
Taking both the March 24 2000 top
including the secondary high on Sept 1 2000 in the NYA
You can label both time periods as very important highs .
March 24 2000 Plus 12 years 8 months = Nov 24 2012
Sept 1 2000 Plus 12 years 3 months = Dec 1 2012
https://www.timeanddate.com/date/dateadded.html?m1=3&d1=24&y1=2000&type=add&ay=12&am=8&aw=&ad=&rec=
—
https://www.timeanddate.com/date/dateadded.html?m1=9&d1=1&y1=2000&type=add&ay=12&am=3&aw=&ad=&rec=
——
The dow peaked on Jan 14 2000
Doing the same 12 yrs 3 month to 12 years 8 months addition you get the date range of
April 12 2012 To Sept 14 2012 .
This leaves a total Range of April 12 2012 To Dec 1 2012 for an important low in
terms of time ( using just this Lindsay time count )
Including the april 12 date into this we were left with a 234 time frame for an important bottom .
89 a fib number plus 144 a fib number adds up to 233.
Taking the Mid point of this time frame of 234 you come up with a Date
for the Mid point in time of : 117 calendar days
April 12 2012 Plus 117 days ( or Dec 1 2012 minus 117 ) you come
up with a date of : August 6 2012 – August 7 2012 .
Its Just an approximation is all yet it is a time count for where to expect a low .
We also had an election in Nov 2012 so that plays into it later .
The actual Low in the cash dow in the year 2012 came on
June 1 2012 and the secondary low was on Nov 16 2012 .
Note : Both these lows fell with in the total time range of
April 12 2012- Dec 1 2012 time frame .
So based on this count how long has this bull market really been going on ?
im talking time and cycles not so much price in this outline .
June 1 2012 to date is 7 years 13 days or 84 months and 13 days
which is also a total of 2569 days .
nov 16 2012 to date = 6 yrs 6 months and 29 days or 78 months and 29 days
which is also 2401 days .
More to follow on another day yet its worth thinking about if you can manage to think outside the box .
5 is a fib number
50 is 10 times 5
50 times 50 is 2500
61.8 * 61.8 = 3819.24
June 1 2012 plus 2500 = April 6 2019 ( a high was on April 5, Just pointing it out )
Nov 16 2012 plus 2500 = Sept 21 2019 <— ( not sure what to make of this today )
March 6 2009 plus 3820 ( rounded out ) =Aug 21 2019
March 9 2009 plus 3820 = Aug 24 2019 .
My only concern to my Mid Aug high has to do with the planet venus conjunct the sun ( that is where the high is considered )
Superior Conjunction Is Exact 14 Aug 2019 2:07:15 am EDT .
——-
http://www.nakedeyeplanets.com/venus.htm
Venus enters Leo, the Lion, on August 11th, reaching superior conjunction (passing behind the Sun as seen from the Earth) in the Western part of that constellation on August 14th. At the moment of conjunction the planet is positioned 1°.3 North of the Sun. Venus is now at a very distant 1.7312 AU (258.9 million kms or 160.9 million statute miles) from the Earth. Were it to be visible from the Earth at this point, Venus would have an apparent diameter of just 9".6 and would shine at magnitude -3.9.
Having passed from the morning to the evening sky, Venus remains out of view – lost in the solar glare – for a further three weeks, as it makes its slow passage on the far side of its orbit from the Earth. The planet becomes visible once again from around early September 2019, when it is seen from Equatorial latitudes as an 'Evening Star' in the Western sky shortly after sunset. This heralds the start of the 2019-20 evening apparition of Venus, which will last through to May 2020.
My Take . Note that When venus becomes the evening star , that is when the venus bear should be in effect .
So the venus bull market ends in mid august and the venus bear market begins in mid august yet that early sept time frame is when we should see an acceleration lower . ( its going to matter because we will still be in a mars Uranus bullish cycle until jan 2020 )
These work best when both are in bullish or bearish mode .
More work to do on this using my own data vs what I pulled off the web .
I use the web at times as a way to check my own work just in case I have made any errors .
The reason for the fib counts even if outside the box was to attempt to put as many aspects in terms of timing together and to find that point where as much of everything I have used in the past all lines up .
I realize that most people will not really understand any of this and will not
actually do any research to verify the history of these cycles yet I have
and I post this only for my own research mainly .
This was just for me for the most part and it was a bit of research in order to grasp a few things as we move forward .
enjoy the weekend
The cash dow today closed above 26065 which is a bullish sign
a close above 26065 on a weekly basis is now need to confirm .
a high is due near july 2 so I remain bullish
🙂
The defense of the 26K DJIA level is anything but organic. It appears to me to be clearly a contrived artifact of CB cash infusion to maintain the optics of price holding above that level as the weight of the overbought market keeps knocking on that door. I do not think it will hold. Just my two cents based on my analysis of how bankster buying drives market price in this environment.
21 + 34 = 55 which is also a Fibonacci number
55 * 55 = 3025
that is another time count to consider yet at this point on finished with brain storming for the day .
This is all about trying to nail the actual top to the day in ADVANCE .
we should consider time in as many methods as possible yet as we get closer to the top Fibonacci is going to confirm that date .
Is always has so I see no reason to expect it not to this time around .
The planet Venus ends up in almost its exact same position every 8 years .
how it lines up with other planets is a different story .
2019 minus 8 is 2011 minus another 8 years is 2003 then 1995 and then 1987
according to chris carolan who write the spiral calendar there is also a 58 year cycle
which ties 1871 to 1929 to 1987 the next being the year 2045 being very strict .
im not looking out that far at this point .
29 years would be the half cycle .
1987 plus 29 = 2016 and we are past that date so there is something else going on yet to me it means we are in a Smaller Cycle ( a sub cycle ) which is most likely a shock .
I cant prove this today but its where im going with all of this
conclusion :
im seeing ties to both 1929 and 1987 today as well as other things .
Peter T has been explaining the wave count and has been doing an excellent job
navigating this market .
Everything is coming together and im trying to narrow down the timing .
call it crazy or impossible but I do not believe the market move randomly .
The rally off of the June 3 cycle low has been Obvious .
That was a confirmation that the market is doing what it should do .
The out come therefore should be Bearish .
Elliott Wave Theory will confirm that No Doubt in my mind .
May 2 2011 Plus 3025 calendar days ( fib 55 * 55 ) equals = aug 13 2019
Just brain storming here mind you before I leave .
Jan 14 2000 ( cash dow high ) to today is 7090 days
which is also 19 years 4 months and 30 days .
This is also :
232 months and 30 days .
we are now officially 233 ( Fibonacci ) months past the jan 14 2000 cash dow top
Oct 4 1974 a low momentum low , To date has been 44 yrs 8 months and 10 days
and a total of 16324 days which has a sq rt of 127.76
Dec 9 1974 print low o date has been a total of 44 yrs 6 months and 5 days
and a total of 16258 days which has a sq rt of 127.50
The lows were 573.22 and 570.01 .
I see nothing in any of this at this point so im finished .
thank you peter T for allowing me this space
This particular FOMC is of significance. June 19 at 2:00 PM. I expect significant realized volatility around that timeframe. If the Fed sticks to its previous playbook, the market will have the ammo it needs to break above 2900-2910 resistance zone. Between now and then are 3.5 trading days. I was expecting a move down to 2842 or 2819 (38% or 50% retrace). But it seems to have stalled at 23% retrace. It is difficult to predict what a human being will say in front of journalists, but rest assured that the market is waiting for him to give the green light.
I agree Vivek, but prelims for 3rd quarter show growth and inflation slowing on rate of change basis in Q3. Everyone (kinda) is talking about it now (kinda), Hedgeye announced it end Q3 2018. Maybe it will be baked in by then, but (the other half) of your drop could easily be revealed in next 3-6 weeks. This will drive EW or EW will drive data being acknowledged (kind) by “markets.” Maybe QE juice from Fed diverts it all; just think we have to have a plan, control risk, trade what we see not what we think. His green light might be the next red light.
I agree it will be significant but not in the way most people expect.
It really is amazing to see a 75% chance of a rate cut priced into this market.
The FED may be crazy. But they are NOT stupid. The know they will need at least 500 basis points to deal with a recession.
We know where they are currently. It demonstrates just how irrational the investing public has become in that they are seriously expecting a rate cut at this point in the cycle, in the absence of an officially declared downturn.
It is therefore very possible that the ensuing disappointment after the next FED meeting just might be the catalyst that results in the next market tantrum. Interesting times!
updated energy chart
https://imgshare.io/image/june-10-th-june-14th-energy-chart-motop-revised.51bJ8
note: since this week was completely inverted next week may not be
Hi Tom, so tomorrow’s chart (14th) got adjusted accordingly? And it is interesting that there’s a blank in the early morning tomorrow.
TIA!
Looking at the S&P500 through the prism of the Puetz eclipse cycle, the S&P 500 topped 1 May – a few days before the 2nd NM before the SE so while this is not in line with the idealised cycle, it is still within the parameters of the Puetz eclipse cycle being 3rd most likely outcome. It will be interesting to see whether the rally extends into the next FM and then turns down per the usual topping process of 6 weeks, or whether the topping process takes 10 weeks in total which is another variation on the idealised cycle. Unfortunately I do not keep track of geomagnestism numbers, which would yield some light on whether the current price action is merely a coincidence or whether in fact the eclipse cycle is exerting some influence.
Thanx Tom..nice dip down…and looks like won’t invert this am ;))…
I agree with you Vivek..probably will be the initial reaction,,will be up if cut or same..I think people are programmed in their brain for that right now.. ..however I think there will be that aha..moment where traders are going to realize that hmm..this is not good who knows when it will come but it will come…the only thing I know is we have to be flexible
Yeh, earning are slowing on a rate of change basis, different inflation gauges show steady or slowing (quad3 or quad4?), so the favored sectors and factors keep changing with large variance in return or lose. This is the toughest environment to trade, as Peter T has commented on with wave 4. This last wave up has been best for the Q4 18 losers (tech, semis, RUT,high VOL), but the winners since 9/18 top have been UTIL, treasuries, REITs (all do well in quad4) and are least slippery in EW wave 4. Marie, this is my way of looking at the upcoming change in Fed perception, FWIW.
And makes it hard to short factors like tech, semis like TECS, SQQQ but I am chumming the waters…
Wheat is another one to be watching…
in the spirit of not naming possible trades.. :0
I don’t know if any of you do..but I also chart the BPSPX..on weekly daily ..
it also a great tool for catching the breaks..but you def have to be careful with it like anything used with other things..
http://schrts.co/FDqfPzPR sine wave chart…thicker lines are the stronger waves..
green money
blue spx
redy yen
gold gold
more a chart made out of curiosity..but interesting..
I know for some this will look like garble gook..
I started looking at eclipses and tops, just to form my own opinion on those. These are just some historical events. I end up putting my own EW labels. I have to say I am surprised by how much effect Moon phase and eclipses have had on the market. Take it for whats it worth.
Jan 6 : New Moon
Jan 20 : Full Moon
Jan 20-21 Lunar Eclipse
Feb 5 : New Moon
Feb 5 : Solar Eclipse
Feb 18 : Full Moon
Mar 6 : New Moon
Mar 20 : Full Moon
Jan 1 : 4th wave correction starts. SPX drops 10% in a double zig-zag
Feb 28 : Bottom of wave 4
Mar 24 : SPX rallies 17% in wave 5. The market tops 4 days after the Full moon.
June 16 : Full Moon
July 1 : New Moon
July 16 : Lunar eclipse, Full Moon
July 31 : Solar eclipse, New Moon
Aug 15 : Full Moon
Aug 29 : New Moon
Apr 14 : 1st wave down ends. SPX has started a second wave correction higher which plays out as a triple zig zag. The 2nd wave is a 14% rally from the lows.
June 19 : Top of wave A of (Y) [Monday after Full Moon]
July 31 : Bottom of wave X [Solar eclipse, New Moon]
Aug 31 : Top of wave 2 [2 days after New Moon]
In both these cases, the market volatility was high and the top came in about one month AFTER the solar eclipse. The solar eclipse this year is on July 2nd. Lets see if we get Peter T’s wave 5 rally into that one month period after the Solar eclipse. Fed meeting is on July 31 (thats when they are expected to cut). Historically speaking, you sell the market about one week after the first rate cut. That time frame nicely lines up with eclipse cycle, Peter T’s EW count AND Joe’s expectation for an August top. Lets see how Mr Market wants to play it.
For the above dates, those are from Year 2000. Should have mentioned within the comments.
watching a huge divergence on Dust PPO..2 hour
however, gold did just break the 2016 trend line…but within the 2018 trend line… with a slight divergence..
I think we are in for sideways til next week..:((
Enjoy the weekend everyone!..going to go enjoy this beautiful day today here in the North East..
Vivek
Nice work !
Dan Goulding – Im not convinced the Fed cut rates
I re worked my dow charts to reflect the changes in the weightings
dwdp has changed to Dow .
it appears they are in sync to some degree .
no thoughts on the market other than that .
FYI – As per 3 day forecast there is a huge opportunity to go long on monday early morning and ramp all day.
https://www.swpc.noaa.gov/products/3-day-forecast
Hey Joe, I am not sure the Fed will cut either as they have proven themselves to be far behind the curve as best and grossly incompetent at worst. There are trillions of dollars bet on rate cuts; if the Fed refuse to cut then we will see something like November/December play out where the market had assumed the Fed would cease their hiking campaign and when the Fed said no, there was a big selloff. If you tease apart all the threads of the market back in October it was set to rally in a big way, but then the Fed opened the trap doors which was why it really sold off as the market was positioned the wrong way. Just my two cents.
In terms of an interest rate cuts, I am not sure one can characterize the market’s expectation of multiple rate cuts as irrational. There are trillions of dollars bet on that outcome – so it is not your mum and dad investors making those bets but your big investment banks who work at the coal face and- they obviously see some serious issues in terms of liquidity. And those bets started one year ago, well before trade wars became an issue. Perhaps it is a non-event but when funding markets are indicating serious issues, I tend to pay attention to those with some rather serious skin in the game rather than a group of people who are not accountable to anyone and whose track record speaks for itself
My statement of a 75% expectation of a rate cut is incorrect. That is actually the expectation that FED will HOLD. The expectation of a rate cut is 25%. Bloomberg is reporting that the “smart money”, namely, the banks, expect June to see the FED stand pat. Anyone commiting “trillions” to a rate cut in, June specifically, is likely to loose that bet, imho.
It is irrational because it assumes the FED is suicidal. They may be incompetent, but they are certainly not suicidal. We know from past history that it is quite rare to see the FED ease AHEAD of at least one quarter of negative GDP growth. They are generally behind the curve, as we all know well.
In my opinion the fate of most market participants has already been decided. The greatest transfer of wealth in history has ALREADY ocurred. The folk holding corporate bonds issued to repurchase shares, as well as those holding the inflated equities will learn this in the not-too-distant future…not what I would consider arbiters of market outcomes…
Unfortunately, it’s not “anyone” but the market pricing in interest rate cuts. I would suggest one look at what the bank’s traders are doing rather than what the bank’s economists are predicting. The last 13 years have been pretty telling on that front in my opinion. Yes, the Fed want to normalise interest rates, but it would be irrational for them not to cut when the market is telling them that downside risks are significant.
What you call “market pricing”, just might turn out to be “mal-investment”. It would certainly not be the first time. Getting caught on the wrong side of reality is nothing new for that cohort. We shall have our answer next Wednesday…
I find the widely varying opinions among so many in the EW community quite interesting.
I will be the first to admit I have never been able to use the method consistently as an active trader.
While it does appear to me the approach can give a good idea of where the market is headed, it is quite clear to me that trying to derive actionable information about when it will get there is a fool’s errand. Believe me, I have tried!
There are increasingly more analysts willing to consider a short and mid-term bullish case, some even offering impulsive counts. I will leave that debate to the experts.
What I see is a relentless defense of specific market levels by massive cash infusions every time price descends below those levels. Not sure how this kind of behaviour affects wave development, but I do know what I am seeing.
The result is an extended sideways consolidation of price, entered in an uptrend.
History suggests to me that this is bullish, and no surprise…the banksters are buying…!
A new weekend blog post is live at: https://worldcyclesinstitute.com/reaching-for-the-top/
This website is for educational purposes relating to Elliott Wave, natural cycles, and the Quantum Revolution (Great Awakening). I welcome questions or comments about any of these subjects. Due to a heavy schedule, I may not have the time to answer questions that relate to my area of expertise.
I reserve the right to remove any comment that is deemed negative, is unhelpful, or off-topic. Such comments may be removed.
Want to comment? You need to be logged in to comment. You can register here.