
 Drilling Down Into the Sub-Waves
It appears few commenters in the free blog care much about Elliott Wave, but we keep rolling along in the Trader’s Gold area reading the wave and staying aligned with the moves in the market.
I called the current wave to the downside corrective right at the top, and of course, corrective waves don’t change their tune part-way down.
This week coming, I’m expecting a turn and then a rise on the way to a new high in US indices. This after a number of pattern failures (ending diagonals in all the major indices failed one by one over a period of a couple of weeks).
We’re left with a corrective fourth wave that looks like it will retrace to the 38% level before it will finally turn up in the long awaited C wave to a new high.
Fourth waves are the most difficult of all the Elliott Wave patterns to trade. I generally don’t trade them, but this one (in the NYSE) has now lasted almost a year and a half. So, you’re damned if you do, damned if you don’t.
On top of the challenge of trying to predict fourth wave patterns is the fact that, in this particular case, we have a huge non-confirmation within the major US indices. The bigger picture is that while the NYSE is clearly in an ABC fourth wave (not complete to the downside), the DOW and SP500 are in third waves (right near the top) and still have to drop into their fourth waves.
That said, there seemed to be so much confusion out there as to the nature of this latest B wave down from 2960 in ES, that I put together a short video for my Trader’s Gold folks last week. It shows what I look for in terms of classifying a wave as corrective, taking this current wave down as an example.
Analysis of ES Corrective Wave Down
Corrective Wave Analysis  |
 |
Make sure you zoom the video to full size with frame expander (arrows) in the bottom right hand corner and also set the quality to as high as your web connection allows. This is a high definition (HD) quality video so the best viewing is at that level. |
Above is a video of the 60 minute chart of ES. There’s a lot of chatter out there as to which way the market’s going next and so I decided I would create a video showing what I look for in a wave down to determine if it’s impulsive or corrective. Hopefully, you’ll find this useful as you learn more about how the market moves. It’s important to be able to determine whether a wave is corrective, or not, to know whether to trade it (if at all), when it might turn, where it will go when it does.
_______________________________
NYSE Update
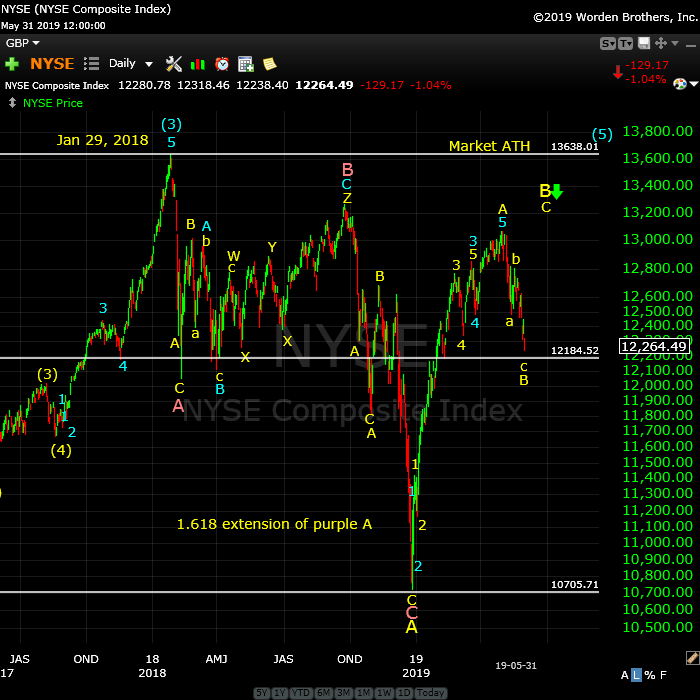
Above is the daily chart of the NYSE showing the large ABC fourth wave that we’ve been in since the top of blue circle 3 on January 29, 2018.
The most recent wave up from Dec. 26, 2019 is corrective but I’ve numbered it in five waves (they don’t follow the impulsive wave rules, so they’re corrective). I’ve re-labelled the first portion of this A wave up as a 1-2,1-2 pattern, resulting in a 3-4, 3-4 pattern at the top of the yellow A wave (slightly above 13000).
This weekend, we have a B wave down almost complete (the white line at 12,184.52 is the 38% retrace level, which is likely the turning point to the upside), and we’re looking for a bounce into a C wave up to the previous high (slightly above 13000). A top there will result in a turn down for a continuation of this fourth wave.
Possible timing: I’m now expecting a high somewhere in July, with perhaps our big drop beginning then and lasting through early September (my dates here are speculative). This is a change in thinking about the timing, due to the fact that we’re entering the summer season, which promises an even lower volume market than we’ve been seeing.
As I often say,
“Trade what you see, not what you think.”
___________________________
Elliott Wave Basics
Here is a page dedicated to a relatively basic description of the Elliott Wave Principle. You’ll also find a link to the book by Bob Prechter and A. J. Frost.
____________________________
Registration for Commenting
Want to comment? You need to be logged in to comment. You can register here.
If you register, it protects your information. It also allows you to comment without filling in your information each time. Once you’re registered, simply go to the home page and click on the login link top right in order to log yourself in. Usually, you’ll be logged in for several days before needing to be logged in again.
______________________________
Problem receiving blog comment emails? Try whitelisting the address. More info.
______________________________
Have not had a losing week RW 2
Have not had a losing week …I have been with Peter almost a year. The only thing that matters is have I made money with his service. I think I have finally turned the corner using Peter’s EW. I have not had a losing week in the last 5 months. Thanks Peter, for your amazing amount of hard work. —RW |
The best of them JL 2
The best of them …Last couple of years, I subscribed to several ‘market traders’. You are by far the best of them and the personal contact is awesome. Daily and daily updates are very well written! Besides your expertise in EW, I also like your cycles analysis. Best investment I ever made! —JL |
the real deal SM 2
The real deal …‘Educational, insightful and thorough market analysis for all levels of traders. It’s Elliott Wave at its best….Peter Temple is the real deal’ —SM |
Rise above the rest … SM 2
Rise above the rest …I have only ever met a few people who, in their chosen fields (astrology, medicine, music, martial arts, technical analysis), rise above all the rest and you are one of them…you have ‘the gift’…and that’s why I’m a Trader’s Gold member. —SM |
Couldn’t be happier … KK 2
Couldn’t be happier …The analysis and insight you provide is simply amazing! I’ve been trading the futures and equity markets for well over thirty years and usually average around 5% monthly. Since joining your Traders Gold Service two months ago, that number has better than doubled. I couldn’t be happier.—KK |
Get an upper hand … JC 2
Get an upper hand in trading …Seeing all the different currency pairs and the wave structures and hearing you explain why this has to do that on a nightly bases gives one a upper hand when trading. Elliott Wave applies to all stock and indices and can be applied to any candlestick chart. If someone ask what you want for Christmas – Tell them a membership to Peter’s “Traders Gold!”—JC |
Tops in your field DZ 2
Tops in your field …You are tops in your field. Tried to follow Elliot Wave international for years. They were always behind the market. After discovering you, I perceive that you are an expert in reading the waves, which puts you way ahead of the rest of your peers. And you can read the Waves like you are reading tomorrow’s financial section. I pray you stay healthy. —DZ |
A true expert in Elliott Wave FL 2
A true expert in Elliott Wave …You are a true expert in EW analysis. What you provide is not available anywhere and is priceless. Subscription on your services is the best thing I have ever done. Many thanks for your effort to make me a better investor. I now have more trust in my investment decisions. I hope you will continue the excellent work! —FL |
US Market Snapshot (based on end-of-week wave structure)
This chart is posted to provide a prediction of future market direction. DO NOT trade based upon the information presented here (certainly NOT from a daily chart).
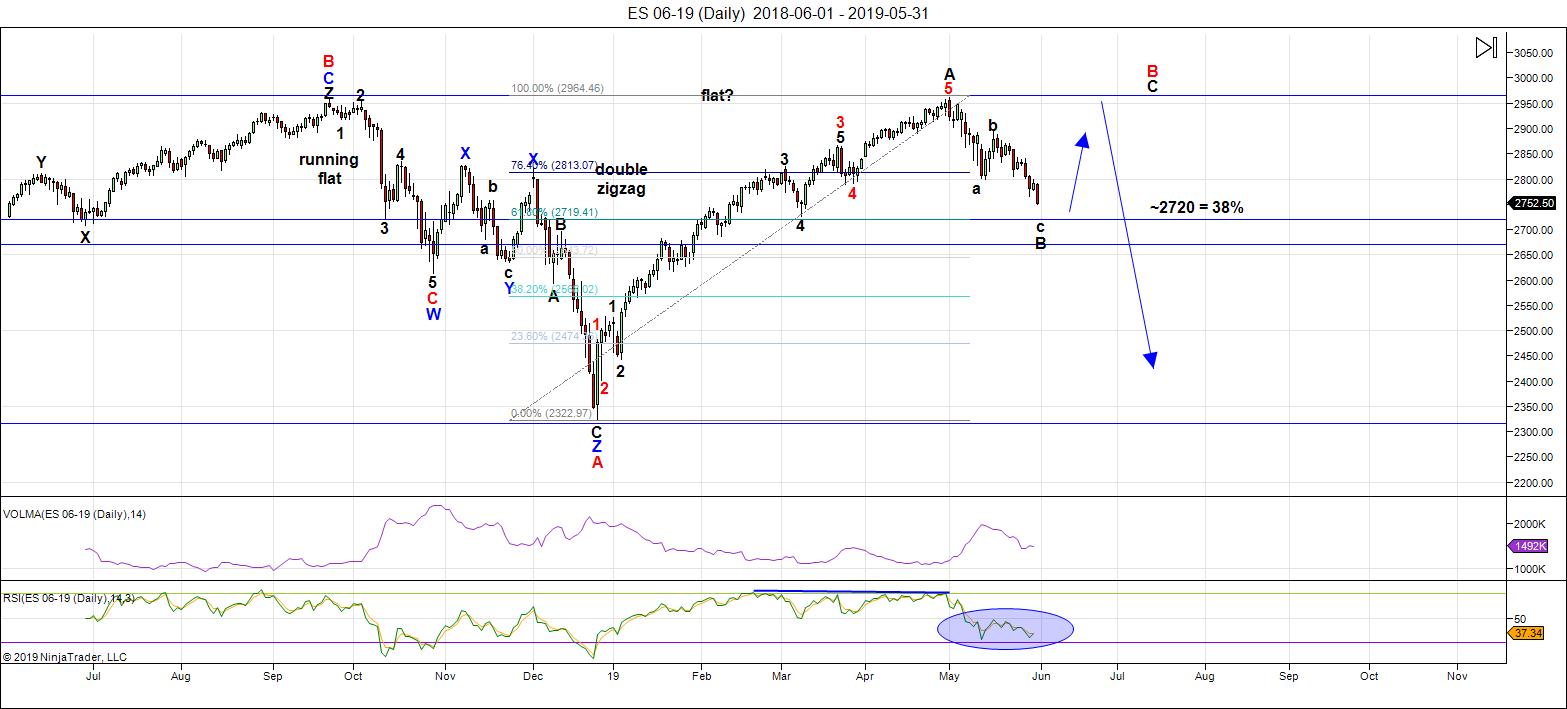
Above is the daily chart of ES (click to enlarge, as with any of my charts).
Last weekend, I suggested we might see more weakness in the US indices, as we wait for the larger C wave bounce, and that's what we've seen. However, the bounce is nearby and we may see a bottom early in the coming week.
One by one, the ending diagonals that had formed in almost all the US indices broke down. Because the wave up from Dec. 26 is corrective, there's no requirement for the B wave we're near the bottom of now to retrace to the usual 38% level, but that appears to be where we're going (possibly due to the requirement in the Nasdaq to hit the 38% level, as it's waves are impulsive). I expect more weakness over this weekend.
Fourth waves are the most difficult waves to trade of all the Elliott wave patterns, but clarity is now returning and we have to more certain moves ahead of us, not just in the US indices, but in other asset classes, as well.
The projected turn area (the C wave bounce) is identified on the daily chart at around 2720 or so (38% retrace level). Elliott wave guidelines for entry after a turn up is to wait for a first wave up in five waves to the area of the previous fourth of one lesser degree, and then a three wave retrace to around the 62% retrace level. That would be the high probability entry. You would enter there, or to reduce risk further, wait for a new high above the high of the first wave.
As I've been saying for some time, after we reach the final high (which should not be much above the current high), we'll see a turn to the downside with a major move to a new low under 2100.
It's impossible to successfully analyze this market without taking into account the movement of a number of related asset classes. The market has gradually been aligning across these asset classes and now virtually everything is moving more or less in "lock-step." When you trace out a major top, all major indices have to top at the same time. This 500 year topping process will include many international exchanges.
Summary: Expect a bounce to a new high to complete this large, corrective "B wave" up from the Dec. 26 low. That will result in a very large ABC corrective wave, which must fully retrace to a new low.
Once we reach a new high, I'm looking for a dramatic drop in a 4th wave to a new low. The culmination of this drop should mark the bottom of a large fourth wave in progress in the NYSE since January 29, 2018 - a year and a half of Hell. ES will eventually target the previous fourth wave area somewhere under 2100.
Once we've completed the fourth wave down, we'll have a long climb to a final new high in a fifth wave.
___________________________
Trader's Gold Subscribers get a comprehensive view of the market, including hourly (and even smaller timeframes, when appropriate) on a daily basis. They also receive updates through the comments area. I provide only the daily timeframe for the free blog, as a "snapshot" of where the market currently trades and the next move on a weekly basis.
______________________________________
Sign up for: The Chart Show
Next Date: Wednesday, June 12 at 5:00 pm EST (US market time)

The Chart Show is a one hour webinar in which Peter Temple provides the Elliott Wave analysis in real time for the US market, gold, silver, oil, major USD currency pairs, and more. You won't find a more accurate or comprehensive market prediction anywhere for this price.
Get caught up on the market from an Elliott Wave perspective. There’ll be a Q&A session during and at the end of the webinar and the possibility (depending on time) of taking requests.
For more information and to sign up, click here.
| "I think you are the only Elliot Wave technician on the planet who knows what he's doing.” |
| m.d. (professional trader) |
All registrants will receive the video playback of the webinar, so even if you miss it, you’ll be sent the full video replay within about an hour of its conclusion.


Interesting to see $MMTH average still dropping
https://www.barchart.com/stocks/quotes/$MMTH/technical-chart?plot=BAR&volume=0&data=WO&density=X&pricesOn=1&asPctChange=0&logscale=0&sym=$MMTH&grid=1&height=500&studyheight=100
Peter,
Without questioning your vision for new highs in coming weeks, I respect your analysis, we could eventually see “ghots firms” starting to be in trouble and loosing lots of money (am even personally very suspicious with TSLA, UBER and few others), which could have very bad effects on indices!
Hi Peter and friends
energy chart for next week attached
https://imgshare.io/image/may-3-7th-energy-chart-2nd-green-line-chart.w4k4g
Thanks Tom,
It’s inline with my astro points, After that June 7 is an important date.
glad we’re on the same page John
I am just looking at the Kp index based on it looks like we ramp from 1am EST to a high before morning and then retest the low around 11 am- 1 PM est ramp up till next day.
https://www.swpc.noaa.gov/products/3-day-geomagnetic-forecast
I am very new to this just trying to understand.
High Tom,
the pattern of energy is the same as my indicators(5-6) But INVERTED.
Let see what happens 🙂
Peter T
Your video posted in this thread is very very insightful and very well said .
I think you covered Elliott wave theory beautifully .
I do have a couple questions even though I’m in complete agreement with you .
My concern short term is the March low on a print basis only on the spx and my thought
Is that it’s probably going to get taken out before the market reverses up . You do show
This possibility in your chart ( not a question I’m asking )
The question I ask is about the NYA
You have major labels in red showing the A B C decline from the Jan 2018 high
To the Dec 2018 low .
My focul point to my question is the B wave high and the Jan 2018 HIGH .
This area in price on the NYA leaves me question how much longer this
Sideways price action may last in the event that the NYA goes above that
Oct roughly 2018 B wave high and yet fails to make any high above the Jan 2018 high .
To keep it simple :
Is it possible to consider the NYA in a longer term triangle formation that
Still has many subdivisions left to go before it is complete ?
Obviously there is a lot of time left before even considering this .
Thank you for your free post today
I found it a huge value
Joe
Joe,
Triangle? That would be quite a stretch.
Peter T,
Thank you for sharing the video with us and your Chart Show and blog. I can’t talk for others, but I care about learning more about EW and I am trying to absorb it. My confusion is with all the changing counts and trying to interface it with what I know and use over the last 30+ years. That is where this blog interests me… to learn from you, both free blog and paid, and also from others that have similar cross-experiences similar to mine, so we can all learn and share together. I understand how you can get disturbed by non-EW chatter on your blog, so I will subside or stop posting. All the best, mojo Mike
Mojo Mike,
I’m not “disturbed by non-EW chatter” at all. Just pointing out that, as I’ve been saying for a few weeks, this current wave down is corrective (and once corrective, it doesn’t change mid-stream). It must at some point completely retrace.
As I said over and over between attacks, the large B wave up was also corrective. I didn’t recommend trading it because with corrective waves in a fourth wave environment, the short-term predicability is at a low. It’s similar to craps, where most of the time, the house has the advantage, but there are certain times and bets you can make where the house odds are very close to even. Well, some people didn’t like Mr. Elliott’s approach, but it is what it is. You have to play the odds.
We’re coming to an important inflection point, where we’ll actually have high probability set-ups leading to decent swing trades. I’m just raising my hand saying, “You know, I’m still here. You don’t need to completely ignore me.”
I’m just trying to help (or I wouldn’t put out this blog, or share the video). So no, I’m not “disturbed,” but there’s a lot of noise here and once in a while when it’s important, I feel I should signal that fact.
Peter T,
I appreciate your comments, and salute your diligence to your refined practice. I have read and studied EW theory for a couple decades, and I have seen no one pierce the data, levels and patterns like you do. After following other EW “glancers” for a long time, I have become a surfer (I like surfing 🙂 riding the waves up and down, trying not to get off too soon or staying on too long. I think EW can help me increase the probability of catching better rides while avoiding the big rocks. A lot of us are trying to fit our trading into EW (or technicals, or…), or seeing how EW fits into our trading.
Again, thanks for what you do, congrats on your command of EW, and kudos on EW services and sharing your expertice. To your success and all. Cheers!
And to your success! That’s what it’s all about. This has been a day trading market for months. That’s about to change, imho.
Peter T,
I appreciate your feedback and comment. I see your point about corrective (NOT) just changing to impulsive. I don’t want to ignore you… or bother you. Thanks, and … Cheers!
Peter T
I agree it is a stretch to consider the NYA in a Triangle with many more subdivisions left .
The NYA does have an A B C ( A ) Labeling though and with this being a B wave to the upside I have to at the very least leave it on the table until it is proven wrong .
That failure of course will come in the wave C portion or the wave E portion
which is still a long ways from where the NYA is now which is a wave B.
Anyways, I tend to look for more complex waves at times so while this type of count is not outside of a 4th wave I do realize at this stage it cant really be forecasted .
Im not looking at a chart right this minute yet it seemed to me that we have had several simple wave 2’s ( of sorts ) over the years and so expecting more Complex moves seems appropriate ( just my thinking with the rule of alternation )
again that is off the top of my head .
Bottom line : I appreciate your time and effort and im not disagreeing in anyway .
the previous thread last week I voiced my bias to the upside so today
im just saying thank you ( its always good to see some agreement )
wishing you the best .
im keeping quiet this week
I am new to astro and Peutz window. We have a solar and lunar eclipse in early July. Does it mean that the Peutz window is open in the second week of June ? (Basically around full moon within 6 weeks of a solar eclipse). It seems like we are setting up for a quick 7% move – and VIX is way too low at 18 for that kind of a move in either direction. Implied move over the next two weeks is only 3.5%. The reason I am bringing this up is because I can see an alternate count where wave B ended and we are in wave C of 4 which may take a form of 3-3-5. There are way too many possibilities at this point. I will stick to staying short using puts and then keep rolling the strikes. I end with less P&L, but at least its a “P” rather than an “L”. Short term technicals continue to show bearish bias, but I am hesitant to go against the views of Joe & Peter T – both of who have been very prescient before.
You are right there is two options – one is shown above flat correction with one more leg higher for c/B.
The other is triangle, but this is not B what Joe Longwill is trying to see it is D.
Your C is in fact 3-3-5 lower for E and this current a-b-c is just a/A/E. In June b/A/E and impulse lower July and August to finish c/A/E and 40 week cycle low.
We should see a few weeks higher the indicators/market breadth need to reset. If we see in June corrective move higher it is your 3-3-5 down. If it is strong it is c/B for the flat.
I will add my two cents and then I will hold my peace.
Peter has repeatedly stated that people on the blog should NOT use the public comments to TRADE. Most of us who frequently comment on price action are TRADERS. Sometimes what we are seeing we indicators we have been using for many years will differ from the public EW count and our comments on how we trade what we see will often differ from Peter’s prediction. There is nothing wrong with having different perspectives. As traders when we are wrong we pay a price and have to take full responsibility for how we deploy limited resources. I do not know about other posters but I for one cannot afford to miss the trading opportunity clearly presented by the break of a bearish rising wedge, and the confirmed break-down in a H&S pattern, as well as clear and decisive breaks of key support/resistance levels as well as the all-important 200 day moving average.
As Peter has stated, apparent patterns do change. We all know in EW 1,2,3 counts for most of us can be difficult to distinguish from ABC. I for one lack the skill to recognize strictly corrective from impulsive wave as Peter can, but I can certainly after trading the market for many years employ my own indicators to signal when a sizeable market move is likely ahead, whether that move is corrective or not. I have absolutely no interest in proving anyone’s perspective right or wrong, and in fact when I am uncertain I will carefully look at what Peter is saying about the market. I do not always agree with his calls, but I am always willing to learn, and greatly appreciate the extremely valuable insights and learning opportunities the forum presents. So as to avoid causing anyone confusion who might not be an experienced trader, I too will refrain from voicing my own views and trades on the market. I did quite profitably trade the current decline as my own indicators gave very clear and powerful sell signals and these indicators are what I know and have used for years. I am grateful for the forum, and my only aim in posting is to make a useful contribution to others who are also active traders. I do greatly appreciate all the contributors, even when I may have a different point of view. I wish everyone the best of trading success, whatever methodology you are using!
Thank you Mr. Temple and Tom 🙂
Thank you for the write up and video Peter…I am a huge Elliott wave fan..and scalper , day trader , week trader long term trader..I know there is a lot of skeptics
about Elliot wave so that is why I have been posting along with others on how I use it..
I agree with Peter that if someone using Elliot Wave as a guide can not just depend on an expert like Peter..you have to understand the methodology so it helps with your probability of trades..
I can only speak for my trades and it hugely increases the percent of positive trades..I also use Oscillators and trend lines..and past price performance in determining trades….I feel like you always have to be learning in this business to be successful..so I have appreciated all on this forum..so agreed to what others have said I will not post my trades..I do place some risky bets at times and would not want anyone to take the same risk I do….that was not my intention when I posted..
Everyone should have their own system, no matter what it is. In that case, EW will give you confirmation, or not. At the very least, it tells you which direction the market is moving and whether that move will last.
🙂
Absolutely! 🙂
Peter’s heads up has kept me out of a few potential doggy-do-do’s… 🙂
for you pink line fans
updated energy chart attached
https://ibb.co/1ZyhKKP
Nice Fit Tom, so up into wednesday morning.
Hi Tom,
where do you get hourly data for solar energy, i have searched everywhere its always 3 days for forecast for hourly energy chart.
thanks to Peter’s free blog
I provide it here
for your good pleasure
enjoy and stop stressing yourself
Thank you!
you are most welcome p.
Bounces continue to be anemic. I would like to see a much stronger price action before I am ready to believe that some sort of bottom is in place.
Energy chart update attached
today was spot on with the pink
https://imgshare.io/image/may-3-7th-energy-chart-pink-line-chart.23Vv4
Hi Tom, I cannot send E-mail to you anymore. Your E-mail address was changed? Could you send E-mail to me? Thanks! Jas
correct
i’m no longer working
@ that old e-mail address
how can I get your e-mail?
Mine is joshua-189@hotmail.com thanks
Tom,
are those 24 hr charts or just during market hours
Thanks Tom, After June 6 (dip), my next turn date is June 11, this has to be an other top.
for your eyes only john
https://ibb.co/SPQ7QSW
Haha thanks, See nothing, hear nothing,can not speak…only write..
Thanks Tom!!
Like the pink;)
Pinky is 2 for 2
Peter T,
Your 2720 held yesterday, but it will take someone like you to figure EW counts after the disparity FAAMG stock havoc caused to some indices (QQQ, XLK) and not others (SMH, SOXL). Chart Show will be interesting! It was tough, but positioned for rebound late yesterday.
Latter in pocket above BBands, QQQ has a lot of work to do…
Finally a strong momentum bounce. The down trend line comes in at 2798. Lets see if we can take it out over the next 2-3 days.
Peter T, Joe, Tom, John – Thanks to all of you. I was able to trade this turn in SPX very profitably based on inputs from all of you.
https://i.etsystatic.com/16588228/d/il/ed6103/1665209244/il_340x270.1665209244_c1v5.jpg?version=0
Amen!
updated energy chart
https://imgshare.io/image/may-3-4th-energy-chart-2nd-green-line-chart.29cL8
Thank you have good night 🙂
Hi Willem and John (fellow time traveler)
4 your eyes only
https://imgshare.io/image/june-15th-july-12th-energy-chart-green-and-red-line-harvest.29LV4
p.s. tell me how we look in july?
Thanks Tom,
My favourite movie 1985, https://www.youtube.com/watch?v=qvsgGtivCgs
I do not know how July will look, but the for this month I have June 07,11 and very important June 24.
It’s amazing how you can paint all those pink lines in these charts..
Hi Tom,
The indicator you show I have lost. I had more then 35 indicators(and I am Old so I forget somethings). This indicator can go on for 5-10 months correct and it suddenly stops. Sometimes a inverted picture works.
My most important indicator is based on the DOW Jones a month before, named My old indicator/bleu line.
-Nice thing: is it does not invert.
-Bad thing: when QE is back again it does not work correctly. So it predicts a month ahead and from 21-09-2018 it is O.K.
-NOW for the month of July? The low was 3th as predicted and then up into the 3th in July and can go further. BUD there is a serious decline between 18-22 june. After that we should go up into the 3th of July and further I cannot predict yet.
watch http://www.prognoseus500.nl/
It lookslike Peter is forecasting Back To a new HIGH and then……………………………..
Be carefull
Forgot this:
There is no indicator that I know of that is predicting the movement of the stockmarkets constantly. You always have to go back to the normal movement (Peter is forecasting) But Peter is THE specialist on this. So I became a member.
I missed it had to fly out for emergency mouth surgery I will have tmo 😔in Costa Rica and the cell service is so slow here ..
hard to trade.. hope u guys get a lot off this week will be hugely bummed if this is the down we are waitin for 🙁
you get well Marie
your health comes first
All the best with your health Marie.
Thanx so love those energy charts I find them amazing .. I was schooled with masters and all but doc in economics with all the theories ..and read all the books Buffett blah blah.. if you told me about this stuff 15 years ago I would of said trash ..
Now I feel a lot of what I learned is trash crazy how you see if you just open your mind
Marie,
I tried to introduce cycles to the business school in our local university but they simply don’t want to hear about it.
Energy Chart update
https://imgshare.io/image/may-3-4th-energy-chart-2nd-green-line-chart.2BGdf
Thanks Tom, like I said June 7, is important so the dip today should be bought..
All the best
John.
I wonder what your energy chart looks like between June 7 and June 11?
Been busy all week so took a quick profit on Tuesday thanks to you. Appreciate it sir! I am bearish next week but entry will depend heavily on your energy chart 😉
Hope a wondeful weekend will light up your wife’s mood.
previously posted
https://ibb.co/SPQ7QSW
Thanks that’s clear.
I think today will invert Tom, so up in the beginning,later profit taking.
All the best John.
Mojo and Verne if u want to talk trades in future ..by another means let me know more heads are better than one
Great idea! Let’s exchange e-mails we we can talk about set-ups we are seeing and how we are trading it. Right now in big bull put spread after the impulsive five up off the lows…. 😇
Verne, thank you for your contributions before. I enjoy reading it. If you have any group chat pls let me know if I can join. Thanks in advance!
Don’t want to post my email.. I don’t know if peter would mind sending my email to you..and mojo ..
I also use an app called threema it is secure and good for groups too.or WhatsApp
Sent.
🙂
I want to be added to the group. Please send the info to me by email. Peter, would you please send my email address to Marie?
Sent
Peter T has done an excellent job navigating this market using
For the most part , strictly an Elliott wave perspective .
I do use Elliott wave theory and I am a big believer but my bias has become
More about timing and indicators or time first with an Elliot wave perspective secondly .
Combining it all together really does make a huge difference .
We did see the weekly reversal in the cash Dow .
That was needed in my work .
While my work still points higher for the month of June I cannot state the present wave
Upwards off this last June 3 cycle low .
I’m very happy to see the reversal though and it always blows me away when I see
The timing work ( it does not always work )
Thank you Peter T for your free blog and your attention to detail .
Enjoy the weekend everyone !
Friday matters to me only on a close only basis so until I see the close I
Have nothing further to add .
Option expiry next week , I tend to avoid option expiry weeks .
Thanks again Peter T
Joe,
Your timming is still spot on, together with Peter’s EW is a great combination.
My thoughts :
We will see a top today or June 11, after that we will give back some gains or sideways till June 17.After that up till June 24, after we will go down again.
John – June 19 is the FOMC. I ran a historical analysis on FOMC falling within 2 days of a new moon or a full moon as compared to other FOMC meetings. The market shows a higher realized volatility when FOMC falls within 2 days of a New Moon or Full Moon. There is no real difference in the movement of implied vol going into the event. It is interesting that you have a period covering the FED as important (I am assuming your calculation does not incorporate an FOMC meeting).
Vivek,
Thanks for sharing, my dates are based on astrology only.
Today, is a possible turn date so I m curious how this will end..
Thanks, Joe.
A friend of mine who follows Indian astrologers said they are predicting major war after September of this year.. I pray that does not come true
In my work mid August starts a bearish cycle lasting approximately 10 months ( a July 2021 low ) and the time frame
Surrounding January 10 2020 starts another bearish cycle lasting
Approximately 1 year ( a Jan 2021 cycle low )
Then I read this from Martin Armstrong’s blog It is still too early to make a reliable forecast just yet. But generally, the next wave of the ECM business cycle should be an inflationary one. It certainly appears that all of this Quantitative Easing has caused tremendous damage and has now trapped the central banks to the point that the biggest debtor is the government. They have tried to use interest rates under Keynesian economics to manipulate “demand,” which is used to force us to borrow or stop borrowing. But all of these manipulations have no impact on preventing government borrowing. The danger now is that after 10 years of QE, governments are addicted to low interest rates and raising them this time will blow up the government budgets. They will respond by raising taxes to try to keep the ball rolling, but that will result in civil unrest and deflation.
Note the last sentance
https://www.armstrongeconomics.com/armstrongeconomics101/ecm-armstrongeconomics101/the-next-cycle-in-the-ecm-beginning-january-2020/
We end up with deflation which could ( my cycles ) run from 2022 into 2023-2026 .
I can’t at this point look out further than that .
The up coming elections in Nov 2020 will most likely be a defining moment which
I have nothing to say on at this point .
That is a very large guideline
It’s not all bullish in the large view
Joe – do you have any view on the solar + lunar eclipses in July ? History shows that you are better off selling a pop in equities that comes due to the first fed ease. It starting to look like the ease will come in July. Just going by past cycles, you are supposed to sell that pop (which is likely to happen when the FED eases) and stay short for 12 – 18 months. Because of this Fed analogy AND Peutz window, I was thinking of getting short sometime in the middle of July. The pace of this rebound makes me feel that we may be close to 3000 on ES by then
Mr. Temple’s analysis couldn’t be more spot-on, kudos to you sir!
Been busy this week so didn’t benefit from this rally. But I am very happy for you current bulls here 🙂
Tks.
🙂
Tom,
Looks like this week energy chart did not exactly pan out as thought. Specially 6th was supposed to be down.
3 day forecast said early morning dip and ramp. May be I am reading it wrong. In any case down next week is what energy charts are telling
Vivek
I wrote in the previous thread ( last weeks free blog ) what I thought in regards
To the puetz window . I’d rather not get into any debate about that subject .
All I can say is that it’s in everyone’s own best interest to do some research on the previous
Puetz cycles and keep an open mind to what actually happened rather than assume what
Has been said ( regurgitated ) on the internet .
As for the Fed meetings , that is another story as well .
Overall though if your correct about the 12-18 month time frame then add 12 to 18 months
To that meeting date and see if we are in alignment time wise .
I did make an error to my previous post .
Mid August 2019 plus 10 months is June July 2020 not 2021 yet the rest was correct in what I was saying .
I’ll add we will also be dealing with a George Lindsay time count .
From every major high you look for a low from 12 years 3 month to 12 years 8 months after
That high .
Oct 2007 was the last Major high .
Add 12 years 3 months and you get Jan 2020 and add 12 years 8 months you get June 2020 .
Hence June 2020 to roughly Jan 2021 is full of cycle lows .
Then add in the benner business cycle which called for a peak in the year 2018 ( last year )
And calls for a low in the year 2021
And lastly consider how many cycle lows have been seen in years ending in 2 .
Go back to 1922 , 1932 ,1942 , 1952 ? Not so good , 1962 , 1972 a high, 1982 , 1992 ? , 2002
2012 ( a 12 yr 3-8 months count from year 2000 high ) and up coming year 2022 .
It’s all stacked up .
I’m just pointing out the history not all theory based .
For now though I’m focused on the month of June being bullish .
Hope that helps .
Bottom line :
I view the entire year of 2020 as bearish despite being bullish right now .
Hi Tom,
4 days right,only yesterday was inverted, so that is a good score in my eyes.
Do you have a chart with the Pink Panther lines for next week?
Fully agreed; and he is not a full-time trader but always finds time to give help. I much appreciate your turn dates too 🙂
FYI, I am very bearish next week. And my middle name is Gartman.
Absolutely ..love Tom’s chart ..I am just trying to learn and see if i can replicate.
Hi Bill. Tom once said huge computing power is necessary for his work. So you may need at least an Anton 😉
I find this more than a little interesting .
Yes they are sending this bill to the governor
To sign but…..unless it’s going to help us we won’t put it into effect .
Somehow I think this will back fire on them
So who is really nervous about losing power ?
http://www.bing.com/amp/s/thehill.com%2fhomenews%2fstate-watch%2f447214-bill-granting-oregons-electoral-votes-to-national-popular-vote-winner%3famp
The bill also notes that, if the legislation is passed, it won’t take effect until a number of states possessing a majority of the Electoral College’s 538 votes join the agreement, also known as the National Popular Vote interstate compact.
“This agreement shall take effect when states cumulatively possessing a majority of the electoral votes have enacted this agreement in substantially the same form and the enactments by such states have taken effect in each state,” the bill states.
So far, only 14 states and Washington D.C. have joined the pact.
Hello Peter and friends
this has been a very interesting week
dealing with some personal health issues
I’ve seen a lot of strange things over the years but not
what I’ve seen this week (first time 4 everything)
I’ve seen energy charts invert 1 or 2 days
even an entire week
I’ve seen time shifts, half a day, 1 or even 2 days but never
5 days, yes! I said that right
5 days, that is a first
I will need at least another trading week to confirm this event
updated energy chart posted below
https://screenshot.net/n31wf17
Hi Tom, did you mean June 6 was an inversion?, so down monday after that up again?
June 11 is an astro turn date in my work, so that could also be an up day
hi john
the only inversion day on the blue chart I posted yesterday was the 7th
and yes Monday morning looks like a weak open
I will post a better chart when I get more data
Oke,
This comming week could be an exciting one..
We are still in the red moonperiod, so I expect a wave down before we go up again.
Nice weekend to all.
I find it so interesting how it all correlates.. if my count is right on
Dow haven’t been able to work much this week
We will be finishing c down of 4 which should finish Monday then up for wave 5 of (3).. On 5 min chart seems to agree with john and and Toms charts then down for (4) and up for last (5)
Hope your feeling better Tom
My count is slightly different. EWO and momentum indicators look to me like third wave done and fourth underway, with a final fifth up just ahead…. 🙂
That can be possible too Verne it was a quick look that I did … back to work next week ..I let my brain settle this week
Looked back Macd looks like (3) is probably done now in (4)
Hi Marie
I would like to hear how you look at MACD in determining EW. I was thinking the same thing because MACD was so enemic when indices ripped higher. RSI2 > 90 on 21 of 30 Dow stocks, 26 of 30 RSI2 >80. Not a trigger, but usually where markets get tired… or correct. I use MACD and CCI (commodity channel index) to help with wave counts.
I will be at the chart show this week to see Peter’s updated count. I really want to get a good exit of short puts of my bull put spread. Some counts I have seen have us in only the first wave up and that would imply a lot more upside. We have lots of new 52 week lows, oversold readings, and nine confirmed HOs on the clock…we should see at least a pullback soon.
A new weekend blog post is live at: https://worldcyclesinstitute.com/broadening-tops/
This website is for educational purposes relating to Elliott Wave, natural cycles, and the Quantum Revolution (Great Awakening). I welcome questions or comments about any of these subjects. Due to a heavy schedule, I may not have the time to answer questions that relate to my area of expertise.
I reserve the right to remove any comment that is deemed negative, is unhelpful, or off-topic. Such comments may be removed.
Want to comment? You need to be logged in to comment. You can register here.