

Everything is Wonderful!
If you pay attention to leaders of virtually any country in the world, everything is wonderful. The main stream media will back up that sentiment.
For example, in the US, the trade war is supposed to be a good thing … bringing lots of revenue into the country through tariffs (does anybody actually believe this?), unemployment is at almost an historic low, the stock market is at new highs and central banks (supposedly) are in full control, and we’re expecting strong levels of inflation in the near future. I’d say there’s somewhat of a disconnect from reality!
This weekend, in terms of the stock market, all the bears are piling on, due to the short-term weakness of the past couple of weeks (even though the market hasn’t damaged any Elliott Wave technical levels. But the trading herd always does that; they never learn. “Buy at the lows, sell at the highs” doesn’t ever seem to have an impact on reality … and nobody reads history, although most of us would agree that it repeats.
Such is what we can human psychology. Being contrarian can be a lucrative mindset.
You just have to browse alternative websites, like zerohedge.com, for example to find out what’s really going on. Here are some recent examples:
- Deutsche Bank is on the ropes, near insolvency
- In the US, congress is all but completely dysfunctional and corruption on both sides of the aisle has reached historic heights
- Iran is being threatened with military action — spoiler: International wars never break out at 500 year cycle tops; we’re headed for a long period of civil wars
- Negative interest rates are now spreading to bonds, which is a sign of impending doom
- Governments around the world are turning over and becoming either socialist, or populist (or both)
- Real Estate pricing around the world is collapsing, which will eventually lead to bank implosions. Australia is leading the way; they had arguably the biggest housing bubble of all.
- Economic sentiment among the young is turning down dramatically
- Family finances and standards of living are at all time lows
- American cities are falling apart; Chicago is bankrupt, Ontario (Canada) is more bankrupt than any other sovereign substate in the world. Here’s a financial update on American Cities. We’re awash in debt
- Complexity throughout business (and the Law of Diminishing Returns) are signalling a collapse is imminent (the 737 MAX debacle is only one small indicator, TSLA another)
- Floods worldwide are destroying future food production (these floods and the resulting worldwide hunger issue ALWAYS manifest at the top of 500 year cycles like this one)
- US companies are folding and many are laying off scores of workers
- Capitalist trumps health, as scientists around the world warn about the health effects to come from 5G
- And the population is getting “Dumb and Dumber” … and getting more so
- What on Earth could go wrong? Everything is wonderful. It’s time to starting getting prepared. We only have a couple of years to get our acts together for a downturn that few can fathom. History tells the tale of what’s to come.
I’ll be telling the tale in an upcoming webinar: “Navigating the Coming Crash” and I’ll have details within the next week. This webinar is going to explain all the things you can do to prepare.
Stay tuned.
_______________________________
Keeping Tabs on the Russell 2000 (Changes This Week)
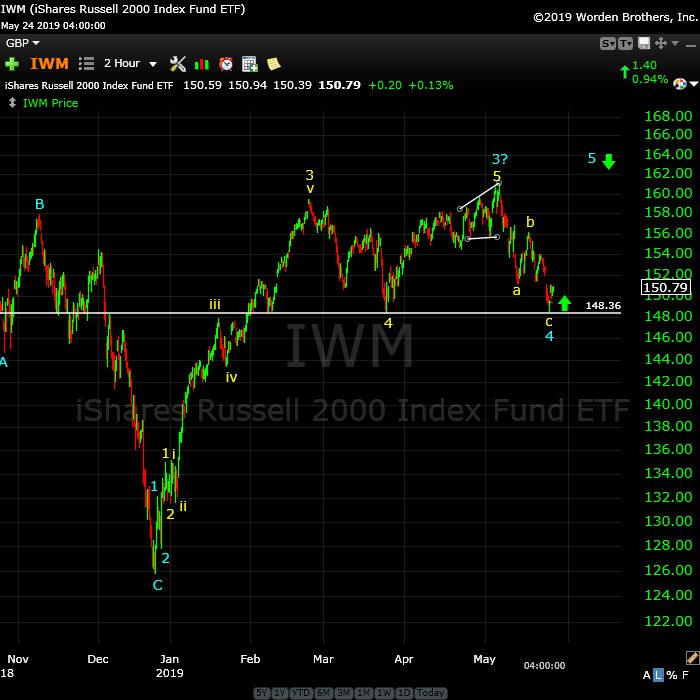 Above is the two hour chart of IWM (the Russell 2000 small cap stocks).
The corrective pattern completely changed this week. The ending diagonal that had formed broke to the downside this week and has created a double bottom with the previous fourth wave. I suspect it will turn up from here.
I’ve chosen to use a 5 wave count in order to keep track of where we are. However, the large size of what you’d characterize as the 4th/5th wave can only be a B wave, which makes the entire structure a “three.” For more on the “right look,” go here.
The other issue is at the bottom with blue wave 1, which was itself in three waves. That itself makes the entire wave corrective right from the start.
There are a couple of points to be made here:
- When a wave starts off with three waves as a first wave, the wave itself will never be impulsive (always be corrective) no matter what happens to it
- The “look of the wave” is extremely important in determining whether it’s impulsive, or corrective.
Also note that the most recent wave down is in three waves, which is obvious just looking at it. That means the wave is corrective and must retrace back up to the top.
As I often say,
“Trade what you see, not what you think.”
___________________________
Elliott Wave Basics
Here is a page dedicated to a relatively basic description of the Elliott Wave Principle. You’ll also find a link to the book by Bob Prechter and A. J. Frost.
____________________________
Registration for Commenting
Want to comment? You need to be logged in to comment. You can register here.
If you register, it protects your information. It also allows you to comment without filling in your information each time. Once you’re registered, simply go to the home page and click on the login link top right in order to log yourself in. Usually, you’ll be logged in for several days before needing to be logged in again.
______________________________
Problem receiving blog comment emails? Try whitelisting the address. More info.
______________________________
Couldn’t be happier … KK 2
Couldn’t be happier …The analysis and insight you provide is simply amazing! I’ve been trading the futures and equity markets for well over thirty years and usually average around 5% monthly. Since joining your Traders Gold Service two months ago, that number has better than doubled. I couldn’t be happier.—KK |
the real deal SM 2
The real deal …‘Educational, insightful and thorough market analysis for all levels of traders. It’s Elliott Wave at its best….Peter Temple is the real deal’ —SM |
Have not had a losing week RW 2
Have not had a losing week …I have been with Peter almost a year. The only thing that matters is have I made money with his service. I think I have finally turned the corner using Peter’s EW. I have not had a losing week in the last 5 months. Thanks Peter, for your amazing amount of hard work. —RW |
Tops in your field DZ 2
Tops in your field …You are tops in your field. Tried to follow Elliot Wave international for years. They were always behind the market. After discovering you, I perceive that you are an expert in reading the waves, which puts you way ahead of the rest of your peers. And you can read the Waves like you are reading tomorrow’s financial section. I pray you stay healthy. —DZ |
Get an upper hand … JC 2
Get an upper hand in trading …Seeing all the different currency pairs and the wave structures and hearing you explain why this has to do that on a nightly bases gives one a upper hand when trading. Elliott Wave applies to all stock and indices and can be applied to any candlestick chart. If someone ask what you want for Christmas – Tell them a membership to Peter’s “Traders Gold!”—JC |
Rise above the rest … SM 2
Rise above the rest …I have only ever met a few people who, in their chosen fields (astrology, medicine, music, martial arts, technical analysis), rise above all the rest and you are one of them…you have ‘the gift’…and that’s why I’m a Trader’s Gold member. —SM |
The best of them JL 2
The best of them …Last couple of years, I subscribed to several ‘market traders’. You are by far the best of them and the personal contact is awesome. Daily and daily updates are very well written! Besides your expertise in EW, I also like your cycles analysis. Best investment I ever made! —JL |
A true expert in Elliott Wave FL 2
A true expert in Elliott Wave …You are a true expert in EW analysis. What you provide is not available anywhere and is priceless. Subscription on your services is the best thing I have ever done. Many thanks for your effort to make me a better investor. I now have more trust in my investment decisions. I hope you will continue the excellent work! —FL |
US Market Snapshot (based on end-of-week wave structure)
This chart is posted to provide a prediction of future market direction. DO NOT trade based upon the information presented here (certainly NOT from a daily chart).
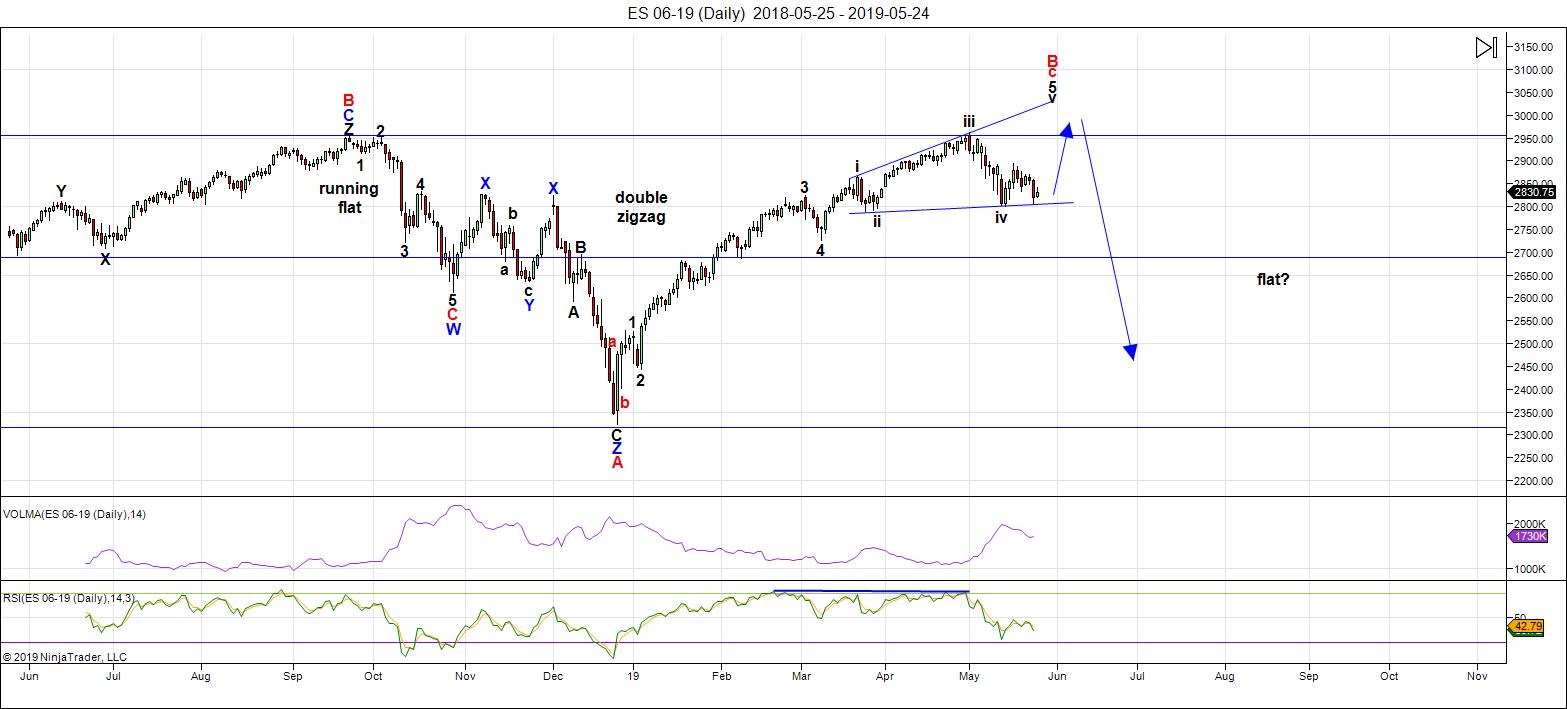
Above is the daily chart of ES (click to enlarge, as with any of my charts).
I've been predicting a new high for the current bullish (corrective) wave in the US indices for a few weeks now. That's because the wave down from the current top was corrective right from the get-go. However, this market is so weak, that the final rally attempt keeps failing. It'll eventually get there, though, because corrective waves retrace to their tops (or bottoms, as the case may be).
The next major move is to the downside (after the top is in). I can't provide a date for a top, because of all the wave failures. These wave failures have also affected current patterns in some indices. Some ending diagonals (at the tops of the DOW and Russell 2000, for example, have failed. This has resulted in double fourth wave bottoms (they're really B wave bottoms — the structure of the wave up from Dec. 26 is so corrective, as I've been saying right from the start). The corrective nature now couldn't be more obvious.
As a result, the wave up from Dec. 26 in ES is must eventually fully retrace to the downside. This is supported by the US Dollar Index, the major USD currency pairs, WTI Oil, along with DAX, TSX, and other international exchanges.
The current pattern in ES still appears to be an ending expanding diagonal. There is still the possibility that this pattern could also fail and drop a little lower over the next couple of days.
This week, the currency pairs (and the US Dollar Index) reversed, as I've been predicting they would, to allow the final rally, as somewhat of a "parade to the top."
It's impossible to successfully analyze this market without taking into account the movement of a number of related asset classes. The market has gradually been aligning across these asset classes and now virtually everything si moving more or less in "lock-step." When you trace out a major top, all major indices have to top at the same time. This 500 year topping process will include many international exchanges.
Summary: My preference is for a dramatic drop in a 4th wave to a new low. The culmination of this drop should mark the bottom of a large fourth wave in progress in the NYSE since January 29, 2018 - a year and a half of Hell. It may be a relatively fast, dramatic drop. In any case, ES will target the previous fourth wave area somewhere under 2100.
Once we've completed the fourth wave down, we'll have a long climb to a final new high in a fifth wave.
___________________________
Trader's Gold Subscribers get a comprehensive view of the market, including hourly (and even smaller timeframes, when appropriate) on a daily basis. They also receive updates through the comments area. I provide only the daily timeframe for the free blog, as a "snapshot" of where the market currently trades and the next move on a weekly basis.
______________________________________
Sign up for: The Chart Show
Next Date: Wednesday, June 5 at 5:00 pm EST (US market time)

The Chart Show is a one hour webinar in which Peter Temple provides the Elliott Wave analysis in real time for the US market, gold, silver, oil, major USD currency pairs, and more. You won't find a more accurate or comprehensive market prediction anywhere for this price.
Get caught up on the market from an Elliott Wave perspective. There’ll be a Q&A session during and at the end of the webinar and the possibility (depending on time) of taking requests.
For more information and to sign up, click here.
| "I think you are the only Elliot Wave technician on the planet who knows what he's doing.” |
| m.d. (professional trader) |
All registrants will receive the video playback of the webinar, so even if you miss it, you’ll be sent the full video replay within about an hour of its conclusion.


Folk, this is NOT panic selling and VIX is absolutely confirming that fact.
I think we are seeing the systematic unwind of a frothy, fraudulent, LEVERAGED market, as phony as a three-dollar bill. We have hseen a ridiculous run-up on absolutely no confirming accompanying volume. This CANNOT continue indefinitely…
The idiot talking heads attributing the dive to Trump shows just how clueless they are. Cover for the bankster exit?
around the approx 146 on IWM is big support to me if can’t hold …
http://schrts.co/nENNtCxE
it can go below it but needs to bounce back above..again ignore numbers..they are usually in process of thinking waves..but still looking at the ABC…
still divergence many places
Just got into office, bot the morning hook TQQQ 50.51 but I am not excited about this market.
Out @51.04, QQQ and SPY are at previous support which (I think) is now resistence. I am watching VIX 18
Ya I will buy back in but going to wait for channel to break..
if it does..still looks like will..but still can go either direction..or if SOXX breaks that last high
With that said I also see were we can go down to 2445..ish in dow..and finish there and up..very close to what Joe..sees…lets see..
Volatility high (VIX,VIXY, UVXY) on 9/5/2019 strongly suggests the completion of some kind of initial impulsive move down. It lends credence to the idea that the new low and corrective move up was an expanded flat for a correction. This incredible VIX divergence with the market at substantially lower lows is a gargantuan problem in terms of figuring out where in this decline we are. It makes absolutely no sense to me and I have watched vol price action for quite some time. It is either INCREDIBLY bullish, or or HELL is literally about to break loose.
Considering the plethora of bearish signs the market is currently awash in, I think extreme caution is very much in order. I am stumped! 🙂
BTW, H&S measured target is indeed around DJIA 24K….
This bounce is also corrective – not seeing any short term signs to fade this sell off just yet. Sticking with rolling puts strategy. One tweet can change everything
Yeh, and that right shoulder (on DOW) is smaller, lower, weaker… hard to time, but those features can go before big whooshing sound. Fed the dog TQQQ, then reversed into VXX at 11:36 @30.05 but no confidence to hold LT (unless I decide to make that a swing position…
SOXX holding up better than rest of MKT, is it a sign of rebound?
VXX trigger was VIX rebound off 18
Verne, your VIX comments are plausible. I have VIX in bullish trend with risk range of 14 -to 20.5, so we are nearer to top of range (and importantly.. the ranges are dynamic)…. and probably will widen with VOL action today. So with bullish trend and NOT top of range, I MAY go home with VXX and build position if market rebounds… subject to fear, greed, etc 🙂 Best to your trading folks… Cheers!
I have a target arrived at from a few different metrics at around 25.00.
While market price action suggests to me it really should go much higer, that seems to be the range the chart itself is pointing to. Something very strange about volatility these days….I think it is somehow entangled with the nefarious risk/parity scam….
I sold half my long vol positions at the open but may reload depending on the close.
Things there looking pretty bullish to moi…!
Bullish for VOLATILITY, that is…don’t want to confuse anyone out there…! 🙂
Too late… I’m confused. In the words of Daniel Boone:
“I have never been lost, but I will admit to being confused for several weeks.”
😉
It appears to me that the charts of these indices don’t have a shelf to sit on …or a pot to … pardo
Pee! 🙂
May 13 the 14 day rsi on the daily cash dow chart hit 29.68 ( the close of the day )
Today may 31 — 14 day rsi is sitting at 30.42 . very slight bullish divergence if we were to close right here .
the 5 day adv decline line is starting to turn up yet the 10 is still pointing down.
the hourly $Tick is a bit overbought , yet its a very short term indicator .
5 day trin sum I wont calculate until after the close
.382 price retrace
And next week is going to matter right from the get go .
In Order to have an important weekly and monthly close we
weed to see this take place . had I not been so caught up in the timing
I would not have thought of it on a closing basis .
going long sunday in the overnight and adding Monday .
the mkt has to rise all next week or I am wrong .
Rule of thumb
buy when the 14 day rsi goes below 30
buy even more if the 14 day rsi goes below 27 ( its rare )
look at the 14 day rsi on the index’s of your choice for the past year.
after looking at that decide how bearish you wish to be .
Indicators fail in bear markets yet they work pretty good in bull mkts .
the timing is dead on ( hopefully )
until next Friday
enjoy the weekend everyone
Fibonacci
looking at YM M9 weekly chart
week of :
oct 1 2018 plus 34 weeks is this week
Dec 24 2018 plus 22 weeks ( 1 week of )
Feb 25 2019 Plus 13 weeks
April 22 2019 Plus 5 weeks .
Id say that is a bit of a cluster in time on a weekly basis .
I hate to talk about moving monkeys but… SPX and QQQ (IXIC) both under 200EMA today, DJI DJT been under for a week, but not extreme oversold (OS) by my indicators. So it’s hard for me to see major, fast rebound (but who knows). My 195min (1/2 trading day that includes extended trading) went negative QQQ on MACD (positive VIX) 2 weeks ago, and no extremes yet. Energy/oil drops could force more selling first of week. Two scoops of VOL incase that handle pops out of cup
Enjoy the weekend….
I see two different stories if I look at 2 hour vs Daily on Dow..with that said..
in my notes if we cracked 24883.03 and closed under next is 24,459..
very mixed signals…goin on..
but I highly respect the astro work and ..and from what I remember if today was a low then it should be up from here..May 16 being the other important date..
to the next June date..
I am poised for both directions for Monday..
Always good hedge…BUT, the trend is clearly DOWN… 🙂
previous post
ill also note that I do not like the close below 24906 .
that said im thinking the same as before
Joe Longwill
May 29, 2019, 3:31 pm
This Weeks close will also be a Monthly Close .
This makes Fridays close a very important weekly and Monthly Close.
In this case id look at a Line chart .
Its pretty much a requirement that we should see a close below
the march close this week .
Exiting all bearish positions on a Friday close that is possibly the lowest close
of the week and as well as lowest close of the month might be a bit difficult .
or buying that same close .
No mystery folk. Close at the lows is… OMINOUS…!
Have a great week-end all!
https://www.youtube.com/watch?v=wGPNk8Wy2GQ
Randy is getting worried
IF ———
So far the mkt did was was expected in my work
If this continues then we will be looking at all time highs
by the end of June .
Yes an ugly close for the week and the month
but longer term not so ugly from what im looking at .
Some oversold readings yet nothing extreme .
The timing is either right or wrong is all im going to say .
Going long in the overnight futures Sunday and will add to them
daily through out the entire week .
if im wrong it will be obvious
New highs by the end of June will almost certainly require some sort of Q.E. announcement.
You are certainly right that it will be quite obvious if your call is correct or not.
One can never argue with price!
The market will have to undo quite a bit of technical damage and do it very short order for that to happen. Knowing the banksters however, anything is possible.
Evidences that this could happen would be a VIX capitulation spike, reclaim of the 200 day, MACD bullish cross, and closure of series downward gaps.
Series gaps tend to be seen at the start of both bullish and bearish trends, upwards and downwards respectively.
Right now it is abundantly obvious that the banksters are unwinding leverage as support levels are steadily giving way. Then there are eight Hindenburg Omens on the clock. I have learned the hard way never to make presumptuous claims about what Mr. Market will or will not do and the even more important lesson of taking what others say about such things with a needed grain of salt. Randy is one of the best trader/analysts out there and he and I were both wrong in our strong expectation that we would see at least a re-test of the 29210-2920 critical support/resistance shelf. Never happend!
While I would argue that the technicals do not favor new highs in June, when it comes to Mr. Market one should never say never! 🙂
I have spent a bit of time with a few other traders discussing the strange situation of glaring VIX divergence from market price when compared with the 09/05/19 most recent spike, and what we have concluded in kinda scary. We know market volume has been low, reflecting declining market participation. What we are seeing with VIX is exactly what one would expect if there were so few market participants, that their reaction to price would be muted.
Folk this is extremely problematic. Apart from hapless pension funds and a few remaining hedge funds that are still trading, the banksters ARE the market!
What happens when THEY loose control?
This entire market is one treacherous, fetid, rotting house of cards…be careful out there…!
BTW, Marty Armstrong is talking about “panic” in the month of July. Some have suggested it could very wel be FOMO BUYING panic in a manic retrace of the current move down. That does make some sense. How I trade that eventuality will very much depend on whether it looks to me like a “B”, as opposed to a “2” up, with the former needing a turn up this week, imho.
VIX hinting that just might be the more likely scenario…
A new post is live at: https://worldcyclesinstitute.com/corrective-waves/
This website is for educational purposes relating to Elliott Wave, natural cycles, and the Quantum Revolution (Great Awakening). I welcome questions or comments about any of these subjects. Due to a heavy schedule, I may not have the time to answer questions that relate to my area of expertise.
I reserve the right to remove any comment that is deemed negative, is unhelpful, or off-topic. Such comments may be removed.
Want to comment? You need to be logged in to comment. You can register here.