
Teetering
 Get Ready! US indices and Oil are setting up for a final top and currencies, for the most part, are going to drop a bit to accommodate them. In the currency pair world, we’re a bit of a mess this weekend, with non-confirmations between them. EURUSD has already turned the corner and in the fifth wave (and reached a new high this week), but I see a substantial drop on the way. The wave up, as I’ve saying looks corrective. The British pound is in the same boat in terms of expecting a wave down early this week.
AUDUSD and USD CAD have smaller waves to contend with, but the story is similar with them. Neither has turned into their fifth waves, I don’t think. The waves from Friday in both look corrective so far, and I expect them to stay that way.
What I’m seeing is a fractured market. With each of the assets, the final waves will play out in full, but it’s virtually certain that the US indices are going to top ahead of the currency pairs and the dollar.
In the US indices, we’re looking for a final kiss .. perhaps a double top in all of them, although we could see extended waves (I think tis is lower probability). Fibonacci measurements, as you’ll see throughout my report, are strongly suggesting the final kiss at the top will be “it.”
Non-Confirmation
The principle of confirmation is one of the common themes running throughout the entire subject of market analysis, and is used in conjunction with its counterpart—divergence.
Confirmation refers to the comparison of all technical signals and indicators to ensure that most of those indicators are pointing in the same direction and are confirming one another.
Divergence (non-confirmation) is the opposite of confirmation and refers to a situation where different technical indicators fail to confirm one another. It is one of the best early warning signals of impending trend reversals. — Technical Analysis of the Financial Markets, John J. Murphy
A few weeks ago, when I introduced the non-confirmation idea, I was referring to the US Dollar and the EURUSD currency pair. It appeared that the US Dollar had traced out a five wave impulsive wave to the upside, while EURUSD had traced out five waves to the downside (except that they were overlapping, which then counts it as a ‘3,’ or a ‘corrective’ wave—in Elliott Wave parlance). I have come to the conclusion that they have both traced out fourth waves and are now in their fifth waves.
While there’s a minor non-confirmation between the dollar and the euro, there are larger ones between other pairs and the euro. I show this throughout my video report this weekend. There’s an even larger one between the US indices and the USD currencies. The US market appears to be turning down first, but there’ll be a final wave for currency pairs before they’re done.
Non-confirmations are usually prevalent at a major market reversal (a change in trend).
The NYSE
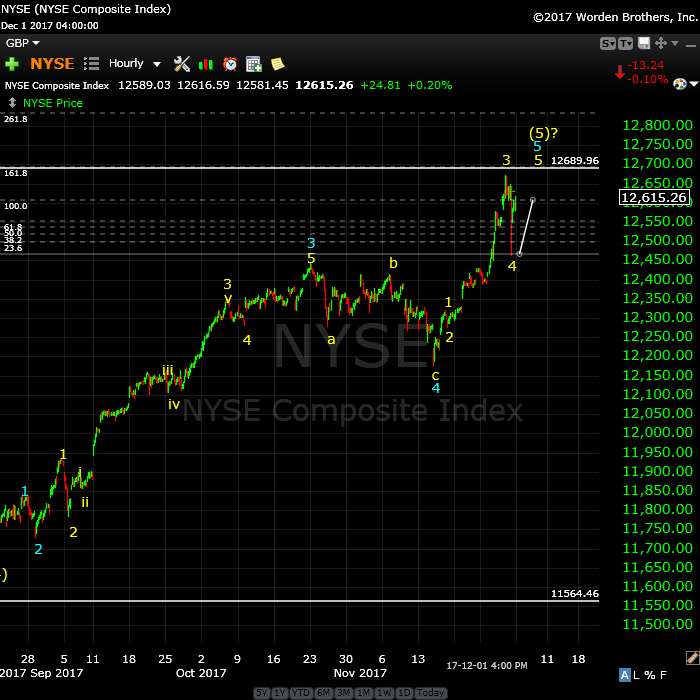
Above is the hourly chart of the NYSE Composite index. Last weekend, I posted a chart of the NYSE, calling it the “straggler,” in that it needed a new high, but it was the last index to make one. Well, we got it.
I’d expected perhaps a fourth wave right away, but the third wave extended. We got the fourth wave late this week and now, we have only the 5th subwave left to go. Going by the length of the first wave of the fifth, I’ve placed the fibonacci retracement tool to project the length of the final wave from the bottom of 4. If this final wave rallies to its usual full length (1.618 X the length of wave 1), we should reach just under 12,700. Wave 5 could extend, but both a 3rd and 5th extension is very rare, so I think this should be the end of it.
The SP500 has the same pattern and prognosis.
______________________________
the real deal SM 2
The real deal …‘Educational, insightful and thorough market analysis for all levels of traders. It’s Elliott Wave at its best….Peter Temple is the real deal’ —SM |
A true expert in Elliott Wave FL 2
A true expert in Elliott Wave …You are a true expert in EW analysis. What you provide is not available anywhere and is priceless. Subscription on your services is the best thing I have ever done. Many thanks for your effort to make me a better investor. I now have more trust in my investment decisions. I hope you will continue the excellent work! —FL |
Couldn’t be happier … KK 2
Couldn’t be happier …The analysis and insight you provide is simply amazing! I’ve been trading the futures and equity markets for well over thirty years and usually average around 5% monthly. Since joining your Traders Gold Service two months ago, that number has better than doubled. I couldn’t be happier.—KK |
Rise above the rest … SM 2
Rise above the rest …I have only ever met a few people who, in their chosen fields (astrology, medicine, music, martial arts, technical analysis), rise above all the rest and you are one of them…you have ‘the gift’…and that’s why I’m a Trader’s Gold member. —SM |
Get an upper hand … JC 2
Get an upper hand in trading …Seeing all the different currency pairs and the wave structures and hearing you explain why this has to do that on a nightly bases gives one a upper hand when trading. Elliott Wave applies to all stock and indices and can be applied to any candlestick chart. If someone ask what you want for Christmas – Tell them a membership to Peter’s “Traders Gold!”—JC |
Have not had a losing week RW 2
Have not had a losing week …I have been with Peter almost a year. The only thing that matters is have I made money with his service. I think I have finally turned the corner using Peter’s EW. I have not had a losing week in the last 5 months. Thanks Peter, for your amazing amount of hard work. —RW |
The best of them JL 2
The best of them …Last couple of years, I subscribed to several ‘market traders’. You are by far the best of them and the personal contact is awesome. Daily and daily updates are very well written! Besides your expertise in EW, I also like your cycles analysis. Best investment I ever made! —JL |
Tops in your field DZ 2
Tops in your field …You are tops in your field. Tried to follow Elliot Wave international for years. They were always behind the market. After discovering you, I perceive that you are an expert in reading the waves, which puts you way ahead of the rest of your peers. And you can read the Waves like you are reading tomorrow’s financial section. I pray you stay healthy. —DZ |
The Market This Week
Here's the latest daily chart of ES (emini futures)
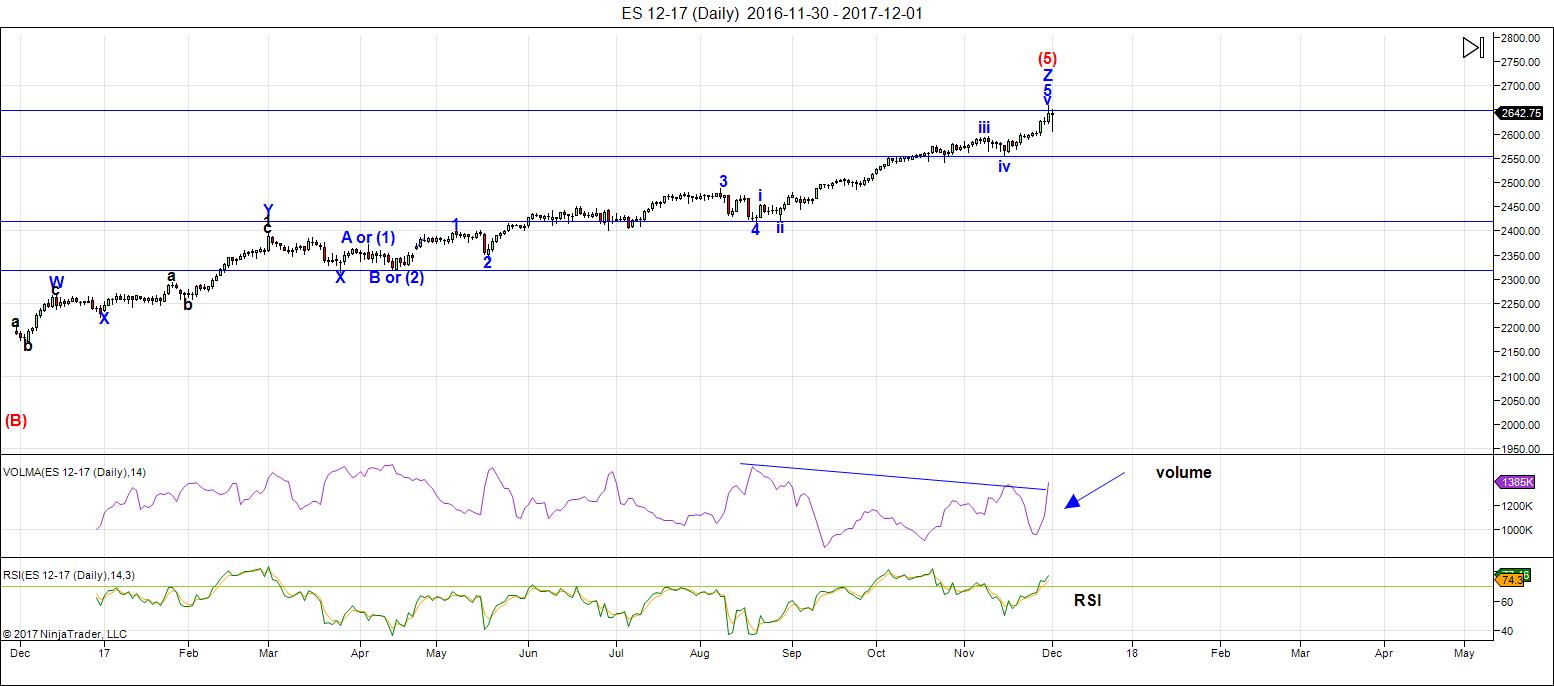
Above is the daily chart of ES (click to enlarge, as with any of my charts).
There have been no material changes to my prognosis. We are at the high. I expect this final wave to breach the previous high for the final time.
We're now down to hourly charts for all the action. It's been a day trading environment for the past few months.
Volume: With the sharp drop this week in a fourth wave, volume has spiked, as would be expected. That's the selling starting.
Summary: The count is full for the US market in general, except for small subwaves that form the balance of a motive set of waves in SPX and some other major US indices. ES broke the potential ending diagonal to the upside and has formed five impulsive waves up. Except for a final 5th wave subwave, we're at a top. We may get a first wave down as early as Monday. It looks like the Nasdaq has topped but we still need confirmation (a new low below the previous 4th wave).
_______________________
Here's the latest 60 MIN chart of ES (emini futures):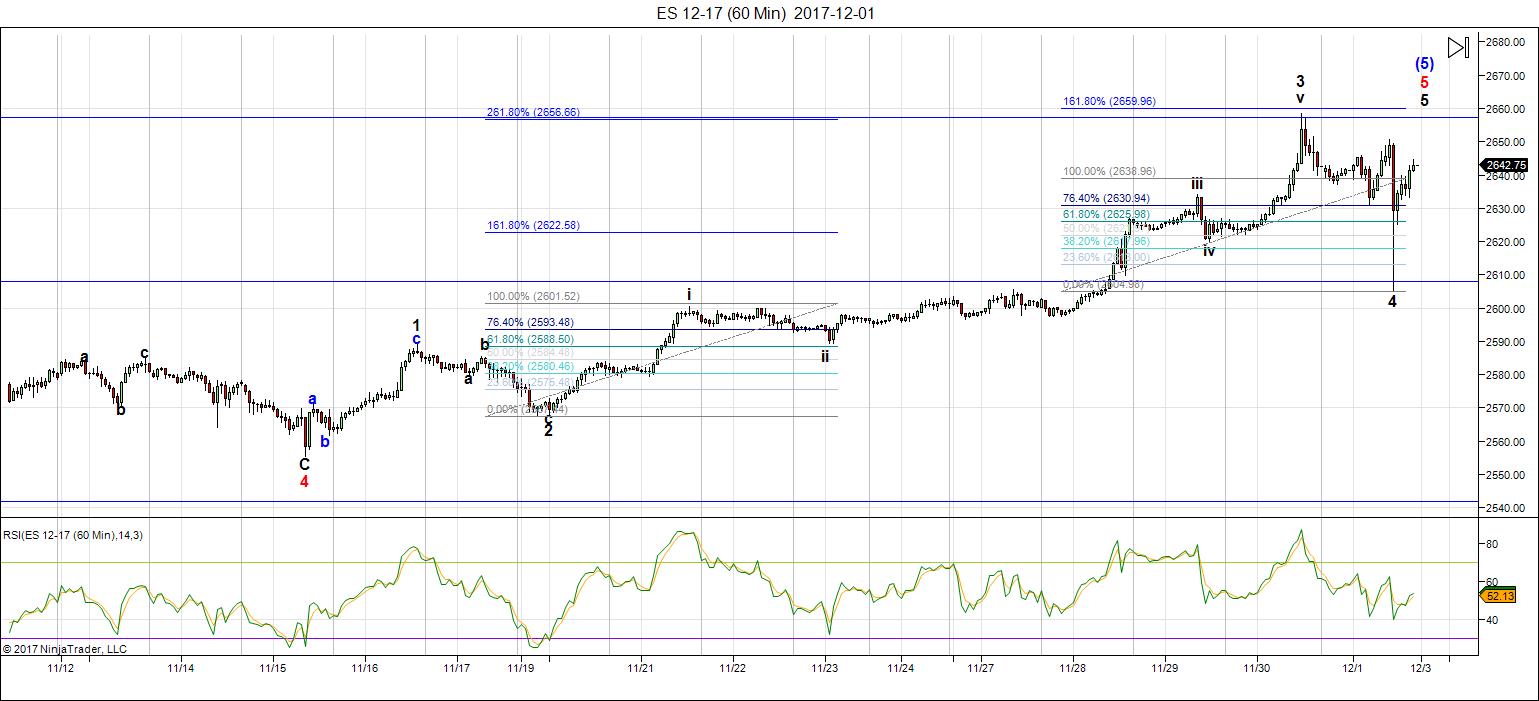
Above is the 60 minute chart of ES (click to enlarge).
Well, early in the week, we broke the ending diagonal and forced me to revise my count. I was expecting the fourth wave of the ED but we turned up instead to parallel the count and structure of the SPX and NYSE.
On or about Thursday, I was expecting a fourth wave of the fifth and on Friday, we got the bulk of it. The waves down are clearly in three waves. We now have a full three waves up, as per by count above. We're waiting to finish off the final 5th of the 5th perhaps over the weekend. If we reach the top on Monday morning, watch for the start of the first wave down in ES/SPX.
The fibonacci tools on the chart show that the third wave ended up being extended (2.618 X the first wave) and the 5th wave, if it rallies to the usual 1.618X the first wave, will complete a double top (at ~2660). There is the possibility that it could extend to 2.618 X the first, but that's less probably at this point, I think, looking at what other indices are doing (and oil, which is also near a top). If it were to extend, the target would be about 2694.
Short term: The wave count is now virtually complete and we may end up in a double top for ES as early as Monday, if so, watch for a turn down into a first wave.
___________________________
Trader's Gold Subscribers get a comprehensive view of the market, including hourly (and even smaller timeframes, when appropriate) on a daily basis. They also receive updates through the comments area. I provide only the daily timeframe for the free blog, as a "snapshot" of where the market currently trades and the next move on a weekly basis.
______________________________________
Sign up for: The Chart Show
Next Date: Thursday, December 14 at 1:00 pm EST (US market time)

The Chart Show is a one hour webinar in which Peter Temple provides the Elliott Wave analysis in real time for the US market, gold, silver, oil, major USD currency pairs, and more. You won't find a more accurate or comprehensive market prediction anywhere for this price.
Get caught up on the market from an Elliott Wave perspective. You’ll also get Andy Pancholi cycle turn dates for the SP500 for the balance of the current month. There’ll be a Q&A session during and at the end of the webinar and the possibility (depending on time) of taking requests.
All registrants will receive the video playback of the webinar, so even if you miss it, you’ll be sent the full video replay within about an hour of its conclusion. For more information and to sign up, click here.


Peter, thank you for update.
A small question:
in ES chart the wave ii doesn’t retrace even 38% of the wave i.
Usually you insist that the second wave has to retrace at least 62% of the first.
Why do you accept so small retrace in this case ?
Hi Dmitri,
Wave ii is an “internal wave.” It’s the second wave within wave three. There are no rules regarding the depth that particular wave has to drop to. For this to be an impulsive wave, each of the subwaves needs 5 waves, but there are no rules at to where those subwaves have to drop to.
Peter, thank you for your answer,
how do you determine that the wave is “internal” and should not respect the EW rules ?
Dmitri,
It does respect EW rules. The rule is that an impulsive wave has to have 5 subwaves that conform to fib levels (ie – 62%) but besides wave 1, 3, and 5 having to have 5 subwaves themselves, there are no further rules.
Thank you
Thanks Peter T for the update. Also for the article on financial slavery. My 21 y/o son just read it and now has a whole new perspective on the financial markets and debt. His biggest take away (other than debt can lead to slavery) was the realization of the value of the dollar being worth .04 cents comparatively. Thanks again.
Thanks, Jeff.
I’m bringing back a series of last year’s articles … one a week on this subject, so more to come …
Y’all …..y’aaaalllllllll!
so i took the ES down to the 1 minute time frame to project out with fibs. As it seems right now, it looks like the fibs are pointing to …[drumroll please] 2664!!!! If we reach this price point, and the market turns “top” here, then it is incumbent upon me to inform y’all that……… “we are ALL in very SERIOUS, s-e-r-i-o-u-s……….trouble!!!!” TRUST ME. https://invst.ly/5-f09
and,,,,yes LIZ i know i still owe you the continuation of the 666/3.14/212 number saga. Liz…… and of course “verne” [who is playing the role of nosey ole samwise ganges!]…… this continuation “IS” coming……..
Peter, as always, thank you for your weekly update! Luri, while I’m waiting for you to post your intriguing “research”, I am trying a new recipe: mixing a cup of our host Peter T., a tbsp. of Joe, Verne, Luri, Andre, an ounce of Tom and Peter G, a spoonful of special qwertqwerty and kelsen sugar and see if I can bake a Krampus cake in time for December opex. 🙂
……sounds simply……[gulp!]…………………”DELICIOUS”……..liz……..[cough]…………perhaps if could be so BOLD as to suggest ADDING a teaspoon of fresh ground “nutmeg”……………..?
[OH MA GAWD GUYS – LIZ IS COOKING “AGAIN”………………. JUST SHUT YER TRAP…..SMILE……..AND COMPLIMENT HER ON HER AMAZING BAKING SKILLS…..DO YOU UNDERSTAND ME!!]
……. “BE WARNED!”
https://invst.ly/5-gtu
close up of the last subwaves on the ES…..and yes i have the “unicorn” expanding ending diagonal for the final wave 5……..it is what i see.
one minute time frame – https://invst.ly/5-g-a
The insistence of the crowd over at EWI that we had a top could not be resisted. I simply HAD to grab some SPY 267 calls based on my long standing thesis of doing the EXACT OPPOSITE of that their wave counts recommended. Nothing new under the sun! 🙂
Yep. I think we are still completing wave three, with a fourth and final fifth still to come…closer….but not quite there yet….
Something to keep in mind per Marketwatch, “Since 1990, the S&P 500 has climbed 82% of the time in December with an average gain of 2.5% when the index has risen at least 10% by the end of November, according to Frank Cappelleri, a technical strategist at Instinet LLC.”
Be that as it may, there is a sad irony to what is unfolding in the markets. No doubt this manic move up of the last few weeks will serve to draw in the final cohort of trend followers who have no interest nor inclination to consider the larger context in which the price movement is happening. What an amazing eight years! Literally trillions in stock buy-backs, well over one trillion in 2017 alone. In what reality can markets propel themselves higher at the rate of 14% per year while GDP growth is under 1.5 in any sustainable way? Untold masses seem convinced this is not only possible, but inevitable, the omnipotent banksters, you understand. Now comes an astonishing article this weekend that claims PENSION FUNDS are also involved in the short vol parity trade to juice yields. Absolutely mind blowing that this is any way legal. You cannot achieve a more egregious level of fiduciary malfeasance imho. The short vol trade, direct and synthetic, is probably even larger than currently reported. I will post the link to that article if anyone is interested. Those of us who understand what is going on are going to do just fine. I think the blow up of the short vol trade is going to represent the greatest transfer of wealth ever seen in the history of markets. Sadly, an untold number of innocents are going to get financially slaughtered as a result. CALPERS is already in serious trouble with ther fat portfolios of oil explorers that is blowing up as we speak. That moron Jerry Brown and the other cretins in the California legislature are hiding the losses from the clueless participants so there is a precedents for recklessness with these funds in a pursuit of yield. PENSION FUNDS!!!????
What the hell has happened to the goons running this country??!!!!
verne,
my good man – ‘cool yer jets’……. It is kind that your are outraged at “deformation” of the markets, and the fraudulent consequences of that deformation upon the unsuspecting……………………….but the greatest, kindest event would be for market to simply “collapse”………………..none of it is real…………….none of this fantasmagorical “wealth” is real…………….it is all noiz………….. it is all unreal……
that which is truly “real”, is that which can be taken with you upon your death.
so there is something to be said for collective “hardships”, and struggles, which forces people together into a supportive “community”…… the memories of deep relationships and experiences can all be taken with you at death…
and speaking of NOIZ – here are the last subwaves of the “fraud”
https://invst.ly/5-n76
https://invst.ly/5-n76
Ss true…a great reminder.
“What shall it profit a man, if were to gain the whole world…and loose….”, you know the rest….
Verne,
I would be very interested in that link! Thank you!
http://www.zerohedge.com/news/2017-12-03/alan-fournier-pensions-funds-are-shorting-vol-because-theyre-starved-yield
Gann Square of 9 resistance points on SPX for those interested….
Last low 2557 plus 180 degrees = 2659/2660 (very close to 2664 Luri)
1576 High plus 6 rotations (6 times 360 degrees) = 2672/2673
666 Bottom plus 13 rotations (13 times 360 degrees) = 2683
A 2017 top would align 1929 (top), 1973 (top) & 2017 (top?) ……. next on Square of 9 would be year 2063 ….. probably tell the kids : )
Not sure bulls are in such an accommodating mood…….
Cheers
Waydown
Interested in thoughts …… don’t discount the Astros as another measure …..
https://imgur.com/gallery/lw3C1
Chart shows 4th Harmonic. In 8th Harmonic the high Friday landed right on 2657 but market looks to push higher today. Support has been solid, unfortunately the resistance bit adhoc.
All the best
Wayne
sorry folks…. try chart link;
https://imgur.com/luFh9YI
I’ve said multiple times on this blog, the 9/5/1929 top on a 28-30 year astrological time-based cycle does not line up to October 2017. Everyone thinks we passed the window. We did not.
Mike, the old adage stands true, markets ‘don’t repeat but rhyme’. So where is that illusive window? Might have some price targets, but time is so elusive…
A few things to consider:
The exact corresponding date for the top would be Jan 8 2018 based on Saturn Sidereal. However, Saturn / Uranus angles must be taken into consideration. Previous turns were at 5.5° and 100°. I would have to go back a shorter time frame, find a top, and add 90-95° to it to see if it’s within range. We are close to 117° now. These are also very slow moving planets.
Gann also said Solstice dates & transits from one sign to another are important. It just so happens Helio Saturn moves into Capricorn on/near the solstice in December. So I’d say the window is now.
I wish I knew more about the heavenly portents. I do know I am seeing futures up triple digits with price ALREADY trading above Bollinger bands…. DU-UH!
Have to admit, never heard of Eltanin but have been tracking Saturn & Uranus.
ES update – at the 1 minute time frame as we are in the last subwaves….
https://invst.ly/5-otu
morning update of ES- https://invst.ly/5-pym
Closed more Dow on this beautiful rally. Easy peasy money. Stop now at 24400 Nasdaq showing weakness and S&P not too strong so i hope we see a top soon otherwise happy to sit and watch my pockets being filled. Seems like US markets get ramped up and then an algorithm is activated to buy the equivalent net sells in the market to hold the market at that level.
Pockets-es??! What has it got in its nasty little pockets-es??!!! 🙂
Gollum! Gollum! 🙂
verne,
wake the neighbors – we are that close!
https://invst.ly/5-qb2
and then there was ONE……..https://invst.ly/5-qg3
luri it looks like a break to the downside now right? Will w5 come or not? Getting tempted to jump on a short but resisting for the moment.
Qwert,
that is a tough call….. 5 will come, but it may “fail”…….
https://invst.ly/5-qmx
if we close the gap – then this occurred…..https://invst.ly/5-qna
qwert,
this final wave looks extremely weak..
https://invst.ly/5-qv8
Toms energy chart also suggests a mammoth drop today…hmmm…..
sorry i meant tomorrow is a big drop but today should start dropping towards the close.
Reminds me of my favorite “Genesis” album…”And then there were three…”
Btw, Phil Collins’ performance of “Undertow” on that album is haunting…
OYez! OYez! Wake up and smell the napalm! 🙂
That move down in NQ is as impulsive as it gets….!
A fascinating article I found in my “not read yet” pile from the head of the Bulgarian Astrological Association citing today as the possible top. It was written some time ago. http://astrohoroscope.info/stoycheff/?p=69
Thanks for sharing this info! Amazing stuff! Was published in 2008… If today is indeed the high, that would be a remarkable prediction.
peter,
let us “ready” our tickets for travel to “bulgaria”……we simply MUST make contact with this man!! wow!
Fascinating!!! Thanks for sharing the article. Amazing how consistent planetary movements are and even more interesting how that movement effects human behavior.
That was a great article, strange how 9 years ago he said Dec 4th 2017 the market will start a decline. The DOW gaped up 350 points and by eod yesterday gave 300 back
don’t bother trying…Kiril Stoychev will not respond to your overtures…
overtures??? blasphemy!……. he shall of course, respond to “food” elegantly created by loving hands and presented for consumption as if a “fine” painting…………………we are all human in this respect rotrot…..
As the old saying goes, “The way to a man’s heart is through his…” well, you know… 😉
talking about “belly’s”…….. here is an early call
https://invst.ly/5-sba
I’m looking at the gravestone DJI doji waaaaaay above the upper B band and shaking my head in absolute wonderment…”taps” anyone?
Is anyone else looking at this and truly understanding the implications??!! 🙂
verne,
the thick blue line is overlap level. it is amazing how they levitate!!! you need to adjust your BB from 2 standard deviations to 3 strd deviations. :-))
https://invst.ly/5-tah
I am expecting VIX to chase that last five up if we get it. That will be glorious confirmation….
So we have overlap!
https://invst.ly/5-u26
This looks like a controlled demolition to me. Close DOW slightly green so Ma & Pa come home from work and all looks okay, then Black Tuesday, 12/5/2017.
One can hope, right?
you are indeed correct mike,
they have “walked” this market down and hidden in the “failed” 5th wave to boot…..
https://invst.ly/5-u3-
a “pullback” view at the one hour timeframe for the ES
https://invst.ly/5-ucz
Yes indeed! That was one incredible dogfight in NQ to try and arrest the move past the invalidation point for a new impulse up. Wow! It is really something when you think about the fact that this is happening in an extreme bullish environment with a dearth of committed sellers!
Peter G,
Great post on Saturday referencing sentimentrader.com….
Thanks for sharing!
Wasn’t my work, Ed. Don’t praise the messenger!! 🙂 But thanks for the back pat, anyway!!
Look at the volume today?
With a little imagination, SPX topped at 2666. They just couldn’t make it that obvious. Add the 1 and the 6. Flip the 9…
The 1 and the 5.
That’s what I told luring…but, er, well…ahem!… 🙂
I meant luri, caused auto correct ambushed me…AGAIN!
See what I mean? I wouldn’t even let me call it CURSED!!
mike,
it is 666 x 4 =2664……..so the obvious number is 2664. The high in the spx was 2665.19……………… which leaves of difference of 1.19 or 119……the mirror image of 119 is of course – 911……………… hmmmm…………….. coincidence?….. and verne, shut that darn “brain destroyer” spell check OFF…….. we were given a brain from god, in order to MISSPELL words…………..BE WARNED!
Ekzactly! 🙂
verne,
so this has been my “thesis”…….and the chart seems to “agree”… i “contend” – ladies and gentlemen of the “jury” [verne you are NOT on the jury because you use “spellcheck”]
…………………………i contend that the final 5th wave of supercycle wave 3 has been an expanding ENDING diagonal…..[peter you better sit down for this one……with a glass of brandy……and a bottle of valium]………. so our expanding diagonal BEGAN in 1987………AND just concluded! as you know, expanding ending diagonals end just “short” of the upper trendline………..
our first drop – as can be viewed by the chart…….is 8600, a drop completed within “weeks”………………cough…………….https://invst.ly/5–xg
” [verne you are NOT on the jury because you use “spellcheck”]”
I deeply resemble that!
But seriously, I have always felt in my bones that the reckless abandon that seems to characterize markets these days, endless liquidity, unending buybacks, manic shorting of and/or suppression of volatility, sky high junk bonds, etc. etc., would sooner or later eventuate in blow-back like we have never seen. Well, it turns out to be later, and if the chart of yours is right….”That’ll do it!!” 🙂
Oh, and your thesis of the swiftness of the retribution is all but certain. That is just the kind of thing I would expect from Mr. Market considering the current levels of giddiness. Folk are not going to know what hit them….
Luri that would be lovely but seriously I want what ever you are taking buddy. If that happens I think you should keep that chart as every mainstream media outlet will want a meeting with the man that predicted it!
Fingers crossed but I cant see that level of decline and that speed……..But hey maybe that’s the point no one will see it.
One things for sure you didn’t give yourself long to see it play out with that straight red line down!
It could take a major natural disaster to make that play out. It can happen but needs some catastophic earthquake, volcano or other event with major loss of human life. For that reason i hope it does not happen.
Not necessarily. If you have been following the recent discussions on the remarkable situation with regard to the gargantuan short volatility trade, then you will understand all it would take is a return to VIX’s multi year average around 15 to trigger a massive unwinding of that trade. I never cease to be amazed at how few traders have noticed this incredibly precarious situation for markets. If you couple a simultaneous attempt by all parties to unwind a trade this gargantuan with the dwindling market volume, you have a real problem. Some analysts have even argued that there is no one big enough to allow that process to happen, or worse, no one who is willing to take the other side of the trade when they attempt to buy back the short futures. There has been relentless attacks on VIX every time it gets above 14 so a close above that level would be significant. This could be a very bid deal.
expect the unexpected ………. we are non linear beings……
https://invst.ly/60429
Part of the power of the 1987 crash came from the selling of naked puts. Now it seems even the funds, etfs, etc are all doing it for easy income. Large risk as folks tend to sell far more options than what is wise.
The amount of vol selling being done by Hedge Funds is truly unparalleled. A bunch of traders in banks lost their jobs in 2008 because they were way too short vol. They all moved to hedge funds and have done the same. They have made a lot of money for themselves over the last 5-7 years. As vols go down, they keep increasing their notional short just to generate the same percentage return. I have no idea on how they can cover the vol short when things finally turn.
These cretins have no intention of covering. They fully expect to walk away from the carnage as they did in 2009 and leave the taxpayers and retail investors holding the bag.
I am long FAZ Jan 18 2019 20 calls at .69. Let’s see how bad the banking sector can do when this sucker falls apart over the next year.
…..i said – “ROLLIN……rollin………rollin on the river………………………… https://invst.ly/60598
If Mueller continues to pursue and find any type of illegality on the part of Trump, the Dems will seek impeachment and all of the market’s gains since the election could be erased, for his tax plan and other changes could eventually be unwound. That would create panic and could be the cause of the first big move down.
Long TQQQ. 11/15 low held. 🙂
Liz,
the TQQQ?……..
Luri, sorry I was playing with PLAY after hours. Yes, TQQQ. I stepped in at 131 but had to sell at 133. Will see tomorrow if buyers are strong enough to push it up to 155.
I meant push QQQ up to 155. If instead sellers push it below 11/15 low, then I join the wave down. But the 12,1, 12,4 & 12/5 candles remind me of 2/8-11/2015 candles.
the “laughed” at all the great chartist’s of their time – “DaVinci, Van Gough, Dali”……and now “ME”…………………. exhaulted am i, to be in the charting company of the greats!
https://invst.ly/6072p
a pullback view – the pink line represent “stop loss” lines….selling should accelerate once this line is breached. https://invst.ly/60755
You might look at an ending diagonal for that chart since all the waves are in 3’s.
boss,
i DO have it as an Ending Diagonal – the “unicorn” one, – the ending diagonal of the “expanding” variety……………… peter, it is a curse…..i only see expanding patterns in this era of algos……………. you are suggesting the ED of the contracting variety…… [gulp]……….
https://invst.ly/607fa
Gann said that time was more important than price. Long term time will square the price of 2740 early next year.
Sorry, folks.
is that a “direct” quote from Gann – kelsen,
OR are you “para-phrasing” using your own brand of poetic license??
…………………hey wait,………this Gann person – be he dead???/////////
???
Yes he did say/believe that. He also gave important time periods: 45 years, 8 years, 10,20,30 years. So…. there’s quite a bit of research to do on what happened in those periods & when they line up. Gann also did not tell you how he measured “time”.
A near 4500° rotation off the 666 low in an 8 year period is about as extreme as it gets.
2740? It is possible. Not sure if you are aware of it, but Gann had an average of 6 and mean of 5 which are planetary harmonic lines. That average of 6 is 2745. However, if SPX should fall below 2519 the average of 6 goes down to 2385. We are just barely in the next harmonic right now & probably won’t stay there.
interesting…..hmmm…
https://invst.ly/608jn
Peter
Thank you for the link . I’ll add it to my research and expand a bit on what I’m already using 🙂
Dec 13-14 th is a bit tricky to call , as a high it would consider a mini crash type move down into Jan 2-3
As a low I would consider a bounce into Jan 2-3 .
At face value only , Dec 13-14 should be a sell signal and come Jan 15-18 th we begin a larger crash phase .
In essence I’m seeing sequences of mini crash phases stacked up one after another after another with the first
Bounce worth trading near April 4-5 th .
All surprises are to be expected on the downside . Then after that bounce we go into another series and some of the crash phases should and most likely will become much much more intense .
The move should become relentless and for some feel like a very bad head ache that just will not go away .
The bull market is OVER .
Joe,
Thank you for your post! I would say that most everyone appreciates your humble thoughtful view of the markets! You place your views on this site for all to see without renumeration. I would say without expectation as Peter G says, without even a pat on the back!
I sense no ego involved and that is a remarkable thing. I have watched and read each of your post since July 2017 when you first believed that an August high would perhaps mark the top of this bull market. However, you said you could not discount the early December time period as a more likely Top.
So here we are…and we closed back below your 24211 level in the Dow. Simply saying thank you for all your posts. Excited to see what unfolds! I would not bet against you and Peter T.
Remuneration not renumeration…
http://www.thedailytick.com/dow-2018-2021-the-year-of-the-ox/
“around 2018 all options are finally exhausted, the Euro (zone) will collapse and the market will crash…In Chinese astrology, 2021 is year of the Ox. An Ox is a (castrated) bull. I think by 2021, most investors feel just like that. How fitting!…2018 and 2021 will be turning points of epic proportions”
Rotrot,
Interesting post! Thanks for sharing!
NYSE founded in an Ox year. 2015 was a goat year, enemy to the Ox. One of the reasons we had a little “blip” in the radar in August & end of the year.
I know some people disagree with me on the question of central banks’ influence on market price, a position I hold simply on the basis of price movement observation over the years. I find it almost amusing the the point is even debatable considering what we know about QE and they way banks have financed the prodigious amount of stock buybacks in recent years. And this is what they have actually disclosed! Having said that, I will readily concede the cluelessness of market participants in aiding and abetting bankster racketeering. Today is a great example. Considering what is going on in global markets, why aren’t American indices down triple digits?! As I said, CLUELESS! But not for long…. 🙂
Verne – For ECB and BoJ, support for corporations is explicit. I am guessing the Fed will go explicit as well in the next bear market. However, do you really think they will bother getting involved in 1-3% moves ? I would think they are more involved when we drop 10%-20%.
On a different note, if December ends up being a negative month, then it will be a first since I have data. December has NEVER been the top of DJIA or SPX in a positive year ! Maybe that’s where Joe’s Jan 15-18th comes as a potential turn for the real crash…
I would argue that the reason we yet have to see even so much as a 3% decline this past year is owing to their determination to arrest it. Very true about seasonal bullishness of December. I suspect if we get a plunge they will redouble their efforts to attemt to reverse it…as well they might for a final wave up…
Low vol may have to do with buyback abilities of corporations. That may explain why there is weakness in specific stocks during their buyback blackout. AMZN, GOOGL, JPM, PFE – (and most other big names) seem to follow this pattern. They are more likely to fall during a blackout as they are not there to buy a 2% – 5% dip. This is something I remember being a big issue from 2006-2007 when stocks went up to crazy levels simply because corporations could borrow cheap money. I remember my bank’s (yes, I was an executive on Wall Street for 17 years before deciding to retire), credit head claiming that there is so much money to go around that corporations can keep buying back their securities for another 20 years ! I am starting to hear similar language all over again. I am sure the trigger point will be when these companies will no longer be able to borrow cheap funds. It has started happening in segments of the market, but not yet prevalent enough to be on CNBC. Once borrowing become tough is when the Fed tries hard to continue pushing the bubble – and they do succeed for a few months. That’s what caused the series of 1s and 2s before the big 3 showed up. Monitoring credit spreads may help to figure out when to go really really long vol. Once spread widens on enough companies, they will not be able to hold vols down…And that move will be absolutely ridiculous.
It is an incredible two edged sword- the issuance of all that debt to finance stock repurchases. Those bonds are backed by ability of corporate earnings. The steadily flattening yield curve is warning of difficult economic headwinds ahead. This will affect corporate earnings which will affect their ability to service that debt, as well as their share price. You therefore facing dual destruction of bond and share price value under these circumstances. Many of those bonds are simply going to zero as they will probably never be repaid. It really is amazing that this is not more widely being anticipated.
I don’t know how old you are or how good a market historian, but careful with the “NEVER”s, Vik (especially the capitalized ones 🙂 ). Perhaps the 2nd most important top for secondary stocks in the past 100 years (and important for high caps also, but not as important) was December 1968. Secondary stocks topped in early December and declined almost six full years and around 75% depending on which index you use to measure. I think a few bears would be happy with similar performance here!
Peter G…you are a voice of reason…thank you!
https://worldcyclesinstitute.com/the-last-spike/comment-page-2/#comment-24422
As to negative Decembers, there have been five in the past 12 years…On the DJIA, November 30 to December 31 closes were negative in 2002, 2005, 2007, 2008, and as recently as 2015. The 2002 decline was 6.2%!!
VIK probably influenced by the much touted ” Santa Claus Rally” which has indeed held sway the last several years… 🙂
Verne/Peter – I meant Decembers in years when rest of the year had been positive. I was running with data from 1970. 2005 December was -0.1%. Not that exciting. But 1968 is very interesting. Let me try to get longer time series and see how things were between 1950 and 1970. It has definitely been painful to bet against “Santa Claus Rally”. But that’s when Elliot waves are useful. Of course, if this is actually a 500 year top as is Peter’s thesis, then these smaller time scales (20-30 years) is not that useful.
OK. There are more instances of December being negative. I take back my comments. Definitely getting influenced by sitting and talking to bulls. A total of 10 since 1961. That’s 18% – way more than what the chatter is about….Way way more than “NEVER”. Sorry guys.
verne,
i could hear you “clear” across the known galaxy – …….s-c-r-e-a-m-i-n-g ……for an ES chart update……
i am here to serve, mee lord!!!! https://invst.ly/60kr7
oh yeah, and verne – here is a lynette zhang. she is very much like you – she GETS it!……. i thought you would really appreciate listening to her interview…..
https://www.youtube.com/watch?v=Jo1AJSHBFuo
My dear luri…I was indeed starting to cogitate your being covert…! 🙂
…..verne…….
an “herbal” cough drop will help tremendously with your “cogitating”…… it must be giving you the most “raw” of throats!!! hey, i will get Liz to “bake” you something…….. :-))
Yum! 🙂
Oh, and I’ve got one thing and one thing ONLY to say about that chart…….I LIKE IT!!! 🙂
verne,
midway through that lynette interview, she shows a chart of the CB’s complete “managing” of all markets…… via MBS on the fed’s balance sheet.
Yep. She really lays it all out…for all who care to take an objective look…
That chart also looks like an identical twin of the price action of SVXY off the recent high….eerily similar!
Mike C.
Agreed, however, there are cycles within cycles and the cycle I am looking at ends early in 2018 at 2740.
Gann intentionally buried his methodology and used language to deflect the truth about his LoV. But with enough research focusing on what the So9 is, and what it does, squaring price and time is easily achieved.
Astrology:.
Favoring downward bias:
Saturn transit into Capricorn on same day as Solstice in 2-3 weeks.
Jan 8 2018 corresponding to the 1929 top based on Saturn position.
Could go either way:
Mars 21 Scorpio 3/19/2018. Whatever trend it starts (if it is not the end of a move started on this previous alignment) will last 465 days.
Favoring upside bias:
New Moon in Leo until Nov 18 2018.
My best guess (If I only used Gann and astro):
4680 degress off 666 low =2685 on Jan 8 2018. It’s an even 26 rotations of 360.
I’m curious, kelsen, if the cycle you “are looking at that ends early in 2018” has been more consistent than the 17 year cycle due in 2017 that has provided virtually perfect turning points since 1898. That’s seven perfect market turns with the only miss a relatively very narrow one when the market reached a major low in August 1982 rather than the scheduled 1983. I have never seen a more consistent long term turning point pattern…and I have seen a lot! Would you care to share the length of the cycle you see resolving in early 2018 and how that cycle also gives you a projected price level?
ARE YOU FRICKIN KIDDING ME!!!!!!!! JERUSALEM THE “CAPITAL” OF ISREAL????
TRUMP BELONGS TO THAT EVIL WHICH LIVES UPON THE DEATH AND DESTRUCTION OF HUMANS………………..
In fact, it is official U.S. policy to recognize Jerusalem as the capital of Israel and has been for 22 years, thanks to an act signed into law by none other than Bill Clinton………. Actually, it’s been their Capital off and on for 3000 years.
eric,
whatever must be left behind “post mortem” – is by definition – borrowed…..
and so, in closing – why the heck would anyone kick a massive bee hive – when you are trying to harvest some honey……… It seems reasonable, to leave unspoken, that which must be left unspoken, and when and until there is “peace”…………then make all the “capital” location announcements needed………
The timing was indeed puzzling. Particularly since there are swirling rumors of a two state deal in the works….
https://twitter.com/AstroGann33/status/938572487821893632
“Trump picked such an ominous day to declare Jerusalem the capital of Israel. The astrological transits for the next 12 months forecast many dark and threating clouds on the horizon. This will rattle the markets and the world at large.”
verne,
ES in the “morning” ……………… https://invst.ly/60z6c
John 4:21-24New International Version (NIV)
21 “Woman,” Jesus replied, “believe me, a time is coming when you will worship the Father neither on this mountain nor in Jerusalem. 22 You Samaritans worship what you do not know; we worship what we do know, for salvation is from the Jews. 23 Yet a time is coming and has now come when the true worshipers will worship the Father in the Spirit and in truth, for they are the kind of worshipers the Father seeks. 24 God is spirit, and his worshipers must worship in the Spirit and in truth.”
verne,
as you know, i called a “failed 5th” for the ES in this previous move. I will keep this count to be consistent…….. so without further adieu,
https://invst.ly/610mo
Starting to look like maybe once more, into the breach…
Does anyone have any comments or thoughts about Bitcoin over $17,000.00 ???
It’s crazy!!!
https://worldcyclesinstitute.com/a-teetering-top/comment-page-1/#comment-25043
Probably round number 15 or 20K….
Random thoughts for btc today.
12/7/2017. 12+7=10 –>1 2017=10 –> 1 so an 11 day.
Coinbase high 18464.46. If you add 1+8+4+6+4+4+6, you get 33.
33 is a multiple of 11.
Bitstamp high 16666.66 3, 6+6=12 –>3, 6+6=12–> 3. You get 333.
Now add the 1 back from the 16666.66 before the 333, you get 1333.
In 1333, a famine breaks out in China, killing six million. It lasts until 1337.
In Catalonia, “contemporaries would not have called the years 1333 “el mal any primer” (the first bad year) had it not been the first in a series of years marked by food crises.”
Very strange.
And 1320 was a 172 year cycle top, just like 2007. It turned colder and dryer … and that’s when you get famine. Big financial crash around then. Can’t recall the actual year for that off-hand.
Cycle tops: 1320, 1492, 1664, 1835, 2007.
Oh thanks Peter!
Edit for 2nd paragraph’s first sentence. Must have been thinking faster than typing:
*Bitststamp high 16666.66 3, 6+6=12 –>3, 6+6=12–> 3. So you get 333.
Here is the book link for the Catalonia famine. https://books.google.com/books?id=sjSXCgAAQBAJ&pg=PR3&lpg=PR3&dq=1333+catalonia+the+first+bad+year&source=bl&ots=sluebadRyT&sig=eW7SjMgDJAqUEyfMA6wCRpSwPVU&hl=en&sa=X&ved=0ahUKEwiS1-6m8fnXAhUF3mMKHbaGAZoQ6AEIODAF#v=onepage&q=1333%20catalonia%20the%20first%20bad%20year&f=false
Cool. Thanks. As you know, I’m very much into history relating to all this stuff.
OK, I have no idea what’s happening. Last try.
Bitststamp high 16666.66. Notice six occurrences of the number 6.
Add only the sixes in pairs. 6+6=12 –> 3, 6+6=12 –>3, 6+6=12–> 3. So you get 333.
1333 is 13 years after 1320. 2020 is 13 years after 2007.
Perhaps the bitcoin bubble crash will wipe out fortunes across the globe.
I’d count on it, and with all the international exchanges crashing … a crash-a-bration!
Some good, simple trading rules here: http://www.zerohedge.com/news/2017-12-08/top-5-lessons-trading-anything
12/10 HC Venus is conjunct the HC node of Mars. This will give a high. But 12/12 will be a more significant high.
The strongest day this month is 12/22. So the market will keep consolidating into that date. For the longer term we see Vix gives a long term low 1/12/18, so that will be a high in the market,
This 12/16 is a very strong date and will act as a magnet. 12/15 is a dark day (Carolan). 15 is also opex and opex weeks are often bullish.
12/13 -14 will bring a low before we are up inyo 12/15. 12/18 is a mercury date and will bring a low.
After 12/22 things will get more volatile with a low 1/1/18. 12/24 is the high in the outer planet velocity, This date will be tested.
12/8 was 5 2/phi years from the 2011 low. So that was also a strong date.
Many long term cycles are turning but the market needs to test 12/15-16. Time is running out. 12/12 we will see the start of a cycle down into 1/1/18.
Volatility will rise in steps. After Opex more volatility and after 22-24 again more.
I expect the low around 8/20/2023. But there wil be time enough before we get there to fine tune.
In short; 12/8-12 strong turn window, but 12/22-24 will bring capitulation.
Cheers,
André
Triangles galore! We apparently ended a smaller one to end yet another small fourth with a thrust out of it at the end of the session Friday. The upward thrust has to be some kind of fifth wave but we are still not done yet I don’t think. It could have completed the C wave of a larger triangle, possibly a D wave. Either way, when the current larger triangle is complete , the implication is THEN, the FINAL WAVE! Good things come to those who wait…even if NOT patiently.
Nested 1,2 waves also a possibility…look and meandring not quite right imho.
Have a great weekend everyone…!
verne,
veeeeerrrrrnnnnneeee!!! b.r.e.a.t.h.e…………. now i am “confused”. are you professing to seeing “this” as your triangle? https://invst.ly/61lv0
so at what price level do you “throw” out your triangle option??
Slightly different labels with D done or completing soon. If E takes out C low could still be running or barrier but I would discard the triangle idea in favor of nested first and second waves complete….and you think YOU are confused??!! 🙂 🙂
The larger context of the magnitude of the trend change we are ecpecting informs my own thinking about the day to day price action in the market. Triangles and diagonals represent ongoing bull/bear contests, and with regard to wave persomality indicate resistance to an impending change of trend. When this market finally turns, in my opinion attempts to resist will be akin to a sand castle resisting a tsunami. There will be NO UNCERTANTY…
verne,
so, triangles for me = consolidation, and will ultimately resolve itself in the direction of trend.
i subscribe to your expectations of a swift/collapsing fall in prices – although moments before an “avalanche”, all remain blessed and quiet and “fluffly” serene………. i guess that “could” be confused with a triangle……….. to some…………….. :-)))))))
Yes indeed! The complacency (read arrogance) again hit historic unprecedented levels once again on Friday and the insane cohort continues to short vol futures as if there will be no accounting for that kind of madness, Even more remarkable it came on stark divergence with former all time highs in the market. Who exactly are these fools? Then again, they may have no choice but to keep dancing until and unless the music stops….
A new post is live at: https://worldcyclesinstitute.com/christmas-stalking/
This website is for educational purposes relating to Elliott Wave, natural cycles, and the Quantum Revolution (Great Awakening). I welcome questions or comments about any of these subjects. Due to a heavy schedule, I may not have the time to answer questions that relate to my area of expertise.
I reserve the right to remove any comment that is deemed negative, is unhelpful, or off-topic. Such comments may be removed.
Want to comment? You need to be logged in to comment. You can register here.