
There was some attention paid in the free blog to the impending “crash” and the suggestion that it must be an EW third wave, due to it’s intensity, with the assumption that the market just keels over at some point and heads down immediately in a third wave, somehow skipping over the requirement for a first and second wave, in defiance of the Elliott Wave Principle.
I’m sensitive to these suggestions that somehow “this time is different” and so this is perhaps an opportunity to revisit Elliott Wave history and see what’s historically happened with a major top. So, let’s use 1929 as an example, since it’s such a dramatic one (but you could just as well use 1987 or the 1973/4 bear market, or in fact, any of the crashes in the 1800s—there were lot of them). The pattern in much the same across all market “crashes.”
It also shines a light on my contention that “picking a top” really isn’t that important. For an Elliott-waver, the top is always at the end of the final fifth wave (that never changes) so that the path to the top is simply a case of counting waves, which allows one to make money on both sides of the market, simply by anticipating turns.
The other influence on my thinking in this regard is the definition of a “crash” as being something that is unexpected and unforeseen until the moment it happens. Nothing could be further from the truth. In fact, the new trend will be marked by five waves down and three waves up to at least 62% of the drop from the top, AFTER we’ve seen the top.
So … there’s no real advantage to having a date, if you can count waves. I can play the final wave right to the end and then catch the top within the first set of waves down. End of story.

Yogi Berra is generally regarded as one of the greatest catchers in American baseball. But he was much more than that, of course, to his fans. He first coined the phrase, “It ain’t over till it’s over” in 1973. He became internationally well-known for other pithy statements like, “It’s like deja vu all over again,” and “You can observe a lot by watching.”
Most of these truisms has an element of “the obvious” in them, and “It ain’t over till it’s over” certainly fits this rally.
This extraordinary “blow-off” rally has gone on far longer than anyone really thought it would, but that’s what rallies at a major top are supposed to do, and this one is a 500 year top—the largest bubble top in all of history!
There’s more to come but we’re measuring in weeks now rather than months, in my humble opinion.
It’s somewhat gratifying to see all the currencies (including the US dollar) and US market aligning in their movement (they’re all in corrective, most travelling towards the apex of a fourth wave) turning at the same time. This is something I’ve been watching at commenting on for about a year and half (although I’ve certainly received enough flak for it). This is yet another element the market employs to help us anticipate the final turn down.
But, back to that “review” of the 1929 so-called “crash.” What’s important here is that, counter to “market lore,” we never have a sudden, unexpected crash. Tops always provide lots of warning. However, the pundits and others (the “pundit herd,” perhaps) wakes up at about the time of a larger drop and because the herd hasn’t been paying attention, the sudden drop is labelled “the crash.” We know differently.
If you want to know the future, first take a really good look at the past.
A Look at the Fall
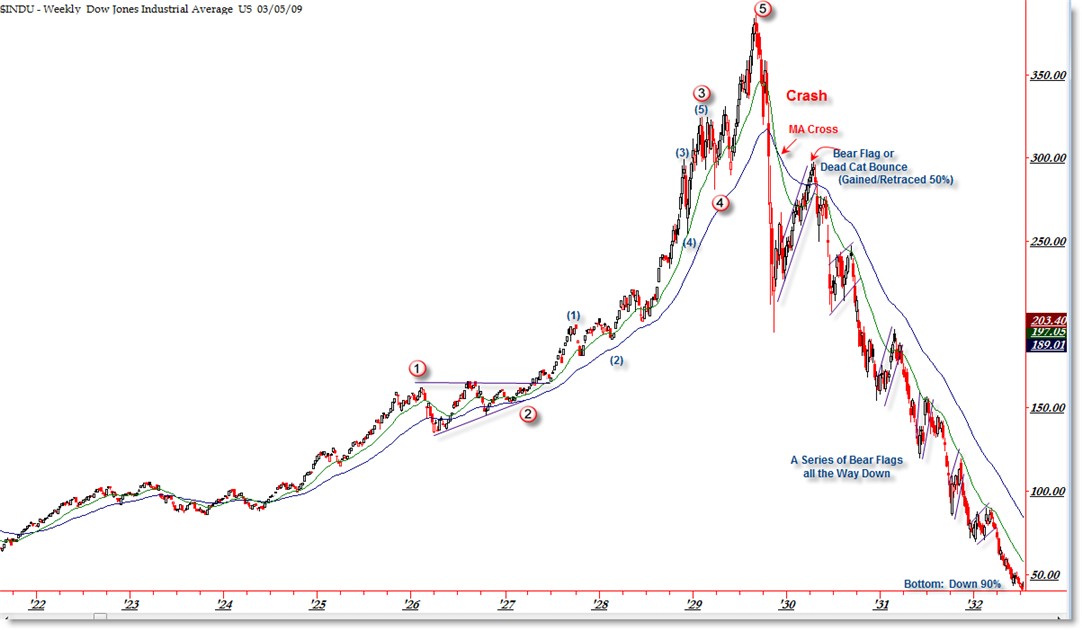
The chart on the left illustrates the potential gravity of the coming drop coming this fall (click to expand).
When five waves up are complete, that’s the end of the rally. We’re virtually there, but we’re virtually alone as traders, because volume is almost non-existant.
The entire drop is in 3 waves (a zigzag). The A wave will be in 5 impulsive waves to about the half-way point numerically. Then we’ll head up to sideways for at least a year. The final wave down will be a stair-stepping affair, the longest wave (in time) of the entire process. I give it five years roughly to reach the bottom (below 3K in the DOW).
More to come as we move closer to a top over the coming weeks. It’s always rather sobering to look at this chart.
Unexpected Crashes are a Misnomer
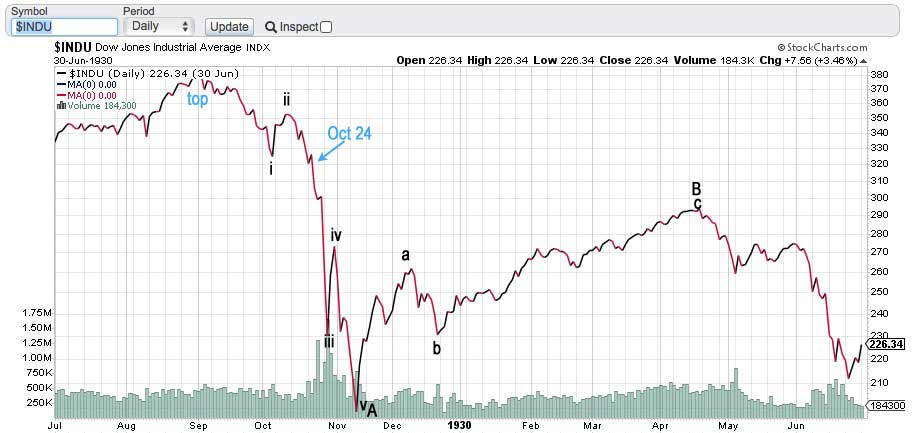
Above is a daily chart of the DOW from July 31, 1929 through July 31, 1930 showing the top of the so-called “crash.” However, the top of the market was actually September 3, 1929 at $381.17, while the crash date was attributed to October 24, 1929, after the market had already fallen 15% more than a month and a half after the top. I’d say that was “fair warning.” Expect the same phenomenon this time.
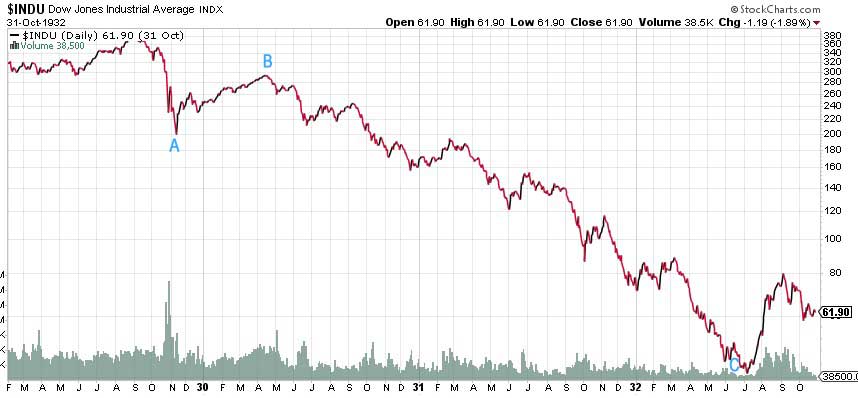
Above is the daily chart of the DOW from January 31, 1929 through December 31, 1932. This chart shows the extent of the entire 1929 stock market crash. You can see that the overall structure is a 3 wave drop, the C wave very much longer than the A wave. Keep in mind that this is a log scale and so the distances are not arithmetic.
The A wave was comprised of 5 waves, as was the C wave. This was corrective zigzag and I’m expecting a similar pattern this time around. These huge crashed don’t change much. They’re expected to be in 3 waves and to retrace up to 90% of the previous rally, reverting to the previous 4th wave level, which in this case, was in 1974. In short, we have a long way down to go.
Nobody, and I mean NOBODY (in the herd) will see that coming, and many won’t see it in its wake, until they’ve had the last dime sucked out of their bank accounts. Such is human nature.
_________________________________
the real deal SM 2
The real deal …‘Educational, insightful and thorough market analysis for all levels of traders. It’s Elliott Wave at its best….Peter Temple is the real deal’ —SM |
Get an upper hand … JC 2
Get an upper hand in trading …Seeing all the different currency pairs and the wave structures and hearing you explain why this has to do that on a nightly bases gives one a upper hand when trading. Elliott Wave applies to all stock and indices and can be applied to any candlestick chart. If someone ask what you want for Christmas – Tell them a membership to Peter’s “Traders Gold!”—JC |
Rise above the rest … SM 2
Rise above the rest …I have only ever met a few people who, in their chosen fields (astrology, medicine, music, martial arts, technical analysis), rise above all the rest and you are one of them…you have ‘the gift’…and that’s why I’m a Trader’s Gold member. —SM |
Couldn’t be happier … KK 2
Couldn’t be happier …The analysis and insight you provide is simply amazing! I’ve been trading the futures and equity markets for well over thirty years and usually average around 5% monthly. Since joining your Traders Gold Service two months ago, that number has better than doubled. I couldn’t be happier.—KK |
A true expert in Elliott Wave FL 2
A true expert in Elliott Wave …You are a true expert in EW analysis. What you provide is not available anywhere and is priceless. Subscription on your services is the best thing I have ever done. Many thanks for your effort to make me a better investor. I now have more trust in my investment decisions. I hope you will continue the excellent work! —FL |
Tops in your field DZ 2
Tops in your field …You are tops in your field. Tried to follow Elliot Wave international for years. They were always behind the market. After discovering you, I perceive that you are an expert in reading the waves, which puts you way ahead of the rest of your peers. And you can read the Waves like you are reading tomorrow’s financial section. I pray you stay healthy. —DZ |
Have not had a losing week RW 2
Have not had a losing week …I have been with Peter almost a year. The only thing that matters is have I made money with his service. I think I have finally turned the corner using Peter’s EW. I have not had a losing week in the last 5 months. Thanks Peter, for your amazing amount of hard work. —RW |
The best of them JL 2
The best of them …Last couple of years, I subscribed to several ‘market traders’. You are by far the best of them and the personal contact is awesome. Daily and daily updates are very well written! Besides your expertise in EW, I also like your cycles analysis. Best investment I ever made! —JL |
The Market This Week
Here's the latest daily chart of ES (emini futures)
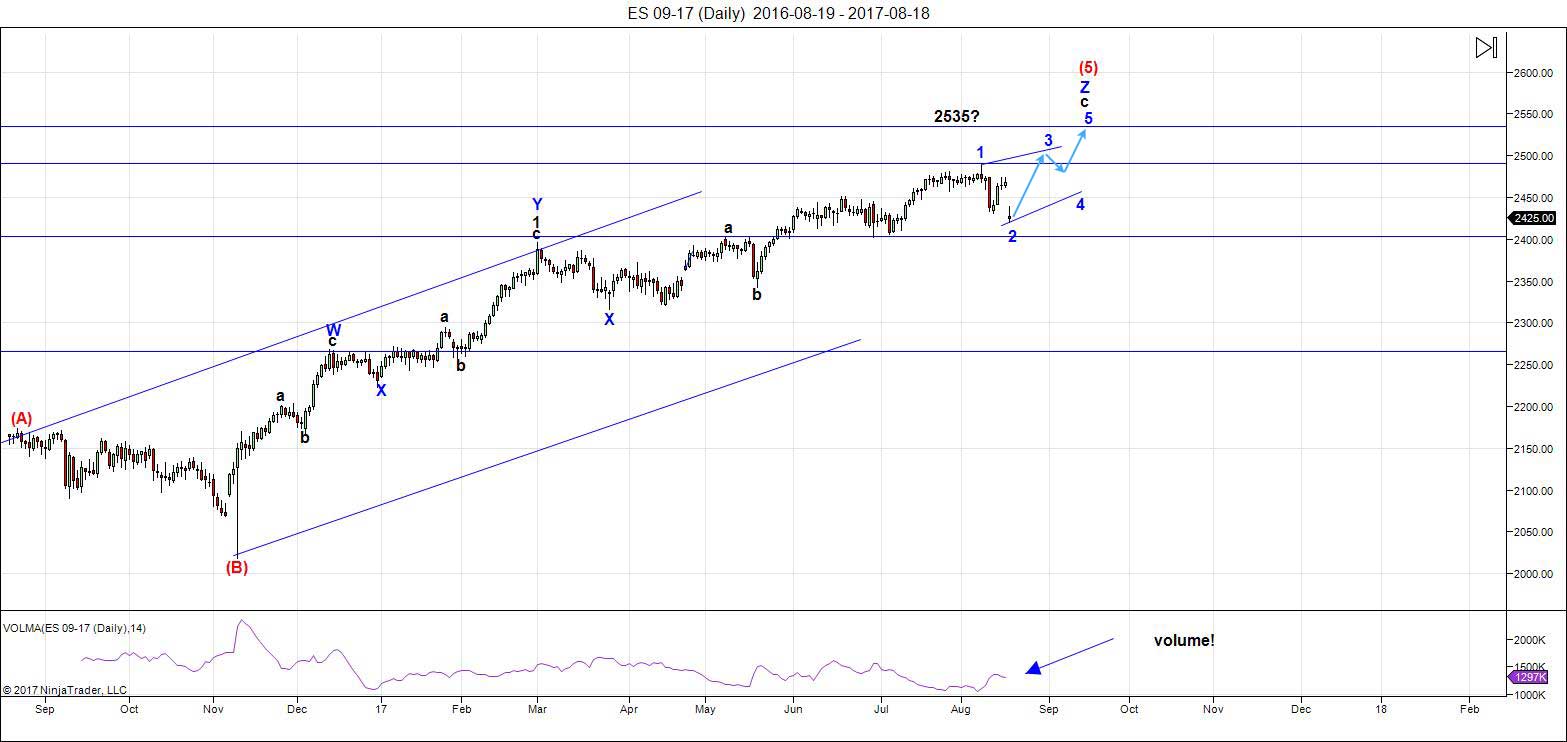
Above is the daily chart of ES (click to enlarge, as with any of my charts). After dropping last weekend, we took the entire week to cement our position in what looks like the bottom of a second wave of an ending diagonal.
We should start to head up into the third wave of the ending diagonal at the start of the week. Monday, of course, is also the "American Eclipse."
While ES/SPX appear to be in ending diagonals, NQ requires 5 waves up to a final high. It's completing the 5th of a fifth to a final top. Both finishing structures have good opportunities for determining where the top will be beforehand. We need to conclude the A waves (or 1st wave, in the case of NQ) in each case to give us an initial projection for the top.
In an ending diagonal, we have three waves left to go until the very top. In a five wave structure, there are, of course, five waves. How they will synchronize will be interesting, as they will have reach the final all time highs at the same time.
If we break 2400, something else is happening and that something else might include the potential that the top is already in.
USD currency pairs are also in their final waves and so they should all converge on their final targets together.
Volume: Note that volume now expands with selling, but drops considerably when the market heads back up. This is yet another signal of an impending top.
Summary: The final wave five in ES and SPX is in progress. Although early to call an ending diagonal, deductive reasoning has served to eliminate other potential patterns. Ending diagonals are final waves and mark the end of a trend.
______________________________________
Sign up for: The Chart Show
Wednesday, August 23 at 1:00 pm EST (US market time)

The Chart Show is a one hour webinar in which Peter Temple provides the Elliott Wave analysis in real time for the US market, gold, silver, oil, major USD currency pairs, and more. You won't find a more accurate or comprehensive market prediction anywhere for this price.
Get caught up on the market from an Elliott Wave perspective. You’ll also get Andy Pancholi cycle turn dates for the SP500 for the balance of the current month. There’ll be a Q&A session during and at the end of the webinar and the possibility (depending on time) of taking requests.
All registrants will receive the video playback of the webinar, so even if you miss it, you’ll be sent the full video replay within about an hour of its conclusion. For more information and to sign up, click here.


Peter T
Thank you very much as you and i are now in complete agreement .
i am now much more focused on the wave count vs time since i think
time has essentially ended ( minus a few details of course )Our wave counts
are a bit different yet come to the same conclusions .
All in all i must say i agree and i am very thankful for your free updates .
Great job navigating this market as well as the note in regards to the 2400 level.
Ed
In a nutshell Peter T has simplified what i wrote in response to your question on the previous thread .
Thanks for this excellent website and the education about EW. I agree next week should be up, LizH not withstanding.
I will sell very quickly tho’ if market does rally as end of week and following week are bearish in PALS (post new moon, approaching south declination, post perigee).
Peter T,
What is the significance of the 2400 level? I am assuming it has to do with price entering a level that violates something from an EW standpoint! Thank You!!
Ed, 2400 in ES is the previous 4th wave. We’re currently in the fifth wave. If we drop below the 4th, we won’t be in the fifth wave any more and the ED will break. That’s for starters.
Thank You Peter T…appreciated!
It appears to me that a number of bearish rising wedges have been decisively broken with price descending back below the lower boundary of the wedge. While I expect a move back up to test the wedge underside Monday, I am personally expecting more downward movement with increasing momentum next week. This market is as slippery as an eel and of course I could be entirely mistaken, Price will tell all….
Kind of agree with you Verne. Can’t sell until Tuesday (purchased with unsettled funds), so hope sell off waits until Tuesday.
Although I never trade with margin, I do have it available in all my accounts as it avoids the problem of unsettled funds. It is ctitical for my short term trading account to be able to execute trades nimbly in a fast moving market. It may be worth it to upgrade your account.
True, will look into it.
May stay fully invested until Friday. Guessing that market will drift higher based upon PALS, lack of news. Next week should see selling tho’ based on PALS.
If you have to short where will you short..i know we use options so cant short early…how about 2460/65 expiring in 2 weeks.
Bill, I don’t use options any more. The time value decay has proved too expensive combined with vol flux causing winning trades into non winning so I am using etf now. I won’t be shorting this year, but will be exiting my long position by no later than this Friday.
ES daily chart
including high and low daily bars
first leg down 4 bars ( top and bottom included )
the initial drop was from 2488.50 to 2430.25 = 58 1/4 pts down
the next decline after the bounce to 2474 if its going to equal
the last would target a low on monday at 2415.75
having not ever dealt with a solar eclipse in the united states before
ill just say that it hits the Oregon coast around 906 am PDT and leaves the east coast around
around 406 EDT . no opinion to it all
ES though around 2415.75 id not like to see broken and specially not a close below it .
that’s it for me
good luck everyone
Nasdaq 100 futures
NQ
the drop from june 9th to july 3rd lasted 17 trade days
the drop from june 27th is 17 trade days today yet not
near the same decline .
when looking at the major stocks that move both
the dow and the nasdaq 100 the same 17 trade day
time period shows up and almost the same point decline
as well .
To go 1 further from June 9 to July 27th was 33 trade days
and from July 3rd to today is also 33 trade days .
Id say today has the right fit for a bottom .
The august 16th high is now the key resistance that must be taken out
Packing my stuff and out of touch today .
2415.75 still important as i see it on ES
27 day forecast updated
https://s30.postimg.org/lzqmoo2ht/27_day_forecast_updated.gif
Thanks Tom 🙂
“Years ending in 7: Stock Market tends to have strong downward bias, especially from Aug-Nov (even if omitting extreme case of 1987)” – The Leuthold Group | August 22, 2017
https://twitter.com/LeutholdGroup/status/900003376288727040
“was August 8, 2017 analogous to September 3, 1929?” – rotrot | August 19, 2017
https://worldcyclesinstitute.com/a-question-of-probability/comment-page-1/#comment-21213
Peter T,
What are the chances we have not seen wave 4 low yet as you originaly predicted it will reach below 2401, may be a retrace to 2460 area and then move down.
Extremely small chance. In ES, we’re in wave 5, based upon my current count, and expecting a new high.
Valley,
why dont you use option spread with 2 to 3 week time, it works much better.
Ok. Thanks!
I am guessing we are at the peak of SPY (maybe 1 to 2% higher this week) and next two months will touch 10 to 14% lower.
Peter T,
Can I ask you if you also have the same thought of Valley that next two months will touch 10 to 14% lower?
Jas
I don’t know about the exact timing or percentage, but let’s put it this way: I wouldn’t be surprised at all if that was the case.
Thank you!
Price action yesterday was fascinating. As expected, they really ramped the pairs trade with a crush of the Yen and volatility and an amazing juicing of equities. As expected, it seemed to me that price move back up to test wedge undersides, and despite the mania of yesterday’s move, had all the classic symptoms of a dead cat bounce, including pathetic volume. I am expecting VIX to start punishing the short positions with an initial reclaim of the 200 day MA, and the beginning of the mother of all squeezes, as these massively short positions slowly come to the realization that this time they are on the wrong side of the vol trade… 🙂
The size of total assets of SVXY has doubled in August.
This can be epic trade
watch the SVXY charts…much better than watching the VIX charts…
Yeah like bitcoin
Somebody really goes crazy shorting VIX and gold
VXX had a four for one reverse split today. Should eventually be another great candidate for a short volatility trade.
PALS balance of week. Perigee effect over and now neutral. Declination entering a very positive few days that ends on Sunday. Phase post New moon still ok until Friday. Seasonals, mid August somewhat bullish. Lack of real news effecting market somewhat bullish. Guessing buy mid day weakness on Thursday will yield a 1% gain if sold on Friday’s close.
Good Call Valley, whats in for next week, I think we might fumble here if we have to revisit 2400..are you planning to short
Stocks Have Soared 17% on Average After the Last 15 U.S. Solar Eclipses
http://time.com/money/4908760/solar-eclipse-stocks/
Peter t,
Usually how long is the wave 5 and how about this time you think?
I’ve been quite vocal about September as a top.
Thank you for your reply.
Peter G,
Do you have any thoughts on the article posted above by Jas on the bullish resolution of the recent solar eclipse? You seemed to be familiar with Steve Puetz’s work.
Ed,
Sorry for my typo. His name is Peter Temple.
Indeed I am, Ed, but the stat by Jas has nothing to do with the Puetz research. I did, in fact, go back to look at the data for each total solar eclipse visible in the US since 1918 and was surprised to find that the claim is correct. There have been 15 prior total solar eclipses visible in the US since 1918 and in every instance but two, stock prices were higher a year later. My fact check was simple. I just looked at the monthly close in the month of the solar eclipse and then looked at the monthly close 12 months later. The only exceptions were, as noted in the link provided by Jas, the 10-2-59 eclipse and the 7-10-72 eclipse. The former showed a 9-10% decline while the latter, after going mostly sideways over the next year, ended down 4.7% exactly one year after the eclipse. The difficulty, of course, would be to establish any causal relationship although an 87% success rate, despite the fact the market tends to go up over time, makes for a vivid statistical argument. It’s certainly not what i’m looking for…
Peter G,
Very good information and much appreciated! EP
There have been 15 total eclipse events to affect at least a portion of the continental U.S. over the past 150 years (since the year 1867). These were in 1869, 1878, 1889, 1900, 1918, 1923, 1925, 1930, 1932, 1945, 1954, 1959, 1963, 1970, and 1979. Of these, only one traversed the entire country coast-to-coast: the event of 1918.
Hi Joe, I don’t claim your source is wrong and mine is right, and I agree with the 1918 being the only other one of past 99 years to traverse the US, but here are the dates I have for all total solar eclipses visible at some point in US since 1918: 6-8-18, 9-10-23, 1-24-25, 6-29-27, 8-31-32, 2-4-43, 7-9-45, 6-30-54, 10-2-59, 7-20-63, 3-7-70, 7-10-72, 2-26-79, 7-22-90, 7-11-91, and 8-21-17. Next due, 4-8-24… FWIW
1930 (April 28): This was a “hybrid” eclipse event, meaning that it started off and finished up as an annular eclipse rather than being a total eclipse for the entire duration. The path came ashore in northern California and exited the U.S. into Canada via central Montana.
Eclipse and Hurricane Harvey (category 3 soon), coincidence?
PALS suggests next week has high likelihood of touching 3 % on the downside for SPY.
I am going to put a option spread next monday hope it stays up till then.
Although I am allergic to options, I bought a put option (low vol, limited time premium) that expires next Friday. Next week has the opportunity to be great for short selling: PALS (declination, distance, and phase all negative), seasonals weak (end of August), just had eclipse, Hurricane Harvey, post Hawkish Fed speech on Friday, CNBC talking down FANG stocks, Trump below 50% approval, etc..
Pretty accurate calls this week Valley. I did not think you would be right after I saw all those broken wedges but you were. Price not only came back up to test underside but has stayed pretty close despite the whipsaw this week. The bulls and banksters have done a creditable job keeping a broken market elevated this week. Good call! 🙂
Verne, the DOW will be 100,000 somewhere in the future. Based upon the previous century returns probably in about 30 years from now. This is due to inflation of the monetary system. This is based upon a compound rate of return of 6% per year which has been the average over the last century. Similar rate of returns applied to previous two centuries as well. As long as the economy innovates, the DOW will elevate in price in a fiat monetary system.
Good job on your nimble Vix trading of late. Keep sharing please!
I do think we will indeed see an era of hyper-inflation after the coming deflationary depression when precious metals and precious metal stocks will go on to un-imagined valuations, but first, definitely deflation as trillions in global debt is destroyed owing to unstoppable defaults. Some powerful cycles are in play during this time window and suggest we should be looking for a top around now. Long upper wicks of late have been presaging a market plunge, brief though it may have been, and we have gravestone dojis in both SPX and DJI on Friday so it looks like more decline next week. There has been absolutely no capitulation in the VIX short sellers and whether they can maintain short positions this cycle remains to be seen. I think we should reasonably expect at least one more spike the next week or so if VIX can stay close to its 200 day SMA. It remains unclear to me if we have a top in or not. I am inclined to go with Peter T’s call for one more high but the ED count is not obvious to me and I still think we could be in an incomplete fourth wave.
Key is nominal value. A 6% compound increase year to year compares to real inflation rate. This is not unusual and quite sustainable. Debt between buyers and seller is an written agreement which can be modified if both agree. I don’t see why a destabilizing unraveling is preferable to these parties than a smooth transition to a new system.
Making these kinds of transition “smooth” is always done at someone’s expense I am afraid. Greece is a great example. When you look at the fact that the notional amount of the actual value at risk is many times the global GDP, I am hard pressed to imagine how what is coming is going to be made “smooth”, no matter how many people are wiped out. I feel sorry for clueless depositors who have been already robbed even though they don’t yet know it. They will when the bail-in provisions newly written into financial regulations takes effect. I suspect that what we are going to see is carnage, and anything but smooth. Sadly few are aware of, much less taken steps to limit their exposure.
A leisure economy in the Mediterranean sea region that is the least among the EU economically and was included for geographic pragmatism is not exactly in the main stream. Major economic countries may settle out their cross border commitments without need for defaults.
verne,
what precaution would you suggest lying being in cash and buying land/house as asset instead of invested in market.
Your comment about Greece being a leisure economy and not being main stream made me smile. Greece is a member of the European Union and what happened there has to be considered in that larger economic context. Here are a few interesting facts. The notional value of Greece’s debt that caused them so much pain is actually less compared to GDP than several of their fellow members, and the fall-out when say Italy collapses could well bring down the entire Union.
If you missed the fact that what happened in Greece was a test case you really missed the most critical lesson of that disaster. It was the very first time a banking institution was permitted (actually forced) to literally steal the money of depositors, and after Greece, the bail-in policy was formally written into international banking regulations, including banks in the US. Here we have another stark example of how useless American reporters and news agencies have become. There was little reporting on this seismic change but the fact is that the money you have in the bank does not belong to you, whatever you think contrary-wise, it belongs to the bank. So if you think what happened in Greece is not “main-stream” you simply have not been paying attention! 🙂
The bottom line is you should not keep any money in banking institutions that you cannot afford to loose. At some point the herd is going to figure this out and the fractional nature of currency is going to spell absolute disaster for those who are too late to realize their risk.
Bang on.
🙂
Peter G
I’m not claiming to be right or wrong either .
After seeing the claim ( jas link ) I did a quick search .
Here is the 2 links I found . One a little more informative
Than the other and the years don’t match .
I don’t have the time at the moment to do into it
So I just highlighted the notes in reference to
April 1930 ( big bear market into 1932 )
Also not mentioned the August 1932 low is worth
Looking at .
Anyways I have no proof which dates are the correct ones
Yet I will look , maybe it’s a bit of both in which case
There is more dates than that link from jas shows ?
This first link compares to the article and with you
I’ll assume ( just point out discrepancies here )
http://www.eclipse2017.org/2017/eclipse_popup.htm
This 2nd link gives more info
https://www.wunderground.com/cat6/historical-perspective-total-solar-eclipses-us
Last weekend I said 8/29 was significant. This date will mark the start of a w4 down into 9/12. 9/28 will be the start of a bearmarket.
The market is very fragile. Not because of Hindenburg omens but simply because of Gann theory. When time and price angles are equal we see a significant event. So far I have seen 4 indices doing that : DJIA, Stoxx600, Nasdaq and Wilshire5000 and i will keep monitoring other indices..
8/29 will start a cycle down into 9/12. But next week will show the first 2 legs so 9/4 things will get more volatile. Tuesday high, wednesday low, Thursday high and friday low. Friday the job report and monday labor day, 9/12 very vibrational.
During the week volatility will go up 8/29 and 8/31 strongest days.
André
September stream attached
https://s2.postimg.org/eve3xzd89/27_day_forecast_september.gif
Thanks Tom!
Thanks Andre!
Thanks André!
Hi Andre, curious if 9/12 still looks to be a low? Thanks much!
P
Yes; still think 9/12-13 will be a low before we go up into 9/21-ish for a high. Then down again into 9/28 and a final high 10/4-5 before things get wild.
No trading advice; just my expectations.
Appreciate it Andre! Of course I understand that. I am solely responsible for my own trades. I bought September SPY puts on Thursday and suffered a paper loss of 35%. But your projection in great part helped me hang on. No one studies harder than you and I admire that! Short of time and intelligence, I am following giants like you sir. Please keep sharing and I believe good karma will reward you. Thanks again for taking time answering my Q 🙂
9/6 will be the high.
Hi André,
It looks like Sep. 6 (lower) high! Just put in an order of buying the Sep. SPY puts above 247. Thanks for your guidance 🙂
My site has been down for several hours today, so the blog post is going to be very late, and I may do it in two parts …
A new partial post is live at https://worldcyclesinstitute.com/the-hopium-epidemic/
Due to the problems with my site being down on the weekend, there’s a portion of this post missing. More to come later this morning.
This website is for educational purposes relating to Elliott Wave, natural cycles, and the Quantum Revolution (Great Awakening). I welcome questions or comments about any of these subjects. Due to a heavy schedule, I may not have the time to answer questions that relate to my area of expertise.
I reserve the right to remove any comment that is deemed negative, is unhelpful, or off-topic. Such comments may be removed.
Want to comment? You need to be logged in to comment. You can register here.