
Eliminating the Improbable and Impossible
 The Elliott Wave Principle is a set of rules and guidelines for identifying recurring patterns in the market. The bulk of the work I do across ten specific assets on a daily basis involves deductive reasoning. There are thirteen simple patterns that repeat over and over again in the market. There are no other known patterns that make up either of two types of waves—motive (trend waves) and corrective waves.
Staying completely objective and paying attention to the intricacies of wave structure is the key to good analysis. There is seldom more than one valid wave to count a wave sequence. It’s the ability of the analyst to recognize these patterns and properly use the host of rules and guidelines to accurately predict future market movement.
“Despite the fact that many analysts do not treat it as such, the Wave Principle is by all means and objective study—” a disciplined form of technical analysis.” If you do not believe what you see, you are likely to read into your analysis what you think should be there for some other reason. At this point, your count becomes subjective and worthless.
Without Elliott, there appear to be an infinite number of possibilities for market action. What the Wave Principle provides is a means of first limiting the possibilities and then ordering the relative probabilities of possible future market paths. Elliott’s highly specific rules reduce the number of valid alternatives to a minimum.
Under only the rarest of circumstances do you ever know exactly what the market is going to do. You must understand and accept that even an approach that can identify high odds for a fairly specific event must be wrong some of the time.
Of course, there are often times when, despite a rigorous analysis, there is no clearly preferred interpretation. At such times, you must wait until the count resolves itself. When after a while the apparent jumble gels into a clearer picture, the probability that a turning point is at hand can suddenly and excitingly rise to nearly 100%. It is that’s really inexperienced to pinpoint a turn, and the weight principle is the only approach that can occasionally provide the opportunity to do so.
The ability to identify such junctures is remarkable enough, but the Wave Principle is the only method of analysis that also provides guidelines for forecasting. Many of these guidelines are specific and can occasionally yield stunningly precise results. If indeed markets are patterned, and if those patterns have a recognizable recognisable geometry, then regardless of the variations allowed, certain price and time relationships are likely to recur. In fact, experience shows that they do.” —The Elliott Wave Principle, Frost and Prechter
The Elliott Wave Principle (the book—you can find it in my book list) is a starting place to learn how to predict the market. Most people will not take the time to learn it, because it’s complicated. Many analysts don’t spend the time to learn it fully or don’t comply with the rules (which cannot be broken) or guidelines. Therefore their counts are inaccurate and useless.
For example, there are so many who throw around the term “impulsive wave” without the slightest idea of the rules for the formation of one. There are a greater number who pay absolutely no attention to the subwaves, which most of the time, can confirm or undermine a carefully considered count. There are also many who don’t look across multiple related indices to ensure they support the prediction. And then there’s the issue of “the right look” to a motive wave. If you don’t have the innate ability to recognize patterns, this can be a prediction-breaker alone.
All of these facets of a disciplined approach are critical in defining the future movement of the market based upon its current state. If done properly, I have found it much more accurate than any other method of analyzing the market. And by the way, it works on any free market.
Many analysts provide alternative counts, which in many cases, is a safety net for their minimal knowledge of the Principle or a lack of discipline. I only rarely provide alternate counts because, as a trader, it’s difficult to act on two counts, predicting a move in opposite directions. How do you trade that situation?
As a trader, it makes more sense to have one count and know when you’re wrong. EW does that exceptionally well. However, the greater benefit as an analyst is to be meticulous in your work, objective to a fault, and follow the EW rules and guidelines.
A Look at the Fall
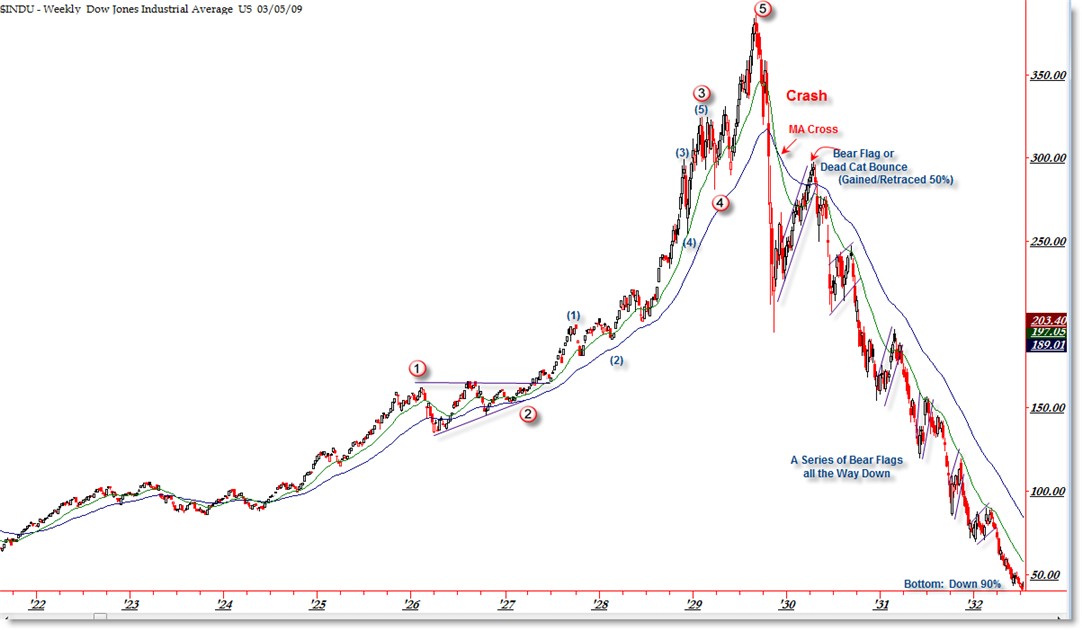
The chart on the left illustrates the potential gravity of the coming drop coming this fall (click to expand).
When five waves up are complete, that’s the end of the rally. We’re virtually there, but we’re virtually alone as traders, because volume is almost non-existant.
The entire drop is in 3 waves (a zigzag). The A wave will be in 5 impulsive waves to about the half-way point numerically. Then we’ll head up to sideways for at least a year. The final wave down will be a stair-stepping affair, the longest wave (in time) of the entire process. I give it five years roughly to reach the bottom (below 3K in the DOW).
More to come as we move closer to a top over the coming weeks. It’s always rather sobering to look at this chart.
______________________________
The best of them JL 2
The best of them …Last couple of years, I subscribed to several ‘market traders’. You are by far the best of them and the personal contact is awesome. Daily and daily updates are very well written! Besides your expertise in EW, I also like your cycles analysis. Best investment I ever made! —JL |
Rise above the rest … SM 2
Rise above the rest …I have only ever met a few people who, in their chosen fields (astrology, medicine, music, martial arts, technical analysis), rise above all the rest and you are one of them…you have ‘the gift’…and that’s why I’m a Trader’s Gold member. —SM |
the real deal SM 2
The real deal …‘Educational, insightful and thorough market analysis for all levels of traders. It’s Elliott Wave at its best….Peter Temple is the real deal’ —SM |
Have not had a losing week RW 2
Have not had a losing week …I have been with Peter almost a year. The only thing that matters is have I made money with his service. I think I have finally turned the corner using Peter’s EW. I have not had a losing week in the last 5 months. Thanks Peter, for your amazing amount of hard work. —RW |
Couldn’t be happier … KK 2
Couldn’t be happier …The analysis and insight you provide is simply amazing! I’ve been trading the futures and equity markets for well over thirty years and usually average around 5% monthly. Since joining your Traders Gold Service two months ago, that number has better than doubled. I couldn’t be happier.—KK |
Tops in your field DZ 2
Tops in your field …You are tops in your field. Tried to follow Elliot Wave international for years. They were always behind the market. After discovering you, I perceive that you are an expert in reading the waves, which puts you way ahead of the rest of your peers. And you can read the Waves like you are reading tomorrow’s financial section. I pray you stay healthy. —DZ |
Get an upper hand … JC 2
Get an upper hand in trading …Seeing all the different currency pairs and the wave structures and hearing you explain why this has to do that on a nightly bases gives one a upper hand when trading. Elliott Wave applies to all stock and indices and can be applied to any candlestick chart. If someone ask what you want for Christmas – Tell them a membership to Peter’s “Traders Gold!”—JC |
A true expert in Elliott Wave FL 2
A true expert in Elliott Wave …You are a true expert in EW analysis. What you provide is not available anywhere and is priceless. Subscription on your services is the best thing I have ever done. Many thanks for your effort to make me a better investor. I now have more trust in my investment decisions. I hope you will continue the excellent work! —FL |
The Market This Week
Here's the latest daily chart of ES (emini futures)
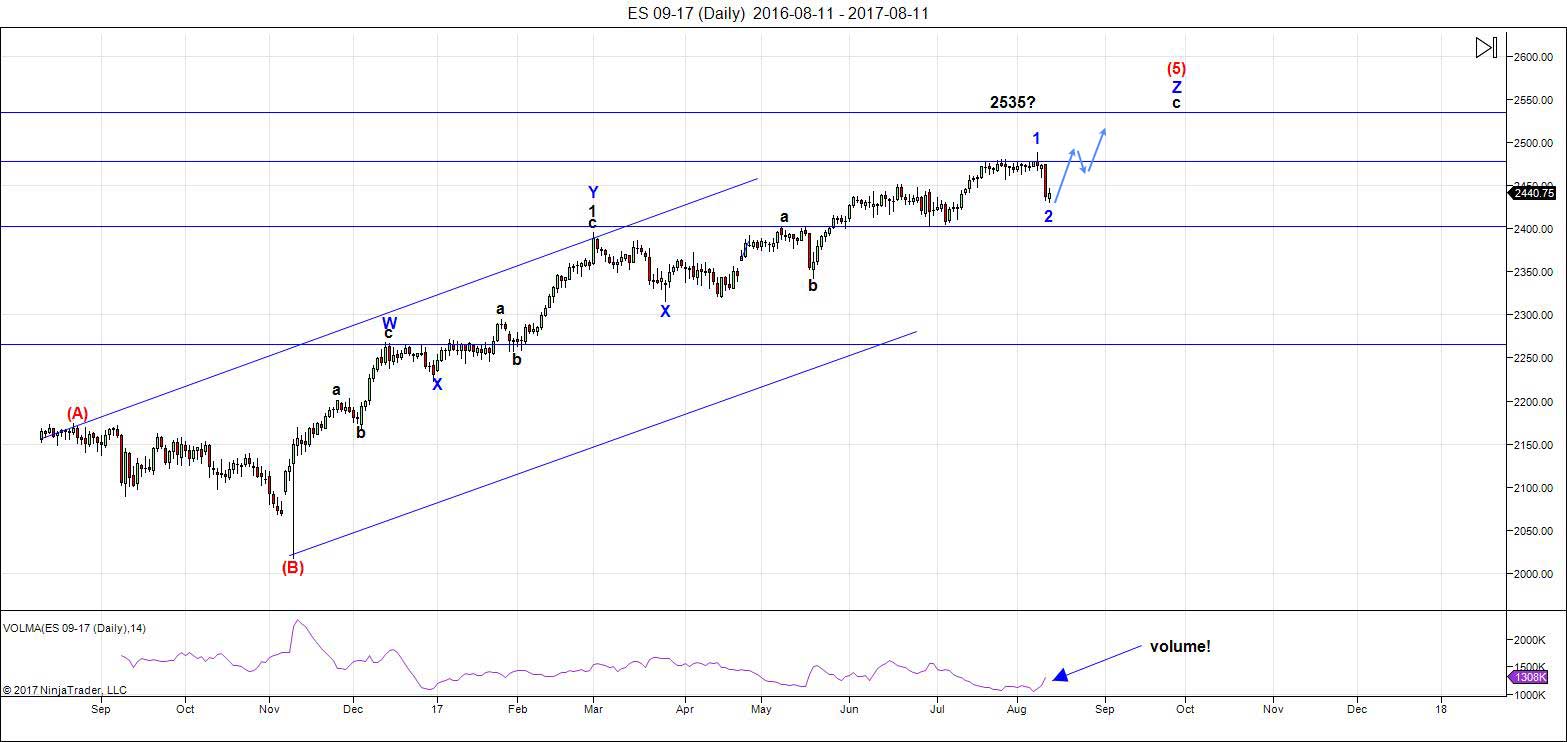
Above is the daily chart of ES (click to enlarge, as with any of my charts). This weekend, we're sitting in the final pattern of the rally from 2009. It's a fractured market with the Nasdaq slightly out-of-sync with the SP500. Rather than being a problem or making analysis more difficult, it's actually aided in firming up the most probable end-game scenario.
There are two ways to count the final wave we're in (the blue Z wave) thus far. I showed the alternate count in the ES chart last week. However, they both point to exactly the same result. The pattern of the final set of waves up (the Z waves—from the top-most X to Z on the chart) is a final third zigzag of a "triple three," or three zigzags in a row, the most you can have as a pattern. We are in the final "fifth wave" of that pattern.
The drop this week came down in two segments (an ABC wave), but measurements of both this entire corrective wave and the subwaves are "off." The lengths of the subwaves don't fall into the usual fibonacci ratios one would expect. However, the SP500 is sitting right on the 62% retrace level from the previous fourth wave bottom at ~2438. That's a very strong inflection point. At the same time, NQ completed five impulsive waves up on Friday.
There was also an issue with the final wave in SPX and ES that went to a brief new high (topping at 2488) before the drop: It was in an ABC configuration, a very obvious zigzag. This makes the entire structure from the previous fourth wave a corrective wave.
These facts (plus the position of this wave in a fifth wave location) point to only one possibility—an ending diagonal. You'll find a similar pattern in the DOW and Russell indices.
This has changed the projected "top tick" price level to possibly lower: I'm showing it here as around 2500. Of course, being we have an ending diagonal, we can expect it to go slightly higher than I project.
With the NQ and related NDX indices currently in a fifth wave, this places the two major US exchanges in sync, both finishing their final patterns (although structurally different) at the same time.
Volume: Note that volume now expands with selling, but drops considerably when the market heads back up. This is yet another signal of an impending top.
The USD currency pairs have finished their fourth waves (in conjunction with the US dollar) and have entered, or are entering the fifth and final wave, as well.
Summary: The final wave five is in progress. Although early to call an ending diagonal, deductive reasoning has served to eliminate other potential patterns.
______________________________________
Sign up for: The Chart Show
Wednesday, August 23 at 1:00 pm EST (US market time)

The Chart Show is a one hour webinar in which Peter Temple provides the Elliott Wave analysis in real time for the US market, gold, silver, oil, major USD currency pairs, and more. You won't find a more accurate or comprehensive market prediction anywhere for this price.
Get caught up on the market from an Elliott Wave perspective. You’ll also get Andy Pancholi cycle turn dates for the SP500 for the balance of the current month. There’ll be a Q&A session during and at the end of the webinar and the possibility (depending on time) of taking requests.
All registrants will receive the video playback of the webinar, so even if you miss it, you’ll be sent the full video replay within about an hour of its conclusion. For more information and to sign up, click here.


The Curse of Years Ending in Seven – David Chapman, August 12, 2017
http://www.safehaven.com/print/44660/the-curse-of-years-ending-in-seven
Nice find, Rotrot. Looks like October could be the month for sizable sell off. Post Fed rate raising. And month in which Uranus (revolution) is opposite earth (earth moves between Uranus and Sun.
Wow!
Everybody and his granny are yelling SELL!
I am looking at the structure of the wave down.
I am looking at trend lines.
I am looking at VIX.
Something just does not look or feel right about everyone talking about their sell signals.
I have NEVER seen VIX trade the way it did above the upper B band and that not be a signal that the move down was over or nearly so.
Of course with all the loud chorus of the top being in by so many – Gartman has staked his reputation on, I am thinking I must be missing something.
Then along comes Peter’s post and explains why I am feeling so uneasy!
Thanks man! 🙂
🙂 back.
Peter
i have read your update twice and i will read every word
for a third time . Your copy of Prechter and frost was dead on.
I will say that i have studied Elliot wave theory in depth and over
time i have adopted other methods that i included in my work
which include Elliot wave as well as observations on the stock
markets . what i have found in my own work is at times i do get
focused on 1 pattern and i do pay attention when something goes
wrong yet i have a very hard head and don’t accept being wrong unless
the market proves me so .
You have been focused on the ending diagonal pattern for the past
couple years and the minor versions have served you well .
your attention to detail and your objective disciplined approach
is why i read your posts. I think your going to end up being correct
is what I’m getting at, every time i have been convinced of a pattern in play
and i have followed it out and adjusted to its variations they have worked out
as anticipated.
For me personally you have helped me get back to some of the basics of Elliot wave theory and your focus on the ending diagonal has been extremely helpful
and has helped me to become more cautious and less complacent as we get
closer to this anticipated top .
Thank you
Joe
🙂
What did Gartman call? WHATEVER he says, fade, and you will win 80% of the time. As soon as he said buy oil dips (was around $50) I sold (My charts & Peter said to do so anyway, but that just increased my confidence in the trade).
I know Gartman was bullish tech sometime last month near the top. That’s when we sold the break at NQ 5990 and had a nice, steep drop.
Yeah, I think the rule is to always be on the other side of Gartman … lol.
an interesting take on north Korea
https://www.armstrongeconomics.com/world-news/war/is-kim-jung-un-blinking/
Guessing we see market up 1% this week in total. With selling commencing after eclipse on 8/21. This is based on PALS being bullish on all three factors this week.
why just one percent. Valley I am looking for sep 17 spx put spreads if we reach spx 2460/70. How are you positioning.
Summer doldrums mainly and Korea. I am in cash right now. Haven’t decided if I want to invest in this PALS up cycle given the low probability August seasonals.
Went long Monday near close.
Brilliant Peter! Let’s top out somewhere in September and have some fun, woot woot! 😀
Cheers,
W
But ,but, but, Peter…………..what about all the positive things happening? Regulations cut and millions of jobs coming back to US and a trillion dollars back into our economy all via corporate and personal tax cuts. What will they use as a catalyst for the prolonged stock market demise? If things get that bad for that long, the stock market will be the least of our problems. I don’t want to think about it today, I’ll think about it tomorrow.
Not to mention: A/I revolution adding to white collar labor savings, Robot revolution adding to manufacturing labor savings, energy revolution adding to reduced input costs for all sectors, millennial generation being groomed to be the next investment participants who need a bull market to educate them that market is worth exploring (and to form families and buy homes, furniture, and appliances).
Futures confirming what VIX predicted. I have never seen an upper B and penetration fail to predict an imminent end to a market decline. I was actually expecting a final wave down but futures saying we are already heading up. I was not too early shorting vol after all…
One reason I was expecting another wave down in SPX is that I can see a five down in ES, but only a three down in SPX. I am not sure what to make of the difference. I had assumed we were in an SPX fourth wave but that idea went out the window when we did not get a new low on Friday even though VIX made a new high. This is I guess what might be seen as a truncated fifth.
I can see five down in cash and futures for DOW so SPX is the only exception. Curious.
Verne,
may I ask you if you wright differently your pseudo (Verne, VERNE, VERNE CARTY) or that are different persons ?
Sorry for my confusion
All the same. Sometimes I forget to look at autofill an therefore the variation. I am hoping Peter can enable the edit feature as I also often end up with lot of typos when I post.
Although I will agree with you that closes by VIX above BBs tend to precede bottoms, especially after they close back inside to confirm, I would be careful with the “never” failed to predict, Verne. The most dramatic example would be October 14, 1987 (using VXO as substitute as VIX did not exist then, but they track very similarly), after which markets fell an additional 30% into crash low. Then go back to 2008 and notice closes above the BBs on June 6, September 4, September 9, September 12, and September 29… all the way down until finally the November 19 close above the BBs marked a bottom. Also look at 7-27-11 close above BBs leading to 15% + decline immediately thereafter and 9-23-14 close above leading to immediate 8.2% decline over next 3 weeks. So………….yes, VIX closes above BBs tend to mark at least short term bottoms but when this baby starts to decline in earnest, watch out for the many false “signals” we will see.
precisely!
If you pay close attention, VIX will give a clue as to when these upper B band penetrations are signaling the start of a protracted market decline and not necessarily an imminent bottom, and it has to do with how the B bands react to the upward move. If you look closely, you will see that in every case when a sell-off is developing, the B bands immediately begin their expansion outward along with the VIX rise in price and while you may see some upper band penetration, the bands move along briskly with price as it moves higher. In these cases you rarely see price moving very far above the upper B band as you normally do when a capitulation spike is underway as that too generally will come at the end of the decline.
I don’t know if this is just a coincidence or not but
looking at the NQ mini futures this morning
the previous drop june 9 to july 5 caught my attention
this morning because it looks very similar to the most recent drop .
the previous drop fell for 17 daily bars and the most recent drop
fell for 10 daily bars . 17 times .618 = 10.5 so there is a Fibonacci
relationship to these decline .
taking the point drops the previous drop from 5907.5 to the 5560.25
low was 347.25 pts and times that by .618 you get 214.60
the high on july 27 was 5995.75 minus 214.6 you get 5781.15, yes it
was 20 points off but not bad considering the Fibonacci relationship .
347.25 – the actual latest decline of 234.75 . 234.75/347.25 is .6760
from the low on may 18th the NQ rallied to a high in 15 trade days
from the low on July 5 to the most recent high the NQ rallied in 16 trade days
( 2 rallies of 15 and 16 trade days for a total of 31 trade days of upside moves )
counting trade days from the may 18 low to the july 5 low you get 32 trade days
add 32 trade days to the July 5th low and you get this Friday .
measuring from the swing low on June 12th the the swing low on july 5 you get 16 trade
days add 16 trade days you get the most recent high on july 27th add another 16 trade days
and you get this Friday .
Looking like we are getting the gap up for the open
should be a very interesting week 🙂
Mahendra’s outlook is very negative beginning from next week
I doubt this will happen today
yet if the Dow futures hit 22057 ill take a short position
the range is 22057-22070 , that might be to much to ask
but that’s a spot i m going to watch for the week .
21923 is now short term support for today on the dow futures.
im starting to wonder if this isnt just going to turn out as a triangle
formation . to soon to call it yet the most recent drop would be wave A
which places us in wave B rather than wave 5 which i am preferring.
this would delay the decline further out in time .
That said im exiting several long positions in stocks by Thursday/Friday
this week . ill be around 35 % long by end of the week .
I think Peter’s analysis is spot on and what the markets are all doing is lining up in ending diagonal formations All the waves going forward should then unfold as zig zags, which are 3,3,5 abc structures. The upside target of 2500 would also require the diagonal to be contracting so the waves should be getting shorter as we approach the top. I expect we will see the typical throw-over of the diagonal’s 1-3 trend-line. An Ending diagonal is one of my favorite patterns to trade since like triangles, the price action after their completion is very predictable. We will also have a good idea if this plays out where price is headed after the diagonal completes. It is not often that Mr. Market offers traders a distinct advantage with very clear EW structures and these should comprise “bread and butter” trades in every trader’s arsenal. I am uber short volatility but will have to hedge remaining short position by selling SPX puts expiring next week.
I would not be at all surprised to see the pattern complete this week. After all we did have an outside weekly candle last week and we are seeing increased volume on market declines, both reliable indicators that things are starting to get very bearish. 🙂
Joe, am also feeling last week is part of a larger structure. I had been looking for a wave 3 top at ES / SPX 2490 ish and Aug 4; pretty close to what we got. Now expecting a firstbak this week maybe to 2472, that sticking point, and then down after the eclipse into Oct 24 around 2312.
Joe,
Will you still establish a short position at 22057-22070 after Monday or was that level only for Monday?
I m sticking with plan A posted Sunday.
I do see a variable to consider yet not going to overthink
this market . I’ll know where i m wrong now that’s all that matters.
Happy Option Expiration Week 🙂
Its not to late to join the bull party 🙂
http://www.investors.com/news/schwab-tops-forecasts-as-account-openings-hit-17-year-high/
Verne. I was surprised to see your comments in respect to the over all negative sentiment in the markets. Lol Gartman does not count. I am buying anther batch ( short) short term ) I was seeing the complete opposite. Good luck.
Just bought. 2460 level
Thanks Dave!
An upper B band penetration by VIX has never failed to deliver the goods. Took nice profits on short vol trades this morning. I was expecting stiff resistance at 2470….at least temporarily….
See my response to the same comment above about the “never” and the VIX BBs, Verne. Yes, it’s a good general rule but it’s the exceptions that can kill you…:)
Absolutely Peter, and point well-taken. I tend to execute these trades in a matter of hours as scalps but you are right about those exceptions.
Ed
I was considering that for Monday only and that was
The Dow futures price not the cash index ..
I’ll watch that price level for the week regardless .
The key for me is will the market have another outside
Weekly reversal bar next week and will this week
Become an inside week ( higher low and lower high )
For me minus a few details ( the variables ) the market
Is topped . If the nasdaq 100 fails to make a new weekly
All time high and reverses down below last week’s low
Then I’ll consider the top in place . For the Dow I’d really like
To see a new all time high by Monday next week at the latest
Those are the parameters I’m looking for .
Also in regards to the Dow cash index and the spx I’m begining
To consider this a triangle . That decision I can’t make
Until we see the next decline . At the end of the day
Last week’s lows are my focal point . A failure to break
Below last week’s low leaves the triangle formation
On the table ( assuming no new all time highs )
That’s pretty much where I stand at the moment .
A triangle is not preferred by me , it’s just a possible I’m
Allowing for .a triangle would also collapse the Vic in my opinion
My intent is to reduce my risk this week .
The decision to go short will be made between Thursday
And Monday .The Dow futures 22057-22070 levels stand
As important yet they also consider a triangle possibility.
The reasons I’m staying open minded is we did get the gap
Up today . If it’s going to be a 3 wave move and a failure
To make new highs then that level would make sense .
This would imply a short term drop possibly tomorrow or Wednesday
Then another run higher into that range in wave C.
A straight up vertical run to new all time highs would in my opinion
Be the final 5th in the Dow .
I’m letting the market decide and as I’ve Said before
I avoid option expiration weeks .
Hope that answers your question
It does! Thanks!
/ym /es /nq skyrocketing to the moon after hours. /GC gold fading. https://www.wsj.com/articles/north-korea-backs-off-guam-missile-attack-threat-1502751054
Dear peter
Just need to clarify in terms of US dollar ending the
5th wave.is this the last wave down. So assuming I trade
Usd/chf this pair will reach a low when DOW jones finally peaks
And then should head up. Also euro/usd would hit peak and then down.
Is this a correct understanding?
thanks in advance . Always enjoy your posts immensely,
Best wishes from Sydney
Australia
Phil
Phil check the vid out. pretty much gives you the plan
https://worldcyclesinstitute.com/september-lining-up-for-a-great-fall/
Hi Phil,
Yes, that’s it. I see Red Dog pointed out the video (thanks, Red Dog!). I go over it with charts there. USDCHF I don’t cover, but it looks like it will come down to the 0.9074 area before it turns and heads up (at the market top).
Sincere thanks Peter and Red Dog,
I expect the Swiss national bank will be in a
Mountain of trouble once the Dow turns savagely south,
God bless , Phil
The bloodbath for SNB will come from their Nasdaq holdings. They are by far the biggest investors in the so-called FANG/FAB FIVE. The all have put in already, or are pretty close to final tops.
That situation is one of the most stunning of fiduciary malfeasance I have ever witnessed. I wonder of all those folk still holding foreign Swiss bank accounts understand the that “bail-in” rules adopted by the European Union, and successfully test-run on the hapless citizens of Greece now apply to them as well?! I suspect most of them have no clue…
Well said Verne,
Bloodbath is not an underestimate,
Clueless SNB senior management.
Phil
Interesting. I like trading USD/CHF and have been of late when I wanted to go long USD. It’s held gains & performed better than EUR in regards to being long dollars. My bottom target is near yours, maybe a tad lower. I plan on going long once it bottoms out and holding a small position with the rest of them.
Thanks peter
Aussie dollar moved up overnight so
Your video is on track for Aus/usd short term peak in next few weeks
Phil
🙂
anybody notice the temp has been cooler for about the last week or 2 ?
or have an interest in the sunspot cycle ?
http://www.solen.info/solar/
Colder summer in Calgary.
Iceagenow.com has news of cooling cycle.
Peter
Just something id like to point out to you .
I plot the sun spots as well as the 2.8 gh solar flux .
something i began doing back in around 2004 ill guess
is i started plotting zero spot days vs any day with a sunspot .
a simple +1 for a zero spot day vs a -1 for a day with any sunspot.
beginning on Sept 7 2007 the zero spot days began increasing
which changed the trend from a downward move to an upwards move.
this upward movement ( more and more zero spot days vs days with
any spots ) continued all the way into dec 8 2009 .
In short that correlated with both the beginning as well as the bear market .
over the past several months since june 2017 ( its all i have looked at even though i have more data ) im beginning to see mini versions of this .
another thing id like to mention . while it is obvious the output of the sun
has indeed collapsed the sunspots vs days of zero spots has yet to show
that change of trend . My assumption though is it will sooner rather than later
so far we have had a trend of days with spots overwhelming the days with zero spots despite the collapse in the suns energy .
while the sunspot vs zero spot chart has yet to turn a simple look at sunspots
over the past year you can see very easily that there has been an increasing
number of zero spot days . they just have not accumulated enough to turn
the trend .
No doubt in my mind there is something to this even if its a bit early and a bit late
in regards to the stock market .
that upward movement from sept 2007 to dec 2009 lasted 2 years 3 months and 1 day .
the average cycle is 120 months to 140 months low to low in the sunspot cycle .
not my study yet i have followed this guy for data purposes for a very long
time. as i try to correlate this we approaching the 100 month and have
20 to 40 months to go in this present cycle .( just using the examples i have )
the last time we had the zero spots increase vs days with spots it lasted
27 months .
it all correlates very well .
http://www.solen.info/solar/images/comparison_recent_cycles.png
http://www.solen.info/solar/images/comparison_similar_cycles.png
Nice work, Joe! I visit solarham.com every day to check sunspots and solar activity. Am interested in any correlations you find in solar activity and market performance.
Granted he has the low in 2008 and i have it in april 2009
as well as dec 2009 for the trend change , but roughly it all fits.
an extended cycle of zero spots would indeed extend this a bit
yet that is for a another day .
my point is im beginning to see mini correlations to this theory
im putting together and i have been following it for a long time
having only discovered it back in 2007 .
i have not taken the time to put countless amounts of data together
to prove this as true yet i intend to .
A few notable analytical publications, among them Lowry’s and Ciovacco Capital, are making the case that the bull market has to continue for at least several months to allow the several months of market breadth deterioration seen at previous market highs. Chris Ciovacco has some really great charts showing the extent of the a/d breakdown at the previous two tops. Of course they are assuming that the market has to follow the same path at every top and while a not an unreasonable assumption, it is no certainty. Other measures market breadth have indeed shown substantial deterioration as evidenced by the numerous Hindenburg Omens confirmed the last few months. I am not sure what measure of breadth Ciovacco and Lowry’s look at but they are both presently contending that market breadth is healthy, and showing none of the the warning signs seen at the last two tops. Price will tell all. I suspect they are in for a rude surprise…! 🙂
Verne
there is only a few things i can swear by
death and taxes , spring summer fall and winter.
winter is usually cold and that means people will need
to turn on the heater or burn natural gas or use heating oil .
if it gets really cold then they may use more unless they burn wood.
nothing is ever for sure yet ill bet we get a colder than normal winter
corn wheat and oj showing promise .
bitcoin up 300% on the year and up a fair amount for the past 7 days .
DIOD made a slight new high today ( not an alltime high )
it has been a triangle for ever since oct 2007 . if it breaks out
its upside objective becomes 28.80 from its 27 and change levels its sitting at .
i don’t see everything as bad
correction
48.80 from 27 and change
for what it’s worth, am seeing two more days to 8-17 or 8-18 to make a lower high around ES 2481 and then trap door opening. A big astro shift happens early Friday before open where the nodes of the Moon change signs and support gives way. Then Monday is the eclipse…..
Just completed a study of lunar planetary position 18.5 years of data. Very profitable trade until 2010, evaporated after 2010 when it appears market began a much more random patternicity. Many patterns still have value, however, given the usage of computer trading by the large traders I wonder if past trading systems and techniques that validate their usefulness on historical data will lack predictive value in the current context. As if the algos have factored in what worked in past (or what the majority of traders are preparing for) and are purposely setting up classic patterns of bullish or bearish type right before a sizable move in the opposite direction is going to occur.
Good catch Valley, my sentiments exactly.
Valley
i remember back in 2010 and it appeared to me that a lot of planetary stuff
inverted . i don’t know why though .
there was a major peak and change in the planetary stuff in 2010 yet it wasn’t
a reversal in stock prices just a reversal in the planets
what im noticing presently and it might be in the algo trading systems
is the weekly and monthly pivots the daily less so yet also appearing to fit into this .
i have Jupiter and Uranus conjunction sept 28 oct 3 and a note
saying see the year 1921 low for what its worth .
Saturn Uranus aug 14th 18th is another change
mars and Uranus august 19th and then sept 18th-oct 3 .
looking at the decennial pattern i come up with oct 3 to oct 22.
and that oct 16-17th also fits .
lastly to confuse it a bit further . the year 1927
a low on august 12th and the high sept 7th sept 16th and Oct 3rd highs
and a Oct 22 low .
Nov 7th to jan 16th is a bullish seasonal more times them not .( think last years elections )
im focused right now on the present aug 21-22 date
yet it may or may not have a meaning .
the Feb 26th solar eclipse this year in my opinion was the march 3rd high .
we are also presently in a mercury retrograde cycle .
lastly we are in the opposite of the 1968 planetary cycle ( the 2010 flip )
weekly and monthly pivots on dow futures sit at 21850-21853 .
Es the daily monthly and weekly pivots sit at 2451-2453 ..
those being the major support .
there are levels above that im just pointing out the major clusters
Keep up the good work, Joe! Thanks for the update.
now this is weird
i don’t know what to think of this yet i went here
and it has a pre filled in name and email which is not me
i have no idea who BP is but wanted to see if it would post.
there is no technical puetz window this year so i have avoided
trying to calculate it yet decided to just because even if the parameters
are all wrong .
basically you need a solar eclipse followed by a lunar eclipse so since that
set up does not exist there is no technical puetz window .
that said i wanted to run it anyways in a very flawed manner and see
what it shows and i must admit im seeing some clarity .
the beginning point is normally the new moon prior to the solar eclipse
so i began July 23rd . the other parameters is you low for the full moon
6 weeks after the solar eclipse ( 6 days before to 3 days after ).
so here it is based on a very flawed set up .
July 23rd ( should have been a high yet it was a low ) aug 7th would have been
a full moon low yet it was the lunar eclipse high . this up coming solar eclipse
would normally have been a new moon low yet will it be ?
the sept 6th full moon would normally be the lunar eclipse high ( its not )
and then we would see a strong move into the new moon on sept 19th
the cycle ends 6 days before to 3 days after the full moon that is 6 weeks
after the solar eclipse . that would be sept 29th-oct 8th .
in short .
the mars Uranus cycle is bearish into sept 18th yet turns up oct 3rd .
congress has to get the budget and debt ceiling taken care of by sept 29th .
all of these things fit into this .
also as much as i hate to admit it , a high august 21-22 based on this
very flawed set up ( there is no puetz window in true form )
would call for a momentum high sept 19th and a high sept 29th-oct 8th .
granted its all speculative at this juncture.
if we see a decline into monday Tuesday then everything flips .
bottom line:
sept 19th and sept 29-oct 8th is all this cycle has in it .
afterwords we begin a new cycle .
high low or crash etc would need to come sooner if this has any merit.
( based on on this )
its just research on the fly as i think it through .
take it for what it is i have no opinion on this im just thinking out loud
the year 1927 is on the table .
so is the weekly chart i have been posting .
its going to take me a bit to think it alll through
and being this is mercury retrogade into sept 5th
and adding 10 days to that targets sept 15
i have to target sept 15-18th as well as sept 29 oct 9th
as the key dates .
lastly and this is it with my ramblings as i think it all through
aug 19th a mars Uranus high yet the secondary high
becomes sept 2 and the flawed crash cycle has sept 6th .
then its sept 18th 19th .
this would amount to a big swing from Sept 2-6th to Sept 15 18th
a high to low swing or a low to high swing .
ill watch the next few days before forming any conclusions
brain drained
ill re read all i posted over the next few days
and refine it all .
its just out loud notes and my thought process
its an upside down crash cycle and if this holds
its bullish.
done with my notes .
i have posted it all and have a solid game plan for the what ifs
while i m gone at work .
http://imgur.com/tQTiTQq
Made 1/5 of 1% on long trade. PALS is favorable. Yet, given price has moved up this week I will wait until after eclipse next Monday to consider more.
I shorted the rally via a long volatility trade (UVXY) and made a quick 25%. Sold half of position before the close. Will exit the remaining half at the open.
I wasn’t around for the Vietnam era, but the political climate here in the US is as vitriolic as I can recall; definitely not the kind of “social mood” one would expect to accommodate all-time highs. And it seems we are drifting solely on inertia stemming from a fraudulent corrective rally, as opposed to capping a true constitutive impulse wave. This crude phenomenology of mine jibes with Peter’s empirical wave count, as far as I can decipher. Yet does this mean that the fall will solely take the form of deflation as opposed to something possibly more pernicious: hyperinflation? If the rally was a fraud will the fall be as deceptive? A stealth crash? Any responses would be appreciated.
Mike
you do have a point .
ask yourself what is driving bitcoin to the moon ?
obviously there is not enough money around the world for
bitcoin to absorb and gold you cant get across the border .
If you were wealthy and you needed to move your money just for
a place to park it where would you put it ?
it looks to me like money is moving into us dollar assets and our
stock market is absorbing huge amounts of it from around the world .
fundamentals have left the building and stock prices are rising
just because people are chasing them .
Charles Schwab announced back in april that they had opened
new account to a record not seen in 17 years ( think 2000 )
central banks are hedging their bond portfolios by purchasing
stocks not to mention QE .
At some point though the music will stop and those new accounts
will find themselves holding the bag . The boomers will be forced
to liquidate a % of their holdings, social security will go negative
pension funds are already collapsing and the wise men who call
them politicians need more tax revenue because they simply
cannot admit it is they that have mismanaged the moneys they have
been entrusted with .
hyperinflation ???? maybe in relative terms yet not in my view
in a realistic term.
if your broke everything is expensive no matter how cheap its price .
If farmers cant grow crops those prices will go up but only if you
have buyers.
For me personally i don’t call it the cost of living anymore
i call it the cost of government.
The more difficult it becomes the more the masses will rise up .
some will protest because they want their free healthcare or free lunch
others will protest saying they are tired of paying for those who
are not contributing .
Our politicians are not doing anything for anyone really .
they rob someone in order to give it to someone else and in the mean
time take their own cut.
Peters take on this i completely agree with
I do not mind helping our my friends when they need help but i do
have a problem being forced to pay into a system that i don’t agree with .
The ECB, has its hands tied somewhat with the court case going on
yet i doubt the court will find it unconstitutional even though what they are doing is against the laws of the EU.
The federal reserve is talking about unwinding their bond portfolio which
amounts to letting the bonds mature and hoping their is someone to purchase
the new bonds to fund the united states debt . interest rate will rise yet that
is not a bearish sign . stocks usually rise in an interest rising cycle at first .
then the fed blows up the market by raising rates to high .
If it costs you to much to live you cut back your spending. If prices rise
more you cut back more ( or take on debt ) .
If you see prices declining you generally wait to purchase because you can
buy it for a lower price by waiting. Once that deflationary trend takes hold
it spirals downward and that is what the fed tries to stop from happening .
Technology is creating deflation, less jobs . we have ATM machines we have
parking lot machines we have computers which increase productivity
At some point it all comes to a head and it breaks down .
you can only tread water for so long and then you drown and die.
At some point people just give up and say the hell with it .
When you get to that point where you have nothing to lose you raise holy hell.
You are correct social mood is telling us we are getting closer and closer
to that break down point.
As peter has said many times the phrase Robert Prechter coined a while back
its all the same market .
I have recently been following the Junk bond market for signs.
No doubt in my mind that come next years mid terms social mood
is going to get a lot worse than it is today. i would not be surprised
that we see riots between the apposing protest groups .
it is a power struggle between those in power vs those who lost power.
The haves and the have nots i guess or the those who want their free stuff
vs those who want their freedom .
Its going to get very ugly .
Domestic and geopolitical risks for the US continue to be extra-ordinary. It is absolutely remarkable how few observers are sounding the alarm. I know of few analysts, other than Peter Temple, who has not only called for an imminent top, but has given cogent reasons for why he expects this to be the case. I know Gartman has, but I have not seen any details of his call. Meanwhile, the market issued yet another Hindenburg Omen on Wednesday. A few months ago in response to a question I posed on the blog about the prowess of central banks, Peter T pointed out that whether they knew it or not, the were subject to forces larger than themselves. That comment has stuck with me as I have been observing the markets the last several months. It is truly astonishing to witness the unprecedented levels of complacency, wholly incommensurate with the clearly obvious levels of risk. One cannot help but get the distinct sense that those “larger forces” are sounding stentorian warnings that something huge is on the horizon. I recently heard someone point out historical events taking places in the geography of total eclipses and it was quite startling and something I had never before seen referenced, and it had to do with war. After all , the Bible does point out that the heavenly bodies are for “signs”. One can be certain that in the aftermath of the coming implosion, every talking head is going to insist that “No one saw it coming…” Right!
Verne,
You said in your last post…”I recently heard someone point out historical events taking places in the geography of total eclipses…”. Can you elaborate or provide a link?
Ed this should be an easy search. Just Google path of total solar eclipses and war and you will find a wealth of material. I don’t recall exactly where I heard the comments.
Back from a short fishing trip. I had bids in to get my last batch short. Unfortunately I did not get filled. Frustrating, due to lack of cell towers in the remote areas of my fishing lakes. I just sold one batch at the 2441 level. One batch left. Waiting for a retrace of 8 to 12 points to buy back 2 more batches for a total of three going into next week. My new model suggest the bulk of the move should be next week. ( Monday Tuesday) possibly. Than I will be going back long into early sept.
I suspect the option traders will fight tooth and nail, to prevent the markets from going below 2445 due to the large put options at that level.
I should have stayed an extra day fishing. Lol only one batch short now.
Joe, I read your comments in respect to the cooler seasonal temps. I am in British Columbia Canada just up the coast from you. Our province has been devastated by high temps that our burning down vast sections of our province. Many towns and communities were or have been evacuated due to the fires. Fire fighters have been brought from Mexico brazil and other parts of the world to help out. The smoke here in Vancouver is twice as bad as parts of china. Most people our staying in doors due to heavy smoke haze that has drifted down from the wild fires. It is interesting thou, how the media propaganda has changed their wording from global warming to global changes in the resent times. Even thou, we are in one hell of mess with these wild fires I agree with you that the cooler temps are on the way for the rest of the world.
Joe, we seem to have the same dates in the near future. I will elaborate more, later for those times.
Joe, I love the very apparent hard research and time you obviously put into your market analysis. But I do have some bones to pick with you on the Puetz stuff. I have corresponded with him and been publicizing his work for a few decades now and unless you have notice of a recent change he has made in his research, this is what he requires for a “crash window.” Mind you, it is very important to stress that these coincident factors by no means predict a crash or even strongly suggest it. It is simply that they all existed in the 12 crashes that Puetz studied. Here are those coincident factors: 1)A lunar eclipse or a full moon within one cycle of a lunar eclipse is coincident to the beginning of crashes (by “beginning, it would be the start of the decline that leads to a day or 2 (or more) of a climactic crash ). For example, in 1987 the Dow reached a secondary high on October 2 and began a slow decline to the day of the full moon, October 7. From October 7 to October 19, the DJIA was down 7 of 8 days and ended down 31.8% on a closing price basis from the day of the full moon. 2)The full moon coincident to the start of the crash is always within 6 weeks of a solar eclipse. 3)The panic phases of all 12 crashes studied were entirely encompassed between two time windows: February 4-April 5 and September 3-October 29… The next full moon is September 6. It will be within one lunar cycle of the lunar eclipse and it will be within 6 weeks of the solar eclipse and it will be within the designated time windows given above. Does that predict a crash to begin around then? NoSirree, Bob!!!! but it tells you if there is to be one this year, that is likely where it will start.
Peter, I would appreciate a link Please. I would like to see if my work corresponds with some vulnerable times within the next several weeks, Thanks
Sounds to me like Peter G is the link!!!
Most interesting Peter time frame G.
I have always surmised that from an EW perspective, a crash would have to be a third wave. The implication of that Puetz potential window is that this would have to be the start of wave one down as we will need enough time for it to complete, and a second wave to re-trace. Great food for thought, along with the nine Hindenburg Omens…
As I’ve stated here before, a “crash” in EW terms is a misnomer. The market in 1929 topped on September 3 at 381.17. The “crash day” was October 24, when the market had already dropped 15% but that day, it dropped another 11% and that’s what constituted a crash day. If you were to look at a chart, you’d see that “crash day” was actually the middle of the third wave of the first. So, there was a month and half of warning for anyone who cared to pay attention.
details, details, details…why confuse people with facts…LOL! however, since we are talking facts, the SPX high was on August 8, 2017 and the NYAD high was on July 31, 2017…it will be interesting to see if the slight negative divergence proves significant…be well!
https://worldcyclesinstitute.com/events-dont-change-the-trend/#comment-18321
https://worldcyclesinstitute.com/wave-four-from-hell/comment-page-1/#comment-20399
Whitemare,
Do you have anything to add to your August 15th post?
Ed, here is a picture of the nodal shift before and after it happened.
Now it may retrace to Jupiter /Venus around 2452-55 over the next week
and then another bigger down leg into Sept. (hope these urls work)
https://i.imgur.com/mvuoBEt.jpg “Before”
https://i.imgur.com/LUlVqwq.jpg “After”
Whitemare,
Thank You!
Peter G
before i respond to you i just want to make sure i fully understand
this version of Steve puetz work . As you are well aware of you have to really
wrap your head around this theory .
im just going to take your key points for starters .
a copy and paste of your guidelines
1)A lunar eclipse or a full moon within one cycle of a lunar eclipse is coincident to the beginning of crashes (by “beginning, it would be the start of the decline that leads to a day or 2 (or more) of a climactic crash ).
based on that im assuming and please correct me as i try to understand this
1st part .
crashes ( yes i understand they don’t always happen )begin with the lunar
eclipse or with in one cycle of the lunar eclipse .
meaning they start with the lunar eclipse or the full moon that may be before
or after the lunar eclipse ???
and your second part
2)The full moon coincident to the start of the crash is always within 6 weeks of a solar eclipse.
i take that to mean that the full moon beginning the crash does not need to be a lunar eclipse and can be as little as 2 weeks after the solar eclipse to a maximum of 6 weeks after the solar eclipse ?
you finished this out with your take on sept 6th so im just posting this
to show you i read through it all
The next full moon is September 6. It will be within one lunar cycle of the lunar eclipse and it will be within 6 weeks of the solar eclipse and it will be within the designated time windows given above. Does that predict a crash to begin around then? NoSirree,
this might help a little
https://s18.postimg.org/tvcp13j9l/27_day_forecast.gif
Thank you TOM !
Peter G
1 last copy and paste
3)The panic phases of all 12 crashes studied were entirely encompassed between two time windows: February 4-April 5 and September 3-October 29…
which years were these 12 crash cycles ?
what year is the dates listed ???? feb 4 april 5 of which year ??
Peter G
i am interested in your reply to my questions above
yet ill add this chart . i could add more
just pointing out that i have never talked to Steve puetz
in any manner yet i have researched the puetz window in depth
and i look at it every year . i am not aware that the theory has been
changed and now allows for something less stringent then its initial
form .
i could show the jan feb 2009 into the march 2009 lows and show
a perfect puetz window yet that is not what im doing because
i want to show the oddities .
to your advantage the chart of 1999 is what i think
of when i try to digest what you said . so that chart
in my opinion fits the bill of your description .
not saying i agree but im open minded and can learn
new things
to keep it simple ill add 3 charts yet i could add more
1999-2000
http://imgur.com/Ov3cYzK
1975
http://imgur.com/bi8Q8rP
2000
http://imgur.com/Mntknot
Joe, in looking at your 3 charts, how would you relate EW to those charts?
Peter G
Thank you for this discussion
I think i have discovered something from this .
Really, thanks for this i think you opened my eyes to something
yet ill need to check it out first .
Joe
Jeff T
i got long the futures this morning
ill reply later
it took a few tries yet they were tight stops
got long near the lows and we have gone past the apex of that minor triangle.
looks like atleast a short term low .
done for the day
ill see what monday brings
Jeff T
i was just trying to show the puetz window
and as i was looking through it i noticed something
that i have to research yet it shows up in the 1999 chart .
Back in 1999 i was looking for a top yet it obviously wasnt .
in 2000 that high in sept was a B wave top in the dow yet
it was the all time high in the NYA and i think yet id have to look
i think it was also the monthly all time closing high in the spx .
in 1975 i was to young to know anything about the stock market.
yet in hindsight i could make a wave count yet that was not the point
i was making . I was just showing the Puetz windows and how they are not
always bearish yet they have worked as i was explaining yet sometimes
you get the opposite .
I am not aware that Steve puetz changed his formula yet i find it has worked
as he originally discovered for a very long time .
what Peter G has pointed out i do find interesting and worth further research
what i did dig into a little bit this morning give me a slightly different view
but i do see what he was saying ( or at least what i think he meant )
for that i want to thank Peter G for my morning bullish trade 🙂
Sold all shares of EIX today .
Utilities look to be in the latter stages of their bull market.
will give this run higher some time before cutting back
on a few more stocks.
sticking to my plan of reducing risk .
PALS next week:
Declination: very bullish
Distance: bullish
Phase: bullish (new moon zone)
Seasonals: ok, mid August better than end of month
Summary: next week bullish. Mercury Inferior Conjunction (watch those electronics) end of next week which I will be selling my full equity position before then.
Looks like I’ll be playing whack-a-mole with Valley next week. For every pop, I’ll whack it down. 🙂
Fair comment. Randy Newman’s song “Short People” sums up my feelings towards next week.
I did my own fair share of serious whacking this week.
More moles to come…! 🙂
Any body else caught those UVXY pops?!
I know what you mean, Verne. Congrats! I made enough to buy several value meals at McDonalds with my profits this week. =(
Same plan valley if we rally to 2460/65 I will sell long and go short SPX put spreads for 2/3 weeks.
I think i m with valley for the next couple weeks .
i cant rule out new all time highs in the dow .
we will see though what really happens .
the concerns though that bother me is junk bond spreads
the spread im looking at is ( JNK + HYG ) – TLT
That spread peaked on march 1st and has been in a down trend
as the stock market index’s have been making high high’s.
that same spread bottomed in dec 2008 then made a higher low
in march 2009 which kicked off the bull market . at the feb lows
in 2016 that spread went below the dec 2008 lows and turned up
with this present run in the index’s. the most recent low in that spread
was june 22nd and it made a higher low on Friday and had a slight upturn.
i have only begun using that as an indicator yet i am finding it helpful.
The basis behind this is when money starts to leave the market it shows up
in junk bonds first . ( sell corporate junk bonds first since that is more risky
than stocks ) then sell stocks. i use both JNK and HYG because the combined
add up to 124.47 vs TLT which closed at 126.62 and all of them get traded .
i feel its a fair analysis of the junk bond treasury bond spread .
Peter T
i think you put the word crash in the correct context .
people talk about the crash of 1929 as if that was the entire move
yet the period of 1930-1932 was worse .
I also here about 2007 in the same way yet it was mid 2008 into Nov-dec
2008 where the bulk of the decline was .
Mercury began its retrograde motion august 12th add 10 days and we get Tuesday. the solar eclipse on monday tie these 2 together . valley noted
the inferior conjunction with mercury . i forget the rule on that so cant say anything as to its meaning yet mercury inferior conjunction and its superior
conjunctions have meaning as do Venus inferior and superior conjunctions.
ill call it a triple combination and leave it at that .
mars Uranus has a turn august 19th and then again sept 2 both calling for high’s
yet im not convinced those will work . the most potent is the oct 3rd date
which is technically a low of sorts which would be followed by a high oct 10th.
i have made the case for an oct high so i decided to attempt to refine it
from monthly to weekly .
week of oct 19 1987 to the week of oct 7 2002 low to low of 781 weeks
add 781 weeks to oct 7 2002 i get the week of Sept 25 2017.
the following week being the week of oct 2, keep in mind i have been also mentioning sept 29th-oct 3, and now the basic low to low to high counts
are fitting into this as well .
if this sept 29th oct 3rd has any meaning ill assume that we see a failure
to raise the debt ceiling or create a budget or maybe trump protests what ever
they put in front of them because he wants money to build his wall .
all speculative and i really have no clue yet some kind of news event surrounding
the debt limit would become the spark .
with full respect for Peter G ill just mention that 6 weeks after the solar eclipse
is the full moon on Oct 5th ( i think that is the full moon date ).
Ill finish this by just saying that we should begin a new cycle then.
high or low beginning of a decline or rally etc .
its just the end of a cycle, that is it .
=
Valley
i am still considering that we may have seen an inversion.
the july 11 low as well as the july 24th low would be where
that inversion began yet if that is correct then aug 22
would need to be a low and then we would begin seeing
full moon highs and new moon lows ( pus minus a day or so.)
that said that Sept 28-oct 3rd time frame shows up A LOT.
If i tried to spin it as positive we may just see a continuation
lower into Sept 28-oct 3 and the politicians actually begin
working together to work through their differences and put together
a budget and we begin this new cycles ( 6 weeks after the solar eclipse )
with a positive turn in social mood .
keep in mind this is just the positive spin yet it is bearish stocks
into early October. That may very well be what is happening despite
my bullish bias short term . An inflection point and just variables.
if i was to go further with this thought process that we did see an inversion
then we see an Aug 22 low a Sept 6 high Sept 19th low ( fits with mars Uranus )
a run higher into Oct 6th ( the end of the cycle ) then we would see a more serious decline unfold into Oct 20th ( which ties together the year ending in 7
and the crash pattern just about perfectly ), that drop from Oct 6th to Oct 20th
would be a mini crash of sorts so a 10 % drop id bet on., then more choppy upward bias into year end .
and i call it the positive.
i am not ready to state this but it ties it all together and validates
that an inversion actually took place.
this is my short term model using the inversion . this is all planetary based
and includes everything but Pluto.
as always this is my work and i know its failures yet this is what
i am thinking is taking place, if we saw the inversion then it should become
apparent going forward ( its had enough time to develop )
Note the mid point in relation to Fridays close .
staying open minded going forward
http://imgur.com/aDUaavH
just a simple, straight forward what if…was August 8, 2017 analogous to September 3, 1929?
https://worldcyclesinstitute.com/september-lining-up-for-a-great-fall/comment-page-1/#comment-20854
Joe,
I am back with another question about the charts you posted weeks ago showing a composite of the “best and the worst decades”! Your comment that stuck with me was that based on that research…You expected Wave 4 to be deeper and last longer than most investors were looking for!
With 4 or 5 weeks of additional market action…Has that perspective been altered in your view? All this talk of inversions and potential inversions has my head spinning!
Thanks in advance!
This website is for educational purposes relating to Elliott Wave, natural cycles, and the Quantum Revolution (Great Awakening). I welcome questions or comments about any of these subjects. Due to a heavy schedule, I may not have the time to answer questions that relate to my area of expertise.
I reserve the right to remove any comment that is deemed negative, is unhelpful, or off-topic. Such comments may be removed.
Want to comment? You need to be logged in to comment. You can register here.