
Four or Three?
Last weekend here, I predicted that we had one more wave up to go before we hit the top of the third wave:
“… the market made it very obvious we’re not quite done with this third wave. All boats have risen to a new high, but the market has signalled one more wave up … and this is across most currency pairs and US indices and futures.”
We indeed went up one more time to a new high. On Wednesday in the Chart Show, I predicted the turnover would happen within hours after Yellen’s announcement, but that it might not happen until the next morning because very often after after a Fed meeting announcement, the market moves in one direction to finish off the day, only to move in the opposite direction the next day.
Sure enough, that’s what happened. ES moved down about 25 points on Thursday. I now place us in wave four.
However, with a market at bullish extremes, and an EW expectation that it will take perhaps ten weeks to trace out all of wave four (a projected SPX length of 175 points), it’s likely to be a choppy and difficult path down. (That works out to 17.5 points a week).
It won’t be much better than the difficult market conditions we’ve experienced over the past several months. Plus, it’s summer. Expect wave four from hell.
Last Weekend: Predicting the Top of Three
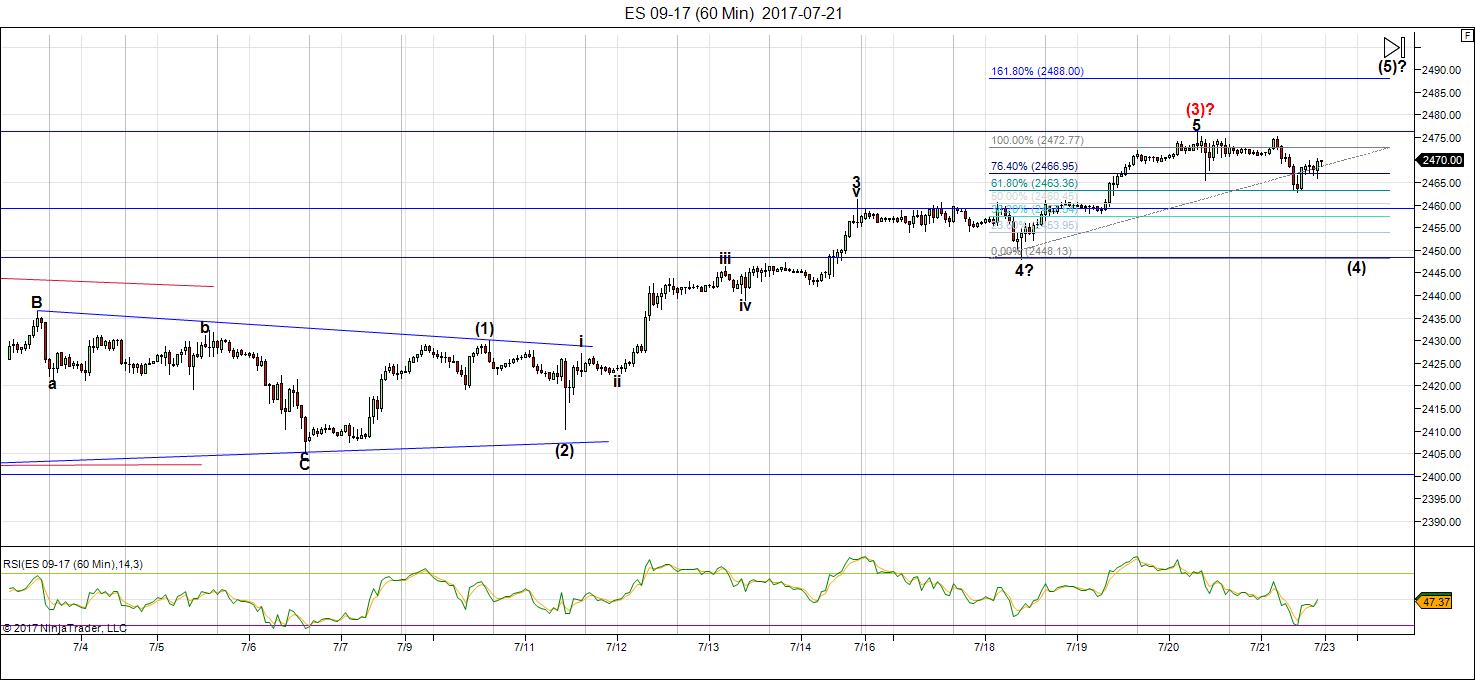
Above is the 60 minute chart of ES that I posted in from the Traders Gold subscription area on July 22, 2017 (last weekend).
I predicted (as per the fibonacci tool overlay top right) the if the fifth of the fifth rose to its full allowable length (1.618 X wave 1) that it could reach 2488. It topped on this past Thursday morning at 2481.
I had also predicted a top for NQ at 5990 for the same reason. NQ topped out at 2997 on Thursday morning, as well.
_______________________
A Rare Event: The Market at Extremes
You don’t have to have even a medium level understanding of Elliott Wave wave movement to know the market is at extremes. But if you do, you know that we’ve had some rare extreme movements in key assets, most notably the US Dollar and Euro (which move counter to each other).
An impulse wave in EW moves in five waves in a very strict manner, with wave lengths that are highly predictable. We have an impulsive wave at an end in the US Dollar (the chart follows below).
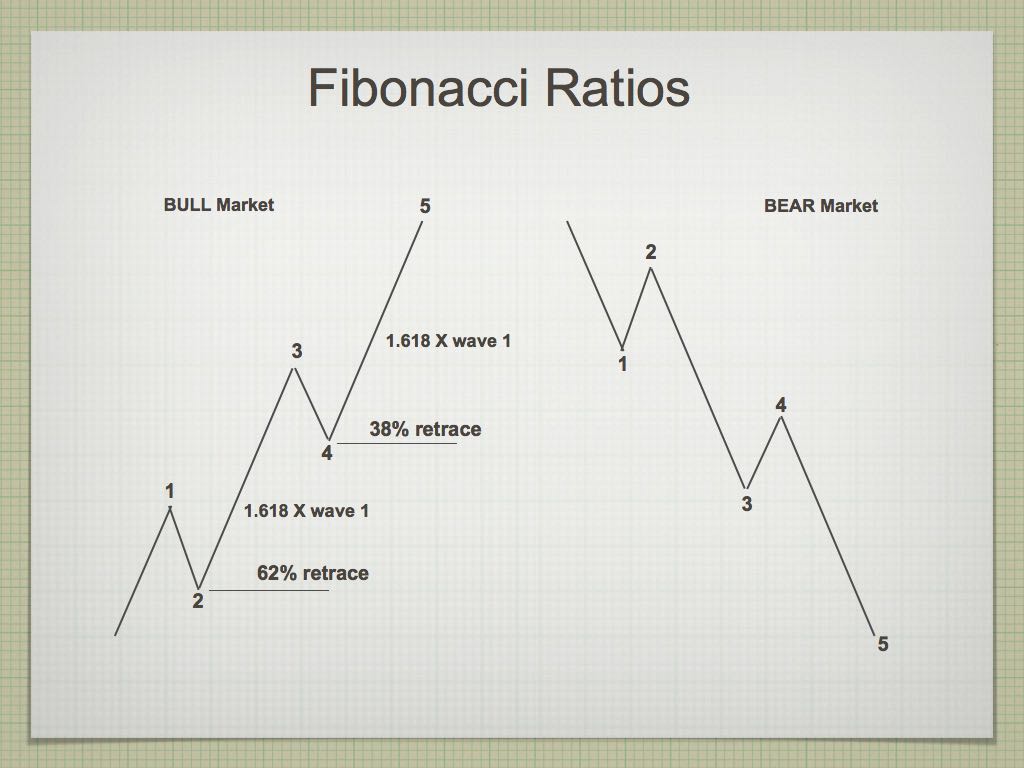
On the left is the typical measurements associated with an impulsive wave, with the expected fibonacci lengths of the trending waves (1, 3, and 5) and typical retracement levels of the countertrend wave (2 and 4). Typically the third wave reaches a length of 1.618 X the length of the first wave of the sequence (the Golden Mean).
Quite often, you’ll find that the one of the waves (most typically the third wave) extends to double the normal length (2.618 X wave 1). The five wave can also extend to that same relative length. However, it’s extremely rare to see both waves extend to 2.618 times the length of the first wave of a sequence.
In the current market, we have that rare phenomenon at play in both the US Dollar and EURUSD. In the USD below, which is the main mover of the market (related currencies all follow it, and the US indices have been reacting to it for months now, to a greater degree as time marches on).
This weekend, the US Dollar is at extremes. Both the third and fifth waves have traced out those extreme fibonacci lengths. A reversal is imminent.
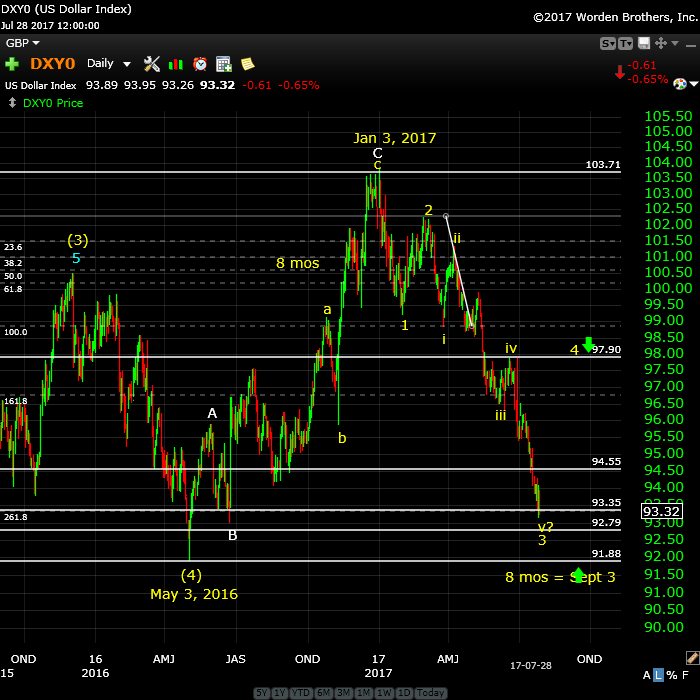
Above is the daily chart of the US Dollar. You can see quite clearly the impulsive wave down to our present level of 93.32. If you concentrate on the subwaves (and were to measure them), you’d find that wave iii is 2.618 times the length of wave i, while wave v currently has exactly the same relationship with wave i.
A turn to the upside is imminent.
Watch the dollar and you’ll know where the USD currency pairs and the US indices are going to go.
______________________________
Rise above the rest … SM 2
Rise above the rest …I have only ever met a few people who, in their chosen fields (astrology, medicine, music, martial arts, technical analysis), rise above all the rest and you are one of them…you have ‘the gift’…and that’s why I’m a Trader’s Gold member. —SM |
Couldn’t be happier … KK 2
Couldn’t be happier …The analysis and insight you provide is simply amazing! I’ve been trading the futures and equity markets for well over thirty years and usually average around 5% monthly. Since joining your Traders Gold Service two months ago, that number has better than doubled. I couldn’t be happier.—KK |
A true expert in Elliott Wave FL 2
A true expert in Elliott Wave …You are a true expert in EW analysis. What you provide is not available anywhere and is priceless. Subscription on your services is the best thing I have ever done. Many thanks for your effort to make me a better investor. I now have more trust in my investment decisions. I hope you will continue the excellent work! —FL |
the real deal SM 2
The real deal …‘Educational, insightful and thorough market analysis for all levels of traders. It’s Elliott Wave at its best….Peter Temple is the real deal’ —SM |
The best of them JL 2
The best of them …Last couple of years, I subscribed to several ‘market traders’. You are by far the best of them and the personal contact is awesome. Daily and daily updates are very well written! Besides your expertise in EW, I also like your cycles analysis. Best investment I ever made! —JL |
Have not had a losing week RW 2
Have not had a losing week …I have been with Peter almost a year. The only thing that matters is have I made money with his service. I think I have finally turned the corner using Peter’s EW. I have not had a losing week in the last 5 months. Thanks Peter, for your amazing amount of hard work. —RW |
Tops in your field DZ 2
Tops in your field …You are tops in your field. Tried to follow Elliot Wave international for years. They were always behind the market. After discovering you, I perceive that you are an expert in reading the waves, which puts you way ahead of the rest of your peers. And you can read the Waves like you are reading tomorrow’s financial section. I pray you stay healthy. —DZ |
Get an upper hand … JC 2
Get an upper hand in trading …Seeing all the different currency pairs and the wave structures and hearing you explain why this has to do that on a nightly bases gives one a upper hand when trading. Elliott Wave applies to all stock and indices and can be applied to any candlestick chart. If someone ask what you want for Christmas – Tell them a membership to Peter’s “Traders Gold!”—JC |
The Market This Week
Here's the latest daily chart of ES (emini futures)
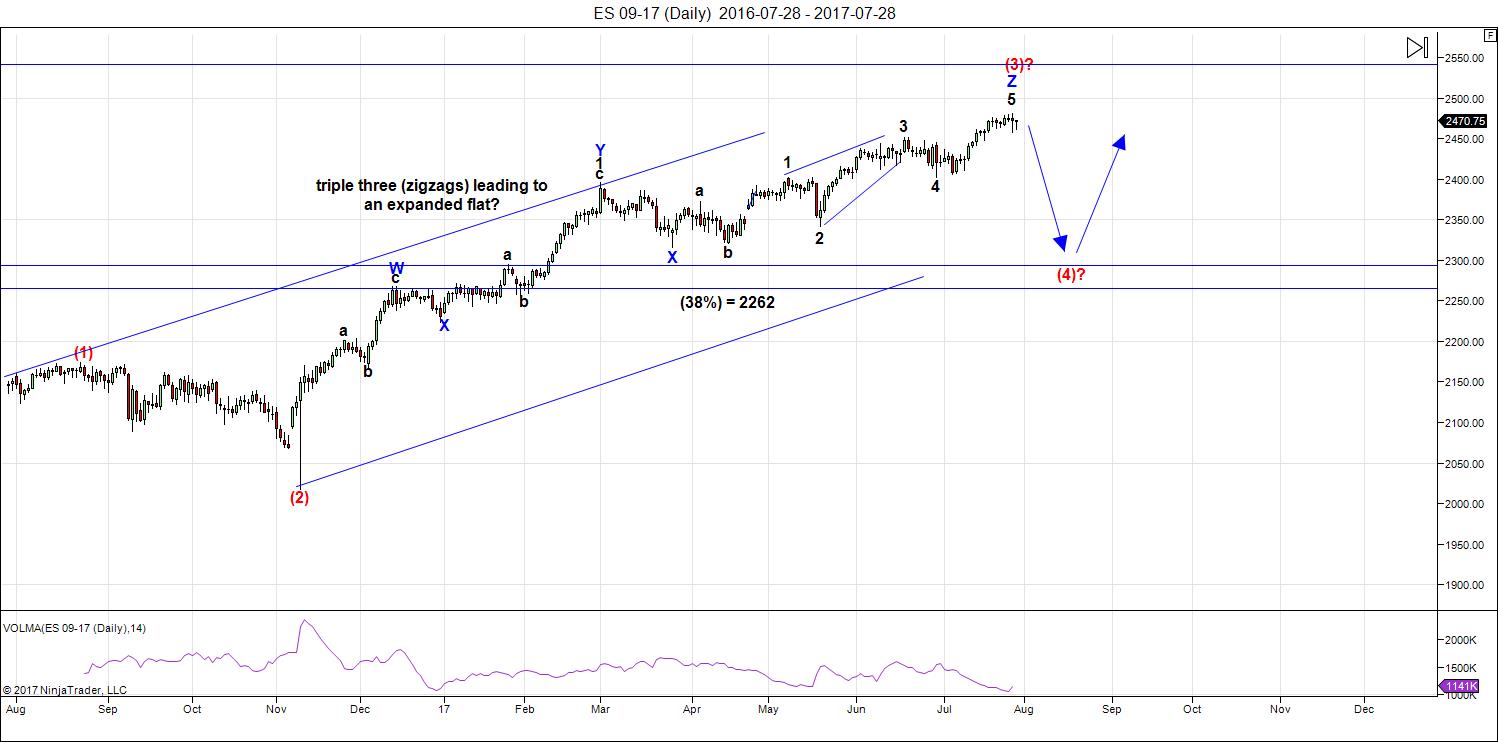
Above is the daily chart of ES (click to enlarge, as with any of my charts). Last weekend, one more wave up to a final top was due and led to a turn down into wave four. I provided targets in my Trader's Gold service for both NQ (5990) and ES (2488).
We exceeded the target for NQ slightly but didn't quite make the target for ES.
I now put us in wave 4, which will take weeks to unfold and drop towards a level of 2295 (which is the 38% retracement level SPX of the waves up from around 1992. That's a preliminary target and will be updated once we get an A wave of the 4th wave in place. On the chart above, I've left the level at 2262 until I have a more precise means of measurement (completion of the A wave).
There is still a possibility that we could see a test of the highs (a double top), but I consider that probability to be very low.
However, the count so far is only three waves down and so we still don't have confirmation of the trend change. We must register 5 waves down for solid confirmation. At the same time, there are several indicators that wave 3 is complete. They are:
- the waves up from the bottom of the recent downturn (Friday's market) are in 3's
- the larger wave three has a full count to the current top
- currency pairs are all at major inflection points and certain ones are extremely extended (USD, AUD, EUR, CAD)
- the DOW is at the very top of an ending diagonal with very little room to go higher. It's also at a measured fibonacci target
- NQ is leading the charge down, which is a very good sign of a top
- bullish sentiment is at an extreme, as I reported last week and ultimately followed by a post in zerohedge, with additional extreme numbers
- VIX has gone to a new low and was quickly rejected, which is a typical trend change warning
The large third wave up is an extraordinary wave. It's corrective, just like the entire sequence up from 2009. There are extensions of waves in currencies (USD and EUR, for example, but there are others), that are extremely rare (as described above). We've run out of wave 3 waves in terms of the Elliott wave count and the market should continue down from here.
Summary: Wave four is in progress. Expect a continued drop for several weeks to come.
After completing the larger fourth wave, we'll have one more wave to go, which could be an ending diagonal as a fifth wave. The long awaited bear market is getting closer.
______________________________________
Sign up for: The Chart Show
Wednesday, August 9 at 1:00 pm EST (US market time)

The Chart Show is a one hour webinar in which Peter Temple provides the Elliott Wave analysis in real time for the US market, gold, silver, oil, major USD currency pairs, and more. You won't find a more accurate or comprehensive market prediction anywhere for this price.
Get caught up on the market from an Elliott Wave perspective. You’ll also get Andy Pancholi cycle turn dates for the SP500 for the balance of the current month. There’ll be a Q&A session during and at the end of the webinar and the possibility (depending on time) of taking requests.
All registrants will receive the video playback of the webinar, so even if you miss it, you’ll be sent the full video replay within about an hour of its conclusion. For more information and to sign up, click here.


Thanks Peter. The dollar’s dramatic fall beneath the lower boundary of the falling bullish wedge was actually the thing that made me rethink my concern about DJI’s new ATH. And I do agree this fourth wave is more than likely indeed going to be a PITA! 🙂
Verne,
What is PITA? Thanks!
Think of Peter’s title description of this fourth wave and you should be able to figure it out…. 🙂
BTW, I had originally surmised that the fourth wave would be hard and fast and deep enough scare folk into thinking we had a top and dispel the remarkable level of bullish sentiment we have been seeing. Still, I would not be entirely surprised to see a fourth wave triangle unfold that serves to frustrate both bulls and bears alike. We will probably continue see sharp short C waves as part of the correction that will be traded successfully by only the nimble. A key to what is happening will be MACD. If it hovers near zero during the correction it will be an early clue that a triangle is unfolding. Of course we could also have the mother of all monkey wrenches with an expanded flat taking markets to new all time highs with a deep B wave. To me that would meet Peter’s qualification as the wave from Hell!
I am hoping for a nice simple regular flat of zig zag, and that ensures it ain’t gonna happen! 🙂
Thanks Peter.
One day we’ll get it.
By the way, concerning USD do you mean the 0,38 retrace and than the 5th down or the reverse to a new high ?
Thanks for the post Peter. PALS suggests weaker prices this week. And most likely continuing into the following week.
Verne
I agree with Peters wave count but it is possible we are already in a deep B wave
Which implies we have been in wave 4 for a while now .
That said , look at Peters labeling and try to fill in the blanks for further subdivisions
And see if you can find any .
I say this with total respect for Peters count .
Great job Peter and thank you for the time and effort
You out into these updates .
My focus being the Dow though and I have to admit the pattern
Based on Elliot wave does look complete .
The pattern I’m following though is not complete and until
It fails I must look for higher prices in the DOW .
Also to note as Peter mentioned , we do not yet have confirmation
At this juncture , only a 3 wave decline so far .
I continue to raise my mental stops until I see a valid break
Before getting bearish .
Not changing my view about this decline lasting longer then most expect .
I think Peter nailed it in today’s post .
Read it all and look at his notes included on the charts .
Once again great job Peter and thank you for your time
And effort
Joe you could be right. The thing that strikes me as strange for a correction at this degree is the complete absence of selling pressure. My own experience is that the start of corrections of the kind we think we are in begin with strong downwards momentum and selling pressure. Both continue to be uncharacteristically absent and I simply do not have a satisfactory answer. If DJI is in an ending diagonal as some argue, it is definitely not done. Anyone who knows anything about EDs is also know the umistakable characteristic of the way they conclude. Nothing remotely the case can be said of DJI which made a new all time high once again today. The obvious answer is that we do not yet have a major change in trend but that raises more questions than it answers, especially considering what is going in in NDX and Transports. I will remain short for one more day but more sideways action tomorrow and I am on the sidelines. I would have no choice but to conclude we have yet another period of consolidation ahead of a another move higher. Price is what it is. 🙂
Liz h
Do not consider this a trade recommendation
Just consider it an example of the earning trade
I mentioned before .
If the masses have high expectations for an earnings
Beat and the masses have a bullish bias then I’d expect
A general upward bias up into August 10 th earnings date
( assuming this link is correct ) with Aug 7th being the full moon
Lunar eclipse it might be a tough call as to whether we see a surge
Just before earnings or just general strength .
The bias is a bit overly optimistic which I’m thinking
Is premature to be contrarian yet the risk is always
There .
Just a real time situation to see if these earnings trades
Still produce .
https://www.earningswhispers.com/stocks/nvda
Note the volume spikes surrounding the earnings dates
On the lower chart also volume as dropped off a bit lately .
Last post until after Mondays close.
weekly chart projections .
21939-22174 for cash daily close
each weeks actual close adjusts these numbers.
There is a cluster surrounding 21927-21939
( not calling this the high just yet but it may get rejected short term )
the week of Sept 29th is another calculated swing high
im questioning that sept 29th date that it isnt not much
of a swing high and thinking its more of an acceleration
high where the market just accelerates its decline further .
If we hold onto the pattern, the spx will close at new all time highs
by Friday this week. things are starting to make sense.
not sure where Andre has been yet if your around
i think you can confirm the sept 29th spiral date .
from the week ending august 11 th i begin tip toeing into
some bearish trades , by the week ending aug 25th
ill be fully short.
No price projections to the downside at this juncture.
Last weeks lows are going to become i m mental stop
across the board on the index’s .
Daily chart
points higher for the entire week which dove tails the
weekly chart .
Next weeks lows will become the next mental stop
once this week proves itself ( next week a whip saw )
down early in the week then back up to end the week .
The daily chart projects a top next Friday
and the first thing that comes to my mind
Mercury goes retrograde august 12th.
week ending Aug 11th is becoming a concern ( a possible top )
week of Aug 25th is very much allowed yet i don’t think
i m going to push my limits
and LIz H , if you add what i just wrote and included my thoughts
in regards to earnings trades and you add in NVDA into the mix
and there earnings Aug 10th . Ill be seriously considering exiting my
position yet i still have a price target in mind and if not hit
my stop will be pushed up tight.
next weeks lows will be important if this week the spx runs
higher and makes a new all time high , same holds true for NASDAQ and Dow.
we are about done .
Valley
we may have had an inversion .
July 24th was a closing low which
now points to august 10th
June 9th and july 11th were lows of sorts on a closing basis
June 23rd was mixed
The next date being Aug 21 again
Its going to get a bit tricky .
but something has changed
Thanks, Joe! I am in cash this week. Looking for slight sell off in SPY ending next Monday.
Peter
Just food for thought
weekly chart of NDX
Week of july 20 2015 high
sideways action which can be counted
as
Week of :
a Aug 24 2015
b Nov 2 2015 ( cant use week of nov 30 or it would be 5 up
and the decline that followed nov 30 was 5 down )
C Feb 8 2016
D april 18 2016
E June 27 2016 ( end of wave 4 still counts best there )
wave 1 lasted 7 weeks into aug 15 2016.
wave 2 is sloppy and best ended nov 28 2016
wave 3 was an extended wave which counts
1 2 3 4 i ii iii iv v3 which ended June 5 2017
wave 4 ended July 3rd 2017
wave 5 will equal wave 1 if it lasts 7 weeks from july 3rd
and if it travels 657.93 pts .
adding 7 weeks to july 3rd i get the week of aug 21 2017
and adding 657.93 pts to the july 3rd low i get 6237.57.
To add to this if i take the end of wave 4 the week of
nov 28 2016 and add 60 weeks i get the week of aug 21 2016 .
Im not saying this wave count is perfect but there is many reasons
to consider it valid if we see that price and time match.
the late george lindsay when explaining his 3 peaks domed house pattern
explained what he called the 5 reversals . those 5 reversals are the same as
a 4th wave triangle .ill paraphrase his quote in regards to his 5 reversals .
be very wary of any sideways move lasting 11 months .
The peak of the market prior to that sideways move was in july 2015
and that sideways move ended in june 2016 . hence we did have a sideways move lasting 11 months . Based on this basic explanation the immediate
down side target for the NASDAQ 100 is the June 2016 lows at 4179.74 .
and that would not be the end of the decline if the rest of the pattern was to play out . Hence a 33 % decline in the nasdaq 100 cannot be ruled out between now
and January or may 2018 . This type of decline is nothing outside the box
and is a very strict take on that pattern.
If i include Elliott wave theory and consider that 4 th wave triangle the downside
target does not change . we should go back to the june lows of 2016 once this
5th wave ends which began in july 2017.
Hence while i may disagree with you on a few minor things i am becoming extremely bearish and in some ways much more than you are .
So i thank you for the work you do and i appreciate all of your efforts .
Thanks you
Joe
question for everyone- timing the market is extremely difficult and I am trying to figure out why so many people follow the Elliott wave theory. my question is two fold. is it more accurate in short term trading or long term investing? and has it been profitable for you to follow this strategy? thanks
http://www.channelnewsasia.com/news/business/imf-says-dollar-overvalued-euro-yen-yuan-broadly-in-line-with-9075050
Dollar index could head to the 70’s! That would throw a spanner in the works. The euro refuses to turn down…so frustrating…1.2 next or 1.3,1.5,1.8??
I have to respect the cash Dow rejection at the 21930 level.
support for for tomorrow sits at 21716.
The feb 10-11th lunar eclipse produced a weekly low .
the solar eclipse feb 26th produced a high the first week of march
and in doing so we got a decline into the march 27th low .
a similar situation could happen this week .
mental stop on Dow will remain at 21472 for now.
my expectation is for a whips saw over the coming days .
how that plays out remains to be seen.
we have a minor wave 1 down from today’s morning highs
and a deep wave 2 retrace . ill wait and see how the wave develops
before looking for new highs
Bottom line: Today’s highs in the Dow are most likely at the least
a short term high with another high to follow yet as i noted early this morning
im not going to push this .
A close for the week above 21930.50 is needed to signal an acceleration up .
whether that close comes this week as i expect or next week remains to be seen.
all for now .’
another inflection point is upon us
Marc
i use Elliot wave theory as well as timing .
I have used Elliott wave theory in shorter term charts
yet my preference is the longer term charts .
I find it very useful yet the key is to take your biases out of
what the charts say .
it doesn’t matter to me what i think . what does matter though
is if the market holds to a pattern or if it fails .
Elliot wave theory in my opinion tells when when you are wrong.
that was quick.
dow at new all time highs
just need to see a close above 21930.50 for the week
Yes indeed. Futures pointing to new DJI all time highs tomorrow.
I expect SPX to follow suit. In the end, the only thing that prevents our seeing what the market is plainly doing is the bias of our preconceptions. I am now of the opinion that we are in final fifth wave up in the markets. The next serious move down is not going to be a correction. It will be a collapse and is most likely several weeks away. Just one man’s opinion based on what I see.
1 Boeing 7.59 7.59
2 Goldman Sachs 7.05 14.63
3 3M 6.29 20.93
4 UnitedHealth Group 6.00 26.93
5 McDonalds 4.85 31.78
6 Home Depot 4.68 36.46
7 Apple 4.65 41.11
8 IBM 4.53 45.64
9 Johnson & Johnson 4.15 49.79
10 Travelers 4.01 53.80
11 United Technologies 3.71 57.51
12 Caterpillar 3.56 61.07
13 Disney 3.44 64.51
14 Chevron 3.42 67.93
15 Visa A 3. 11 71.04
——-15 dow stocks control 71 % of the index .
DJ ressembles the bitcoin now
The DOW broke its ending diagonal and tonight, ES is destined for a new slight new high to finally to probably touch the original target, which is 2485 for ES, 2488 for SPX. ES is now in the area of the first wave down.
Incredible market, Peter,
normally SPX should do “whatever it takes” to go to chase the stops over 2500
Dimitri,
It sure is. With the US dollar affecting just about everything now (currencies, equities, and now possibly oil all reaching targets at the same time), the ship is taking forever to turn.
Last November-December the stocks went up together with the Dollar.
Since January the Dollar has been sliding down but the stocks kept rising.
Yeah, gold turned at the same time. January.
Joe,
it’s worse.
Boeing alone is responsible for 300 points of recent rally in DJ.
Almost 60%
The concentration of market gains in fewer and fewer index components has been an interesting feature of the current market advance. Until those market leaders give up the ghost we are not going to see important support and resistance pivots give way. I stand by my thesis that we will know a trend change has arrived when the first impulse down decisively takes out these pivots. In every single case that I can recall, a hesitation or bounce in these areas turns out to be very strong evidence that the uptrend remains intact. Recent price action continues to support this idea. Until we see SPX 2470 decisively fall on an initial impulse down, the trend remains up in my opinion.
NOT AN ENDORSEMENT
“Can DAX Join A US Stocks “Mania Cycle” ?” – Grega Horvat, August 1, 2017
https://ew-forecast.com/newsletter/_dax_can_join_a_us_stocks_mania_cycle
https://worldcyclesinstitute.com/events-dont-change-the-trend/#comment-18321
NYAD continues to power on without a hint of negative divergence…
Will be closely watching VIX price action today. A higher low would confirm that this coming spike is terminal. A green close today could indicate we finally have a top. I think it could take a few more days. Then again, maybe we will see another new anomaly with VIX and market divergence over several sessions, which is something I have never ever seen before.
VIX historical lows
12/27/1993 – 8.89…6+ years before market peak
12/15/2006 – 9.39…10 months before market peak
VIX most recent historical low
07/26/2017 – 8.84
Historical references are certainly useful. They are not always predictive. This VIX cycle has done a few things that were unprecedented including the new all time low. The duration of the sub 10 closes was also never before seen price action. The current top is also unlike any previously seen. We simply do not know how the market will behave at the coming top- we’ve never been this way before.
It would be interesting to see how the market corrected in the months following new all time lows. Not too many people who talk about how long it took the market to finally top post that information as well, and that seems to me more useful information.
“Please Stop Talking About the VIX So Much”
https://www.aqr.com/cliffs-perspective/please-stop-talking-about-the-vix-so-much
“The VIX tells us almost nothing beyond how much markets have been bouncing around lately. So, instead of saying “the VIX is shockingly low” why not say “markets have been shockingly calm lately”?”
While it is true that VIX does not tell us anything about price, it tell us a lot about sentiment. For anyone who believes in EW theory, it would be the height of ignorance to ignore VIX. Sentiment drives the waves.
Peter
No doubt in my mind we are very very close to a top of importance.
Whether this is top of 3rd wave which is a good count or the top
of more importance i m open to either .
For the record by projections based on yesterdays close actually
declined 21939-22031 which is a slight drop from the 21939-22174
projections plotted from Fridays close.
not changing the 21930.50 weekly close as key for a further acceleration
just noting we are historically based on the models i m using
very close.
key support i noted i m keeping at 21472
to signal a breakdown i m looking at 21404-21406 . yet the level
will be moved up once this week is over and we go into next week.
I spent a little bit of time looking into ethereum just because i wanted
to learn which graphics cards have been bought out over the past few months .
i look at that as a fad yet who knows. maybe these ethereum miners continue
and in doing so they have created a new graphics card market for nvidea amd
and a couple others who are now producing cards just for these miners.
yet for all the time and energy sounds to me like 3 – 6 bucks a day is all they make
and i assume for those who cant afford the electric bill it may not be for them.
i did find a computer for sale , the guy called it an ethereum rig . i wrote him just to ask how it all worked yet no response.
My guess is we do see some improved earnings from graphics cards producers
yet i cant trust the numbers as a true trend since this flood of buyers came in
as bit coin ran to the moon and has since crashed . i don’t follow bit coin so don’t quote me , i don’t know where it sits today or how much it bounced.
Jury duty calls lol fun fun .
Have fun at jury duty and be sure to give us the juicy details when you get back. Some of the best stories I have ever heard have been of jury duty experiences. I have had a few myself! 🙂
Verne
i look at the vix as a product of price range .
if you look at the monthly ranges in the spx you will
see that the ranges narrowed , a lower vix made sense.
as the range expands we should see the vix rise.
even an upside thrust ( not calling for one ) in the spx
can create a rise in the vix since it would be a range expansion
and an increase in volatility.
I can be late to court .
good luck all
cant be late oops
DJI above upper BB. Looks to be printing a doji star.
I will be convinced if the next impulse down
1. Fills gap from today and yesterday.
2.VIX closes above 10.50
The next move down in the market should be sharp.
It should be coordinated.
It should demolish a few pivots.
Any more pussy footing and I am going straight to cash and sitting on the sidelines until we get some clarity.
Really quite amazing how this market continues to defy and and all prognostications of imminent weakness.
I am out and on the sidelines due to price action in VIX. It says we are going higher in the short term. 🙂
I have been watching and reading all the Elliott wave blogs that I can find the past year. Still can’t figure out why so many investors follow it-thanks
-VIX was around 11-12 when djia was 10k and it is still the same when djia is 22k after 7-8 years.
-Not sure why people are talking about VIX all the time which is useless for medium to long term investors.
-Little useful only for daily and short term trading.
-Majority tech analyst and cycle analyst have been consistently wrong since last 8-9 years, because they don’t want to admit that Fed/CBs are entirely controlling and manipulating market (at least India, EU, Japan, NA).
-Social mood, old data and all other legacy techniques are not reflecting their AI, PPT, Mathematical Algorithm and other advance technology.
-There will be a good news for all false stock market prophets one day (Harry Dent, Robert Prechter, Peter Schiff, Bo Polny, Michael Snyder, Jim Willie, Robert Kiyosaki), when Yellen & Draghi will deliberately pull the plug or remove PPT. Then all prophets will jump everywhere saying we were correct in predicting crash; since 2009.
-I would say Peter Temple is correct at least predicting short term trend for oil, currencies etc.
thanks & God Bless!
I have to say I agree with you on the subject of CB intervention. There are an awful lot of EW purists who like to argue that they have no impact on market price and I find that incredibly laughable. All you have to do to is watch market price action over the last few years and the conclusion is inescapable. It is really amazing to me how any one could be in such a state of denial about CB injections. All you have to do is look, for example, at the times of QE announcements and price action in the US market and the impact is clear. In fact one analyst (McHugh) thought it had become so important that as part of his analysis he started to include an indicator for the PPT!
also- I have come to the conclusion that here is the strategy of most stock market forecasters–keep calling the top every week and then someday you have to be right and then you can say and promote in your ads that you called the top!
Although I have not yet had success investing in equities over the past year using EW theory, I have made money based upon Peter’s analysis of oil, gold, the U.S. dollar and TLT.
🙂
Agreed marc. All of them I mentioned name above have been predicting top not every week but almost every day since last 8 years and one day they will be 100pct accurate. Rejoice!
thx
In fairness to all the analysts who have been wrong in calling market direction, the fact of the matter is that they have failed to properly take into account the size and duration of the impact of CB interventions on market price and direction. I do not accept the argument that this is explained ONLY by bullish sentiment. The gains in equities markets have been entirely out of proportion to real economic growth. In fact, I would argue that equity prices have become completely divorced from any kind of economic reality – case in point is how prices have continued to rise as earnings have steadily declined. Therefore based on economic reality, one can understand why many observers would conclude that markets could not continue to rise they way they have. Where they have been proven wrong, as well as those analysts who try to argue that banksters cannot exert any impact on market price, is underestimating the relentless commitment of central banks to continue to purchase equities, despite the state of the economy. Anyone who thinks that just because they announced that they have stopped QE means they are not longer buying needs to have their head examined.
Verne, Interesting info – someone is even considering PPT as an indicator, instead of just looking at macd & other old stuff, which whole world knows about and are lagging indicators…
thx a lot
Most welcome bp.
I sometimes get a bit frustrated with my EW friends who strenuously deny the brave new world of algos and CB liquidity injections. Frankly, for anyone who calls himself a trader, I cannot possibly imagine how you could miss it. I cannot tell you how many dozens of time I have witnessed price set-ups in this strange market which would have been readily relied on to follow a certain price path, would time and again at critical junctures do the exact opposite of what used to happen. I kept asking myself how in Hades could people not see what was so incredibly obvious???! My conclusion was that a lot of these folk were not really trading but living in a world of analytical theory.
Verne
Nothing exciting , went through jury selection process and was not picked .
Harry dent was late to using Elliott wave theory and did so after the 2000 2002 decline
Remember his book Dow 36000? Or the roaring 2000 ?
McHugh also a late arriver ( bad spelling ) to Elliot wave yet has a million indicators and his pi dates
Who h I’m not sure have hit in a very long time .
I think crediting the bankers for this continuation up is giving them way to much credit
As is giving credit to the Fed .
To each is own though
In late 1999 we were in a new era tech would go up forever
After the tech wreck it was real estate always goes up .
Now it’s buy an index fund and you will out perform the market
Once everyone finds that perfect trade and sticks their money in
Their is no more buyers and prices then fall .
Back in 2005 i saw so many first time home buyers I was surprised.
About a month ago I was in a 7-11 and one of the cashier’s was explaining
To the other a out he just opened a brokerage account and was explaining
How he was going to flip stocks . I have no problem with someone wanting
To learn to trade , it was the I can’t lose thinking process that made me shake my head
And say the end is nigh .
I don’t see anything different with this market today vs the 1990-2000
Boom . Back then it was blamed on the ppt now it’s the bankers or the Fed etc .
The bigger the bull the bigger the bear and vice versa.
You can call it a 9 year bear mkt
That is absolutely hilarious Joe!
Glad you got off scott free. Do you expect to be re-called for another selection process? I seem to remember I had to go back a few times. Sometimes I was ultimately selected, sometimes not before they cut me loose.
9 year bear 2000-2009
Or 12 year bear 2000-2012 Nov
Big bear and big bull followed .
Sticking to my game plan for now
Each week moving my stops up
Thus juggling act of 1 index running while the others stall
Is not a sign of massive liquidity in my opinion
We have had a few discussions about how passive investing funds have made the market a very dicey place to be and distorting market measures of risk. If you think that argument is over-rated, take a look at what happened to Altria recently, which is about 85% owned by passive funds. The FDA announced it was going to start regulating the nicotine content of cigaretts and KA-BOOM! Now here is the thing folk, you will not find a safe more stable stock than Altria, and look at how it reacted to that announcement. All those bloated NDX stocks trading at completely ludicrous PE ratios are going to make Altria’s dive look like a walk in the park.
verne
i’m call until Aug 10th
was initially supposed to show up in march though yet i was on the tugs working
and didn’t even get the letter until June when i was back home
she mentioned to me she may just make it a 1 and done for me yet
ill call in and check each night just in case .
Im not impressed by todays rally at all ,
the dow futures peaked at 1 am west coast time and never even came close
to testing that high in the day session today
the opening cash session based on the futures was a mini crash of sorts
and will become a support level at 21883 ( the opening level being 21885 )
despite an up close i view the Dow as a down day .
actually the low in the futures was around 25-30 minutes following the open
yet fits the view of a mini crash ( futures no cash )
something is up id say and ill dig through some other charts later
yet 21716 on the cash index is the level below the 21930 level.
still need a weekly close above 21930.50 for me to consider an acceleration
move further to the upside . today we fell into the range of 21939 22030
yet failed as i see it .
tomorrow is another day .
daily chart was calling for a whip saw early in the week with a close near present levels . can rule out a shake out to the down side
sticking to plan and will move stops up as needed .
I agree. Not too much follow through after the futures ramp. Notable is also refusal of SPX to notch a new ATH. It looks as if every one is waiting for DJI to top. Let’s see if that doji being printed above the upper BB means anything. It used to be a fairly reliable reversal signal. Sadly not anymore. More often than not of late, price can remain pinned to the top B band for weeks, and in some cases I have seen, even trade ABOVE the upper BB for several days. In all the years I have executed reversion to the mean trades I have never ever seen price behave like that. We talking about extra-ordinary extremes folk, anyway you slice it. This is the kind of thing that has kept me open to idea of our seeing a final top.
Cant rule out shake out to the down side i meant
and that is where the 21716 level becomes important .
leaving stops at 21472 ( mental )
breaking below 21404-21406 becomes more bearish.
leaving the rest as is no changes at this point
you wont hear me argue the risks because of passive investing in index funds
Verne . that’s what will drive those high flyers down when the selling comes.
a stock that is 12 % of an index gets 12 % of the inflows and also gets 12% of the outflows . no arguing from me about that .
it was just an example .
on the other hand take a look at us steel which is not in any index i know of .
its peak was in Feb and from high to low has been just over a 50 % drop
this year .
Running above the top of the band is a sign of an extension
i look for a close at or below the band before taking a trade
on the other side , an initial close below the bottom of the band
is a sign of a collapse, yet i not sure if what i use for bands is the same as bollinger bands
I think Bollinger Bands are two standard deviations from the mean price range…
Mixed price action today. NDX and SPX both printed candles with lower wicks. DJI printed a doji above the upper B band. If DJI is done futures should head South in a big way; if not we keep watching the paint dry. Later…
You know verne
i might buy a bit of rite aid .
its down and down and way down yet
im not sure that company goes under
not going to load the boat on it though
and not buying any time soon but going to keep an eye on it
and do a bit of research.
RAD
Peter- you have called for the start of wave 4 down and my question is how much higher can the S&P go up before the wave 4 starts before you would have to change your forecast? thanks
marc; Peter commented on that already today. Here is what he posted earlier
“The DOW broke its ending diagonal and tonight, ES is destined for a new slight new high to finally to probably touch the original target, which is 2485 for ES, 2488 for SPX. ES is now in the area of the first wave down.”
ill consider it around 2.30
it just caught my eye today
its an option trade for the most part
with no expiry
Monthly chart says give it room to 87 cents
60 minute chart says today may have been low of sorts.
ill take a bite at 2.30 and that is big percent risk yet not a big point risk.
ill make it a small position using some of what i get out of NVDA
cuts down dollar risk yet keeps shares , maybe 200-500 shares
and see if it can do something.
It really amazing how some stocks in a bearish decline can really pop. If somebody decides to buy them out you could make a bundle!
If fact I think it was the failure of a planned buy-out or merger that started the slide awhile back.
Also looks like bullish divergence with MACD and contracting BBs hinting at a possible big move…
Speaking of beaten down stocks, there is now rumor of unusual trading on Chipotle (CMG) stock. Apparently a lot of money has been made shorting the stock and the word on the street is that the food contamination happening recently has been deliberate to drive the stock price down and let folk who knew about it to make millions shorting the stock. Hard to believe people could be so evil but it really does not surprise me.
V
I think this is third time chipolte has a had a food
contamination problem . Not a place i want to eat at
note: bad tick at 22025 on dow futures
also note cash and futures are now about even on price.
Might be a short term trade tomorrow selling the market
with cash near 22025
have a target 22050 which may get tested .
I saw that and went “What the….??!!!!”
How do you know it was a bad tick? 🙂
There is some very weird stuff going in the markets lately with those kinds of spike happening more and more frequently. We had one down in Silver a few weeks back.
Something’s up methinks….
If Elliot Wave is based upon historical chart patterns that have repeated over the last many decades most of which the market was traded by people with incomplete information could it be that its utility may be less in todays market which is so much more controlled by trading algos? For example, seasonal trading techniques seem to be much less effective since about the mid 2000s, where as before they outperformed.
EW is not based on historical chart patterns. It’s based on patterns and fibonacci ratios that repeat over and over in a specific order and adhering in a trending market to a set of unbreakable rules.
The patterns and fibonacci ratios repeat over and over in a specific order. This is the EW analysis system. The context in which the system has been verified is the market movements through time. So without the historical chart patterns there could be no quantitative evaluation of the predictive value of EW.
QUESTION- could this be the final top or does it have to have one more wave up? opinions out there? thanks
Verne
i posted the interview of the guy who was an algo trader
and he talked about quote stuffing , if you look at a tick
chart of the futures the 1 tick jump then back down
at the 22025 level had to be a bad tick is all im saying
because there were no other trades near that level.
marc that could have been the top in the dow
yet im not sure it was .
the cash spx is still down for the month yet ….
price has been satisfied yet time has not .
if i take the pattern im following ( not elliot wave )
then next week should be vertical which implies a new
all time high in the spx and ndz.
Peter is correct in his definition of Elliott wave theory .
Todays high in the cash dow 60 minute chart
hit the 1.618 times 1 level .using hourly closing numbers
vs print if that makes sense.
i began the count from the july 11 low .
also if i use the print numbers and measure from the july 11 print low
to the july 24 print low i see a potential low to low to high count
that time comes early morning aug 4th which is Friday .
that for me is a better time to take a better short term
bearish position yet it would be only a day trade not a position trade.
a weekly closing above 21930.50 as far as im concerned is bullish for next
week.
The wave count from what i see is done, price projections have been satisfied
the only thing i have to concern myself with is time . time has not run its course
i know some favor price over time and more times then not this is a smart
decision yet in this case i must respect time because the pattern is text book
as i see it . the thing to consider is this. if the spx and ndx join the move to new highs will it boost the dow further ?
price is done , time is not done.
Joe
valley
your key words quantitative evaluation .
each wave should be looked at from a quantitative
point of view .
That is something i intend to research further later
in the year .
the point being each wave should have other aspects to them
which quantify them .
i look for time equality for instance also price equality or Fibonacci
relationships . time is not part of Elliott wave theory per say but
it should be.
selling short based on cash dow at 22146.
if we don’t get there tomorrow i wont trade
The 3 drives pattern can be considered an elliot wave pattern
wave iii then iv then v3 then 4 the 5
there is a cluster of Fibonacci time counts stacking up for Friday this week
and Monday next week .
you can count the bars 21 trade days 34 trade days and 55 trade days .
we have seen several swings that lasted 21 trade days low to high
also 34 trade days low to high as well as low to low .
come Friday Monday they all come together .
not sure that nails the top yet it should produce at the least a short
term high
taking all the above into account
2503 on the spx would be ideal
by monday .
a bit overly optimistic yet that is what the math says
based on time and price .
spx weekly
aug 17th 2015 was the weekly break down ( considered a high )
add 55 weeks you get week of sept 5th which was another break down
and considered a high, add another 55 weeks you get week of sept 25th 2017
which should be another break down if this is going to continue .
the day of sept 29th should be a lower swing high similar to a wave B or wave 2.
if i back this up a bit , the week of july 13th 2015 was the closing high before
the decline , add 55 weeks you get the week of aug 1 2016 , the market stalled for a few weeks
then thrusted down the week of sept 5th ( 55 weeks following the aug 17 2015 thrust )
add 55 weeks to that august 1 2016 stall out and you get the week of aug 21 2017.
the week of oct 31 2016 was a weekly closing low and print low on the spx .
add 21 weeks you get the week of march 27th 2017 ( beginning of Venus bull cycle )
add 21 weeks to the march 27 low you get the week of aug 21 2017 .
the week of jan 11 2016 was a momentum low ( not the actual print or closing low )
add 42 weeks ( 2 * 21 ) you get the week of oct 31 2016 low add 42 weeks again
you get the week of aug 21 2017 .
from the week of nov 28th closing low to the week of april 10 closing low
you get 19 weeks , add 19 weeks to the week of april 10 and you get the week
of aug 21 2017 .
odd ball fibs
week of june 26th plus 8 weeks = aug 21 week of
week of may 15 plus 13 weeks you get week of aug 14th 2017 ( 1 week early )
week of march 27th plus 21 weeks = aug 21 week of
dec 26 2016 plus 34 weeks = aug 21 week of
how many time lines can i point to that all point to the week
of aug 21 as important ?
next post will be the daily fibs and i mentioned a few that stack up into Friday/Monday
yet there is more.
digging online today trying to find some old info on prechter
i find it amazing that most say he correctly predicted the 1987 crash
which is not even close to being true .
he did say sell after the market fell further than he expected yet that was money management , if my memory is correct prechter was looking for a 4th wave decline
to be followed by a 5th wave advance up towards 3600 yet the dow failed and crashed.
This website is for educational purposes relating to Elliott Wave, natural cycles, and the Quantum Revolution (Great Awakening). I welcome questions or comments about any of these subjects. Due to a heavy schedule, I may not have the time to answer questions that relate to my area of expertise.
I reserve the right to remove any comment that is deemed negative, is unhelpful, or off-topic. Such comments may be removed.
Want to comment? You need to be logged in to comment. You can register here.