
Wave Four Continues: A “Great Fall” is Not Far Off
For weeks now, I’ve been expecting a large fourth wave as part of a motive five wave sequence, because that’s what you’d expect to get in a normal market. We would expect an end wave in 5 waves at the very top. However, the market has spoken and we’re now not likely to get a large fourth wave.
This action confirms my count as a corrective wave in the SP500. Therefore, we have the tail end of this zigzag up left to go and that should be the end of this rally. Therefore, you’ll find the large fourth wave missing from my projection and I’ve created a Big Picture video to show what I’m seeing across major assets.
Currencies and the US market are all in corrective (countertrend waves) that are nearing an end,
In short, this all points to a major turn down in the next couple of months.
Two weeks ago, the market signalled a downturn. We are in a wave four. However, it’s not the very large fourth wave of a 5 wave ending wave. Rather, it appears that we’re going to get a much smaller 4th wave, which will be the fourth wave of the final 5 waves of the final zigzag.
This means that the final wave up from here should be the final wave of this huge rally. In that case, I put the top less than two months away. My preference is for a turn in the first part of September, but we could levitate a little bit longer.
The short term path will be continued downside (a C wave of an ABC correction in the US indices) and then a turn into the final wave up … perhaps later this week or next.
The Bigger Picture
I put together a video on the market “Bigger Picture” which shows some of the elements I watch that are all pointing to a major top in the US market being imminent.
The Big Picture  |
 |
Make sure you zoom the video to full size with frame expander (arrows) in the bottom right hand corner and also set the quality to as high as your web connection allows. This is an HD quality video so the best viewing is at that level. |
______________________________
Tops in your field DZ 2
Tops in your field …You are tops in your field. Tried to follow Elliot Wave international for years. They were always behind the market. After discovering you, I perceive that you are an expert in reading the waves, which puts you way ahead of the rest of your peers. And you can read the Waves like you are reading tomorrow’s financial section. I pray you stay healthy. —DZ |
Get an upper hand … JC 2
Get an upper hand in trading …Seeing all the different currency pairs and the wave structures and hearing you explain why this has to do that on a nightly bases gives one a upper hand when trading. Elliott Wave applies to all stock and indices and can be applied to any candlestick chart. If someone ask what you want for Christmas – Tell them a membership to Peter’s “Traders Gold!”—JC |
Rise above the rest … SM 2
Rise above the rest …I have only ever met a few people who, in their chosen fields (astrology, medicine, music, martial arts, technical analysis), rise above all the rest and you are one of them…you have ‘the gift’…and that’s why I’m a Trader’s Gold member. —SM |
A true expert in Elliott Wave FL 2
A true expert in Elliott Wave …You are a true expert in EW analysis. What you provide is not available anywhere and is priceless. Subscription on your services is the best thing I have ever done. Many thanks for your effort to make me a better investor. I now have more trust in my investment decisions. I hope you will continue the excellent work! —FL |
Couldn’t be happier … KK 2
Couldn’t be happier …The analysis and insight you provide is simply amazing! I’ve been trading the futures and equity markets for well over thirty years and usually average around 5% monthly. Since joining your Traders Gold Service two months ago, that number has better than doubled. I couldn’t be happier.—KK |
the real deal SM 2
The real deal …‘Educational, insightful and thorough market analysis for all levels of traders. It’s Elliott Wave at its best….Peter Temple is the real deal’ —SM |
Have not had a losing week RW 2
Have not had a losing week …I have been with Peter almost a year. The only thing that matters is have I made money with his service. I think I have finally turned the corner using Peter’s EW. I have not had a losing week in the last 5 months. Thanks Peter, for your amazing amount of hard work. —RW |
The best of them JL 2
The best of them …Last couple of years, I subscribed to several ‘market traders’. You are by far the best of them and the personal contact is awesome. Daily and daily updates are very well written! Besides your expertise in EW, I also like your cycles analysis. Best investment I ever made! —JL |
The Market This Week
Here's the latest daily chart of ES (emini futures)
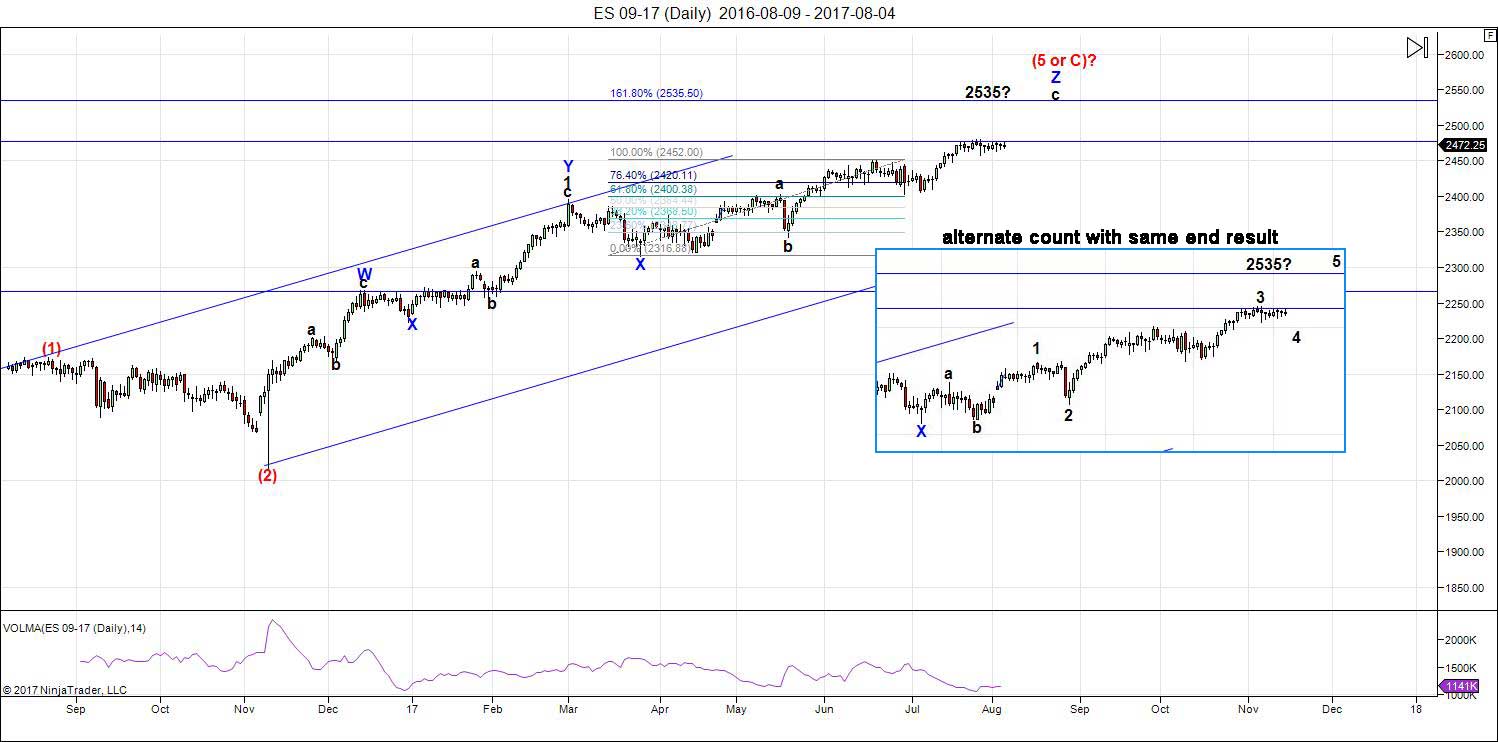
Above is the daily chart of ES (click to enlarge, as with any of my charts). While we still have another leg up to a final high, we're not done with this fourth wave yet.
It has become obvious over the past week that we're not going to get the large 4th wave that been expected for so long. That was a projection based on this pattern somehow morphing into a five-waver, which you'd traditionally expect. We have one in the NQ (Nasdaq), but as I've been saying for a very long time, the SP500 has a different structure, a corrective one. That only requires a three wave structure overall.
There are two ways to count the final wave we're in (the blue Z wave). Interestingly enough, the measurements come out to exactly the same projected top: 2535. For many months, I've had a projected top of 2500-2550. We're close enough now that the measurements can be a bit more accurate (I hope).
The subwaves will end up tracing out five waves, but the larger structure is a triple three (again my contention for months now) and, if that's indeed true, we're in the final fourth/fifth wave combination of the final zigzag.
The USD currency pairs are in countertrend retraces at the moment (small fourth waves), also getting ready for the final wave in their larger countertrend moves.
Summary: The final wave four is in progress. It will be shallow and lead to a final fifth wave up to the market high.
______________________________________
Sign up for: The Chart Show
Wednesday, August 16 at 1:00 pm EST (US market time)

The Chart Show is a one hour webinar in which Peter Temple provides the Elliott Wave analysis in real time for the US market, gold, silver, oil, major USD currency pairs, and more. You won't find a more accurate or comprehensive market prediction anywhere for this price.
Get caught up on the market from an Elliott Wave perspective. You’ll also get Andy Pancholi cycle turn dates for the SP500 for the balance of the current month. There’ll be a Q&A session during and at the end of the webinar and the possibility (depending on time) of taking requests.
All registrants will receive the video playback of the webinar, so even if you miss it, you’ll be sent the full video replay within about an hour of its conclusion. For more information and to sign up, click here.


Peter
Thank you very much for covering all of it .
nice refresher as well on the dollar in respect to your timing.
excellent video
Ill keep my market thoughts for Friday.
35,000 ft is my style 🙂
tks.
🙂
Peter- first thanks for posting a free video update on your website- as usual the market does what people least expect and you can include skipping this fourth down wave as good example. All the Elliott wave people got this one wrong. the next thing is that the consensus across the board is that a bear market will start or even crash in September or October. I will take the other side for fun and say august since I have to be a contrarian! either way if it doesn’t happen soon the Elliott wave guys will all be in therapy! thanks
Thanks, Peter! PALS suggest top coincidentally with eclipse on 8/21; perigee, declination, and phase are all bullish until then.
I actually expect a choppy move down to a bottom August 21 followed by a manic fifth wave into early September, probably fueled by some sort of FED claptrap.
I personally think that a turn on 8/21 is too obvious … but I have nothing to back that up.
Bought one cheap (low vol) spy call today that expires after 8/21. Looking for a 3 % market up move next two weeks.
does anybody know woody Dorsey’s next turn dates? thanks
if you actually believe he knows, why not give it a whirl…LOL!
https://www.sentimenttiming.com/become-premium-member/
https://worldcyclesinstitute.com/party-like-its-2007/#comment-20311
Woody Dorsey – January 18, 2017
invest the 13:41 and listen to Dorsey provide his take on the market…then form your own opinion regarding his ability to call market tops and turns…
https://m.youtube.com/watch?v=74noAPoceSY
Fractal Pattern Update – Gary Dean, August 8, 2017
https://www.sentimenttiming.com/fractal-pattern-update-080817-gary-dean/
https://www.sentimenttiming.com/market-like-river-woody-dorsey/
A truly outstanding summary of where we are Peter. Thanks so much for taking the time and effort to put it together. It is an incredible gift for dispelling a lot of the confusion and uncertainty surrounding the recent market moves and an excellent road map for what to expect over the coming weeks. I concur fully with your analysis and I can’t telly how glad I was to see someone else thinking similarly and with data to back it up. I was starting to think I was missing something! 🙂
Verne,
Tks. 🙂
all the bears that have been so wrong for so long and all the wave and cycle guys that have tried to call the top over and over and over are all about to be finally right. so next time you start watching cnbc and Bloomberg they will be asking these bears on their show for their advice and forecasts who they have been laughing at for the past few years. thanks
It is certainly true that those who have been urging caution in these markets have looked silly as the they have continued to relentlessly power higher. I have a sneaking suspicion that after the top is in and the down-turn arrives all the same current bullish talking heads are going to start bleating about how we missed all the warning signs that persisted in the market for so long before the turn finally came. For anyone who cares to look those signs are intensifying. Last week Nasdaq fulfilled Hindenburg conditions every single trading day- absolutely incredible! VIX continues to trade as if market risk is non-existent; the world’s most popular ETF, SPY, recently recorded a new 52 week high on the lowest volume of the year for the very first time that was not around a holiday. Geo-political risk is through the roof as the morons in congress continue to poke Russia in the eye as they along with other BRICS nations methodically put plans in place to destroy the dominance of the Petro-Dollar. It looks like a hot war in NK comes sometime next month- I could go on but you get the picture. Now of course all this does not necessarily mean that a crash is imminent, but to argue that caution is not warranted is pure insanity. I can’t wait to hear the howling from folk who foolishly ignored what was as plain as the nose on their faces, and end up trying to pin the blame on everyone but themselves for their own failure to take necessary precaution to protect themselves. A recent survey showed a majority of investors stated that they would remain fully invested even if valuations became as extreme as they were in 1999! People have short memories indeed. The gravity and unprecedented nature of some of the things we are seeing in markets to me strongly suggest something huge, and similarly unprecedented is approaching- am I missing something??!! Nuff said… 🙂
VERNE- the only three things that I know is that the market is going to hurt people very very badly so investors learn that the stock market has serious risks and is not an automatic way to make money and two nobody knows when it is going to happen proven- and three then watch everybody say “I called the top” in their newsletters and I the media!!!-thanks
Everybody know market is collapsing. It’s only the timing. Markets keeps on going higher and higher. TP keep on changing and changing.
If everybody knows this, the crowd is certainly not acting as if they do…
I’ve read it somewhere: investors have become fatalists.
Peter- with so many people calling for a crash does that worry you? thanks
Peter,
Is the 4th already finished.
There has been no correction in this market for the entire year. What we are seeing in my opinion is a significant top. If it is not the final top, I do not believe we will see a final top in 2107.
Summer doldrums. No rational reason for market to power higher. Surprise rally lasting into September. Complaints by pundits that this is unsustainable. Market flattens in September into Fed.
Central bankers have been buying their domestic equities markets. Some have admitted it like the BOJ. We also know that the Swedish central bank is one of the largest holders of FANG/ FAB FIVE stocks. We also know that these institutions are permitted to leverage their trades as much as 30:1. Nobody has been talking about what happens to the capital ratios of leveraged holders of technology stocks and other equities with a 5 – 10% decline. They cannot allow this market to decline. If they do it’s game over. This is the reason I am keep saying we are not going to see a normal decline as the banksters are committed by necessity to keep it from happening. I now think their survival depends on it as even the ones who have not admitted it are in global equities markets and leveraged to the hilt. Any downturn in the markets is going to happen in the face of their most determined attempts to stop it. For obvious reasons it could become a very disorderly process. The way the gaps down this morning were bought really made me smile and is a classic example of what I am talking ’bout…. 🙂
If King Dollar goes into exile, the investment of FANG will decrease in the home currency. Another reason foreign investors will insist on FANG price buoyancy to support their asset base.
on the cash dow daily chart
from the july 6 th closing low
july 24 closing low
waves 1 and 2 placing today as possible short term wave 3
from the july 18 print low and july 24 print low
another combination point to today as a short term wave 3
21898-21848 in my opinion would be a minor wave 4 extreme
based on these short term daily chart waves .
also today’s high at 22179.11 was just 2 pts above the mid point
between 22044 and 22330 .
this places 22044 as a support level .
sticking to my plan of using this weeks highs as the pivot able
level going forward on the weekly chart .
21861.71 was last weeks low
21841.18 – 21861.71 is a gap on the weekly chart which may
or may not get filled ( to soon to call it )
keeping mental stop on cash Dow at 21472 for this week
and raising it next week to 21758 .
see you friday
http://imgur.com/CwdgpPh
Topping tails forming on the indices. Marc’s SDS finally put in a hammer.
Aside from uvxy, it turns out sds also did a reverse split last 7/17/17. https://www.splithistory.com/sds/
Peter
strictly a wave structure question
can an ending diagonal have as part its structure ( sub waves )
2, 5 wave moves with in it that only total a 3 wave move ?
example
1 2 3 4 5 then a b c then 1 2 3 4 5 ? ( as a completed sub wave )
it would only be a 3 wave move as i see it if that were to occur
but i m curious if it satisfies or breaks any rules ?
I would think that is acceptable yet curious if you agree.
Joe
That’s a zigzag you’re talking about and an ending diagonal is made up of them.
Yep. ZZs are 5,3,5!
I figured it was ok
thanks for the reply 🙂
utilities might make a new all time high
the monthly chart looks interesting to me
from 2002 to date ( Log Scale Chart )
also utilities
monthly log scale chart from 1971 to date
if you draw in the trend lines off the tops
$UTIL is the symbol im talking about
Dow jones utility 15 stock average
TRADE UPDATES
Got assigned my short 8.50 USO put options even though they expire a week later.
That is usually a sign that thy buyer expects the puts to loose value and had a bad spread on options. Still short the shares.
Still holding GLD bearish call spread.
Closed short leg of SPY 246/247 bullish put spread on this morning’s pop and still holding 246 puts at zero cost basis.
I am oh so curious to know when the herd is going to figure out that the so-called fang stocks are ridiculously over-priced by a factor of at least two and possibly four?
Are they going to all make a rush for the exits at the same time, or will it be a slow bleed with suckers holding on with the expectation that all the loss value will certainly be recouped, just as so many did during the last tech wreck??!
It is truly unbelieveable that these lemmings do the same thing over and over and over again! Don’t these people ever learn from history???!!!!!
Nope … is that answer to that question about learning from history.
Looks to me like they sold the close
and im getting some weird charts .
not sure whether to believe this or not
yet its showing the market down 1.5 % right now .
it could be a couple bad closing prices yet
if its not its going to be an ugly open
for what its worth .
That is what I would expect but I am not seeing it in any of my futures data feed. I have not checked Bloomberg yet though. They clearly tried to ramp it this morning with an close of the open gap down and jacking things up past the consolidation area. I heard from a few folk who got really excited and announced that a break-out was underway and went long. I tried to caution them and said I would not be too hasty. I used the move up to cash out my short SPY 247 puts for a nice double. Clearly most traders did not buy the phony pump and once we came back down to the gap area I figure that was all she wrote. I really want to see VIX B bands blow apart though before I am totally convinced. I think the VIX short positions are once again going to try and ride out the correction without unwinding as they have successfully done for the past year. Watch VXI B bands tomorrow. They will tell us if they are going to have to capitulate.
it must be a bad tick somewhere
i cant see them holding up the futures
its just strange.
verne
odd that they assigned you early
Probably poor spread on the in-the-money options that did not reflect intrinsic value. They are also thinking USO is going lower decreasing the options value so they exercised.
I am also a bit unconvinced about today closing sell-off. They tried to smash VIX back below 10.50 and failed but VIX Bollinger Bands should be exploding outwards ahead of a big move down. Either the move is going to be brief and shallow, or this historic complacency is gong to result in one hell of a VIX spike.
I don’t like the fact that VIX price is already tapping the upper B band. If futures don’t tank overnight, the banksters could manage to keep this sideways action going a bit longer.
its not a bad tick
its PCLN
price line down 140-150 pts
they beat on earning and got hammered
it was 7 % hit roughly .
i forget its NASDAQ weighting .
PCLN is a bloated pig and has been on my watch list for some time. I think it has a long way to fall and i”ll probably get loaded on the first dead cat bounce. I am showing futures down around 0.5% across the board but I think the party is just getting started. I think the lemmings are starting to think about geo-political risks finally! What dummies! 🙂
Peter- you don’t respond to my questions-why? thanks
marc I know your question was addressed to Peter but for what it is worth, I notice you sometimes ask some very specific questions about trading and you may not be aware that Peter has a subscription service where traders pay him for his specific market analysis. While he is often very generous in giving his market insights, I am sure you understand it would not be fair to his paying customers to get in the habit of responding to specific trading inquiries. There is a weekly seminar on Wednesdays that I sometimes attend when Peter gives a very detailed analysis of lots of markets for about an hour that is well worth the investment of time and capital! 🙂
Verne-thanks for the info- i thought people on this blog were just reading the free weekend report and freewheeling- I thought the paying subscribers were commenting on the gold report blog- thanks!
verne- also the debate is fun on this website not knowing anything about the success or failure of the writers. I was a deep value fund manager who has retired and I spend my day playing the markets and I like writing on this and other blogs. sometimes I even learn something or gain some interesting insight. thanks
While lots of folks don’t hesitate to voice market opinions, very few will talk about their actual trades. It is always interesting to hear what others have to say. Much more interesting when they have demonstrated some applicable knowledge of what they are talking about! I for one am always eager to learn from the experience of others and find in a bit tiresome when assertions are thrown around willy nilly with nothing to support the point of view. You know what they say about opinions….! 🙂
BTW, I wonder what Tom’s energy charts are showing these days?!
I have been taking a look at the charts of a number of the Canadian banks. I think the are all probably in trouble but one chart in particular looks as if it is shaping up for a big move, and that is Bank of Nova Scotia. The B bands are starting to get very tight and if I had to guess based on what is going on in the real estate market up there, it is not presaging a break out to the upside. Opening a an order to buy December expiration 65 strike puts of limit of 4.50. Spread at 4.30/4.70.
The charts of these banks are not yet reflecting the carnage that is ahead. As someone once said, it is like money lying in a corner ( I think it was Jim Rogers). 🙂
the only bad part if we do crash is that I get to hear from everybody on CNBC and on every investment blog that they called the top, Even though they have called it every month for the last three years!! haha
watching 21930 on dow futures near the open first hour .
no timelines just testing a few things this morning.
if that level holds ill look to go long
present bid 21946 ask 22046 , its been a steady 100 pt spread.
they sold stocks yet have not dropped the futures to drop
it back to the apex of the triangle yet they did do that with the stocks .
all thing s being equal dow futures should be in the 21925-21920 range.
as i said this is just a test so ill take the trade if i see the 21930 print on
the futures ill keep the stop fairly tight because this is a new method
lol live and learn .:)
it dont look all that great and this will only be a very short term trade
if filled
That big VIX trade is moving in the traders direction. He is now off the hook for the short VIX 12.00 strike puts so the trade is already in the money. Now for every dollar VIX moves above 15.00 he starts to make some serious coin. I would bet anything he has a contingent order to exit the trade when VIX hits the sweet spot of 24.99
well brad Gudgeon is calling for a waterfall decline for the next 5 over days- I hope he is right but he hasn’t been correct on anything the past few years.
Then why bring him up? 🙂
it could be his time to shine!
nap time
cancelled order will check back in an hour .
adv dec looks a bit ugly
verne
i imagine that big vix trade is a hedge or sorts
and some big bucks sitting somewhere very well hedged.
just a guess but…..
print high in dow was yesterday obviously
closing high was the day prior .
tomorrow or early next week could be a low
and ill only say could if this is a shallow decline
if it is shallow the dow wont close below 21989.
seems ridiculous but it would be relative
to the july 14th and 19th closing highs to the
july 24 closing low .not going to claim that its
just what im considering .
dow futures are holding up fairly well relatively .
for some time I have been an astro naysayer…however, I am beginning to wonder…
three financial astrologers have recently identified the time frame around August 11 as important…according to one of the financial astrologers, the 45 degree angle between Uranus and Neptune is geocentrically exact on August 11 (between the lunar eclipse on August 7 and the solar eclipse on August 21)…
many moons ago one of the financial astrologers forecast the November 2016 low and forecast a high during the first half of August 2017…if yesterday’s SPX high holds he will be worth the cost (and a whole lot more)…
“The two key dates on our war model with North Korea to watch are August 12/13, 2017 and September 11/12, 2017.”
https://twitter.com/StrongEconomics/status/895333488601088000
Olga Morales IS NOT one of the three financial astrologers referenced in the prior post…
https://www.youtube.com/watch?v=sIL-MhV7OeE
So far as the bearish case is concerned, I don’t like what I am seeing.
First is the behaviour of VIX. It has now penetrated its upper B band and lately that has been a signal of an end to the down-trend. At the start of significant declines the B bands tend to expand well ahead of the VIX move higher to contain price and ti simply is not doing that. A huge red flag for the bears.
Second is that pesky SPX 2470 pivot. The initial decline for a trend change at this degree should take it out period! No messing around and meandering around it and look at what is happening again today. They have managed, incredibly, to move price back above it. This is totally nuts!
Based on what I am seeing I am just not ready to call a turn. Too many question marks about what price and vol is doing. This is insane!
The fact remains that this incredibly distorted market continues to do things that no one expects and which at first glance would seem highly improbable, yet it continues to happen. Directional bets continue to be risky indeed, particularly when it comes to downside expectations for the market. I have never quite seen anything like what is going on and am at a complete loss to make sense of it. I guess one has to simply go with the flow…. 🙂
Verne,
/ES went way beyond lower B band. Buyers came in at open to try to fill gap but other traders want to retest pre-mkt low during regular trading hrs. It went there, support was there. See 1hr hammer candle. Now bulls want to fill the gap. Bears who covered shorts at open will wait and see what happens if gap fills.
Price has already move beyond yesterday’s low. Not very bearish imo….
Looking forward to Peter’s take on the chart show today. 🙂
LIZH- what is your opinion of the market? You know that I went long SDS- thanks
Marc,
what does it mean “deep value fund manager” that you were ?
Well, just “deep value” ?
The other words I know.
Marc,
My opinion is my response to Verne early this morning. Cover some short at open, cover all when /es hit pre-market low price at RTH. I’m waiting for bulls to push it up to fill the gap.
Marc,
Too many open interest in 246 SPY puts expiring today. I’ll be surprised if SPY goes below 246.
Although I was expecting a deep second wave bounce, that 2470 pivot was my line in the sand. I have always felt that until SPX surrenders it caution is warranted. It looks like we move deep back into the gap area by the close.
ok everybody- going to new highs again or going to fall sharply and starting the bear market? opinions?
Marc,
PALS suggest higher prices, especially after Friday, lasting into the eclipse on 8/21.
what the heck is PALS? thanks
PALS is an acronym for Planetary Angle Lunar Seasonals. It is becoming of deep value to me in analyzing probable market direction for swing trades. Mostly based upon moon distance (my research), declination (Olga Morales), and phase (Danny at Lunatic Trader).
Sold my spy call at loss today. Don’t want to be long until the Korea tensions have calmed down.
marc
i m curious as is Dimitri
what what did you do as a deep value fund manager ?
what does deep value even mean ?
how do you know the difference between value and deep value ?
what metrics did you use to decide ?
thanks
I was a portfolio manager for two different funds and managed money for wealthy individuals for over 30 years. deep value is distressed companies in either their equity or debt and in either public or private companies. it also included turnarounds and contrarian style investments. thanks
retrot
im with on the astrology stuff yet i watch the astronomy more so .
just a thought for you though .
you can do a google search of his date Aug 12/13 and sept 11 12th
just type in the date with astrology afterwords . i do this sometimes
just to get others perspectives that are not stock market related
i find it interesting though that he doesn’t find the solar eclipse
important ?
august 12th mercury goes retrograde which is does a couple times per year.
if you take mercury begin date and end date and add 10 days
aug 12-sept 5th you can see aug 22 and sept 15th . sept 12/13 fit into this as does
aug 12/13th . yet we still have the solar eclipse . there is more which surrounds
sept 15th yet id have to look it up .
no doubt its going to be interesting .
A deep value fund manager could be one that invests in either mining companies or in offshore oil field drilling companies. Both work in the deeps, and their price to earnings ratios are also deeply oversold values.
I do think energy is getting very cheap but I wouldn’t be long any equities with the market so high and I do believe the market could fall over 50 percent in the next couple years. I said for over a year in 1999 that the tech market would crash and people laughed at me for a whole year and said I should quit the business and etc… then it fell 80 percent!!!
Good call, and thanks for sharing your experience. I am bullish until 2020 based on Trump effect (dereg, tax reform, cheer leading) and decade effect years 8 and 9 best of decade usually.
satire
https://www.armstrongeconomics.com/international-news/nature/the-new-russian-conspiracy-they-moving-the-north-pole-to-freeze-europe/
retrot
https://www.armstrongeconomics.com/world-news/war/north-korea-beware-august-2017/
The two key dates on our war model with North Korea to watch are August 12/13, 2017 and September 11/12, 2017. We must be on guard for these are the prime periods where a confrontation could emerge.
guess you already posted this
sorry i didnt click the link earlier
spx low feb 11 2016 to nov 4 2016 low was 267
calendar days , add 267 calendar days to nov 4 2016
and you get july 29th which failed ( we did see a high though on july 27th
as well as aug 2 yet neither of them were meaningful highs)
using the dow
jan 20 2016 low to nov 4 2016 low you get 289 calendar days
add 289 calendar days to nov 4 2016 and you get
sunday august 20th .
using the dow again using trading days
jan 20 2016 to nov 4 2016 you get 202 trading days
adding 202 trading days to nov 4 2016 you get
august 25th 2016 .
ive been focused on august 21-22 for a long while now
yet ill expand it a bit and say august 18th-25th is the important
date range . that would imply ill give this market into next friday
before taking any bearish stances .
lowers highs or higher highs are acceptable as far as i am concerned.
that is the timelines im focused on for an important turn .
not going to swear its a high or a low . im going to let the market
show me and then make up my mind as to how to trade .
my bias though is it should be a high .
at the end of the day the market is always right .
My reasoning for expanding the date range is
my way of giving myself a time based stop so to speak .
as we enter the date range and assuming the market is going
to turn with in that time range .
ill ride out any draw downs in that specific time frame only.
if the market then fails to prove me correct while leaving
that time frame ill exit any positions and wait for another set up .
as for the main key swing dates , i have aug 21-22 as well
as sept 29-oct 3rd .
those date ranges should both be the same : both highs or both lows
its now up to the market to show me .
for tomorrow ill be more interested in nvda earnings announcement
and my exit strategy with that stock .
the rest stands as is and i haven’t changed that .
an august 21-22 low targets a late October high which is
a whole different set of parameters, some of which run into next year.
nuff said
personal rule of thumb
anything that doubles in 6 months should be thinned of sold out of
nvda made its closing low feb 2017 adding 6 months is this month
august , the closing low was 95.70 a double of that being 191.40
my intent is to sell at 180 yet ill see where it sits near the close
before the news and decide if ill hold till Friday or not .
that’s the guidelines im working with .
https://www.crescat.net/crescat-capital-quarterly-investor-letter-q2-2017/
Red Dog,
Thank you for sharing the newsletter.
“WMPs are such big business that the Chinese tech juggernauts including Alibaba’s subsidiary, Ant Financial, Tencent, Bidu, and JD.com have gotten in the game. In our analysis, these companies, wittingly or not, through their “fintech” businesses, have become a central part of China’s grand Ponzi financing scheme.”
Why is this not explained by Jim Cramer or the Fast Money hosts. I only hear “Jack Ma, says his company will be worth more than the world’s fifth-largest economy by 2036.” https://www.rt.com/business/392530-jack-ma-alibaba-fifth-economy/
Steve Sjuggerude of Stansberry Research has been pounding the table about what a great investment opportunity China represents. Even before I read that article, based on what I knew about China’s economy, I got the feeling the man was on the Chinese government payroll!
I come from the world of marketing and copywriting. Stansberry is under the umbrella of Agora. They hire nothing but the best copywriters in the world. I know one of them, making 7 figures a year writing sales pitches for them. Those dudes could care less if you win or lose. They’ve got a sales funnel that’s un-freaking real.
very wide bid ask spread in the overnight session
dow bid 20600 and 22182.
this is based on individual stocks that make up the dow
and not the futures .
still waiting for a 21930 print on the futures
this site has been fun but time to move on- I have read about energy cycles and solar cycles and Elliott wave cycles and mathematical cycles and sentiment cycles and astro cycles and just plain market cycles– I am not sure any of them work in these crazy markets but if anybody can say they have made lots of money following-please share-thanks
We will keep the light on for you.
i gave the 21930 a few stabs and got stabbed
im finding the stock data insightful though
and peter im learning to appreciate the multi screens but
it makes my head spin . sitting tight for now and not ready to
give into the downward move just yet .
looking for dow futures at 21869 before next attempt .
biggest mistake for me was not thinking through the 22179 high
even though i had it in mind a high . i got complacent .
lesson learned .
hey mike
i have seen a few of those guys over the years
they are excellent in writing stories with not really any substance
yet they sure know how to pull people in .
at the end of the day its up to us to make our own decisions
and trade what is in front of us .
This website is for educational purposes relating to Elliott Wave, natural cycles, and the Quantum Revolution (Great Awakening). I welcome questions or comments about any of these subjects. Due to a heavy schedule, I may not have the time to answer questions that relate to my area of expertise.
I reserve the right to remove any comment that is deemed negative, is unhelpful, or off-topic. Such comments may be removed.
Want to comment? You need to be logged in to comment. You can register here.