
 Monday is a US Market Holiday
The US market is closed on Monday for the Martin Luther King holiday. It will reopen Tuesday morning.
Countertrend (corrective waves)
The current corrective wave is a countertrend wave within a countertrend fourth wave — a most dangerous undertaking to trade it. Let’s take a moment to think about this.
The larger trend is still up. In the SP500 (and related indices), as I’ve stated many times, the overall trend to the upside is corrective itself (it’s a B wave). We’re not supposed to have those based on the work of Bob Prechter, but Ralph Nelson Elliott believed otherwise.
(There were a number of changes that Bob Prechter made to Elliott’s work, not always to good effect. There are many errors in the Elliott Wave Principle book, as I’ve highlighted in previous articles. However, it’s a great tool for learning the basics of Elliott Wave Theory).
| The Elliott Wave Principle: Key to Market Behavior by A.J. Frost and Robert Prechter (2005) |
 |
Fourth waves are corrective waves (countertrend structures) of a larger, five wave trend. The corrective wave that we’re nearing the top of this week is yet another countertrend wave — a countertrend of a countertrend of a countertrend. As such, they’re dangerous waves to trade, until they reach a top.
The problem with trading corrective waves, from an EW perspective, is that there are no rules as to the length of these waves, or their shape, other than the fact that they will be in three waves overall. Almost always, the C wave has a definite fibonacci relationship to the A wave. However, this can be one of seven different relationships (or wave lengths). So, it’s almost impossible to predict where they’re going to go, or for how long. This is particularly true of a corrective wave within a fourth wave.
When we’re in a full-fledged bear market (after the final cycle degree fifth wave to a new high) is in place, the major corrective waves, will most often retrace either at least 38% (fourth waves) or 62% (second waves). These corrective waves are difficult to trade, but not impossible, because upside targets are generally known.
Get used to seeing these dramatic countertrend moves, because they’ll be prevalent at predictable points within the impulsive decline that’s expected. In most cases, you’re much better to leave corrective rallies alone and “let them do their thing,” then look for a top (a first and second wave combination is the setup pattern after a trend change).
Corrective waves in fourth waves do not have these parameters and this makes them almost impossible to predict. So, keep this in mind in your trading.
To capitalize on the next wave down (starting this week) to a new low, the entry point, from an Elliott Wave perspective is after a first wave down to the previous fourth wave and a second wave up to at least 62% of the first wave down. You should enter after the turn down, or better still, once we reach a new low below the previous fourth wave.
____________________________
Elliott Wave Basics
There are two types of Elliott wave patterns:
- Motive (or impulsive waves) which are “trend” waves.
- Corrective waves, which are “counter trend” waves.
Motive (impulsive) waves contain five distinct waves that move the market forward in a trend. Countertrend waves are in 3 waves and simply correct the trend.
All these patterns move at what we call multiple degrees of trend (in other words, the market is fractal, meaning there are smaller series of waves that move in the same patterns within the larger patterns). The keys to analyzing Elliott waves is being able to recognize the patterns and the “degree” of trend (or countertrend) that you’re working within.
Impulsive (motive) waves move in very distinct and reliable patterns of five waves. Subwaves of motive waves measure out to specific lengths (fibonacci ratios) very accurately. Motive waves are the easiest waves to trade. You find them in a trending market.
Waves 1, 3, and 5 of a motive wave pattern each contain 5 impulsive subwaves. Waves 2 and 4 are countertrend waves and move in 3 waves.
Countertrend waves move in 3 waves and always retrace to their start eventually. Countertrend (corrective waves) are typically in patterns — for example, a triangle, flat, or zigzag. Waves within those patterns can be difficult to predict, but the patterns themselves are very predictable.
Trend waves move in 5 waves and partially retrace. The difference in these waves is not covered in “The Elliott Wave Principle” book. There are two types:
- Simple 5 wavers are found in zigzags, flats, and other nondescript corrective patterns. They have 5 waves, and sometimes the third wave has a recognizable 5 wave pattern, but most of the time, they don’t.
- Impulsive waves require each of waves 1, 3, and 5 to have recognizable 5 wave patterns in their subwaves
Fibonacci ratios run all through the market. They determine the lengths of waves and provide entry and exit points. These measurements are really accurate in trending markets, but more difficult to identify in corrective markets (we’ve been in a corrective market in all the asset classes I cover since 2009).
To use Elliott wave analysis accurately, you must be able to recognize the difference between a trend wave (motive) and a countertrend wave (corrective). There’s very much more to proper Elliott wave analysis, but this gives you the basics.
____________________________
Registration for Commenting
Want to comment? You need to be logged in to comment. You can register here.
If you register, it protects your information. It also allows you to comment without filling in your information each time. Once you’re registered, simply go to the home page and click on the login link top right in order to log yourself in. Usually, you’ll be logged in for several days before needing to be logged in again.
______________________________
Problem receiving blog comment emails? Try whitelisting the address. More info.
______________________________
the real deal SM 2
The real deal …‘Educational, insightful and thorough market analysis for all levels of traders. It’s Elliott Wave at its best….Peter Temple is the real deal’ —SM |
A true expert in Elliott Wave FL 2
A true expert in Elliott Wave …You are a true expert in EW analysis. What you provide is not available anywhere and is priceless. Subscription on your services is the best thing I have ever done. Many thanks for your effort to make me a better investor. I now have more trust in my investment decisions. I hope you will continue the excellent work! —FL |
Tops in your field DZ 2
Tops in your field …You are tops in your field. Tried to follow Elliot Wave international for years. They were always behind the market. After discovering you, I perceive that you are an expert in reading the waves, which puts you way ahead of the rest of your peers. And you can read the Waves like you are reading tomorrow’s financial section. I pray you stay healthy. —DZ |
Rise above the rest … SM 2
Rise above the rest …I have only ever met a few people who, in their chosen fields (astrology, medicine, music, martial arts, technical analysis), rise above all the rest and you are one of them…you have ‘the gift’…and that’s why I’m a Trader’s Gold member. —SM |
Get an upper hand … JC 2
Get an upper hand in trading …Seeing all the different currency pairs and the wave structures and hearing you explain why this has to do that on a nightly bases gives one a upper hand when trading. Elliott Wave applies to all stock and indices and can be applied to any candlestick chart. If someone ask what you want for Christmas – Tell them a membership to Peter’s “Traders Gold!”—JC |
Have not had a losing week RW 2
Have not had a losing week …I have been with Peter almost a year. The only thing that matters is have I made money with his service. I think I have finally turned the corner using Peter’s EW. I have not had a losing week in the last 5 months. Thanks Peter, for your amazing amount of hard work. —RW |
Couldn’t be happier … KK 2
Couldn’t be happier …The analysis and insight you provide is simply amazing! I’ve been trading the futures and equity markets for well over thirty years and usually average around 5% monthly. Since joining your Traders Gold Service two months ago, that number has better than doubled. I couldn’t be happier.—KK |
The best of them JL 2
The best of them …Last couple of years, I subscribed to several ‘market traders’. You are by far the best of them and the personal contact is awesome. Daily and daily updates are very well written! Besides your expertise in EW, I also like your cycles analysis. Best investment I ever made! —JL |
US Market Snapshot (based on end-of-week wave structure)
Here's the latest daily chart of ES (emini futures)
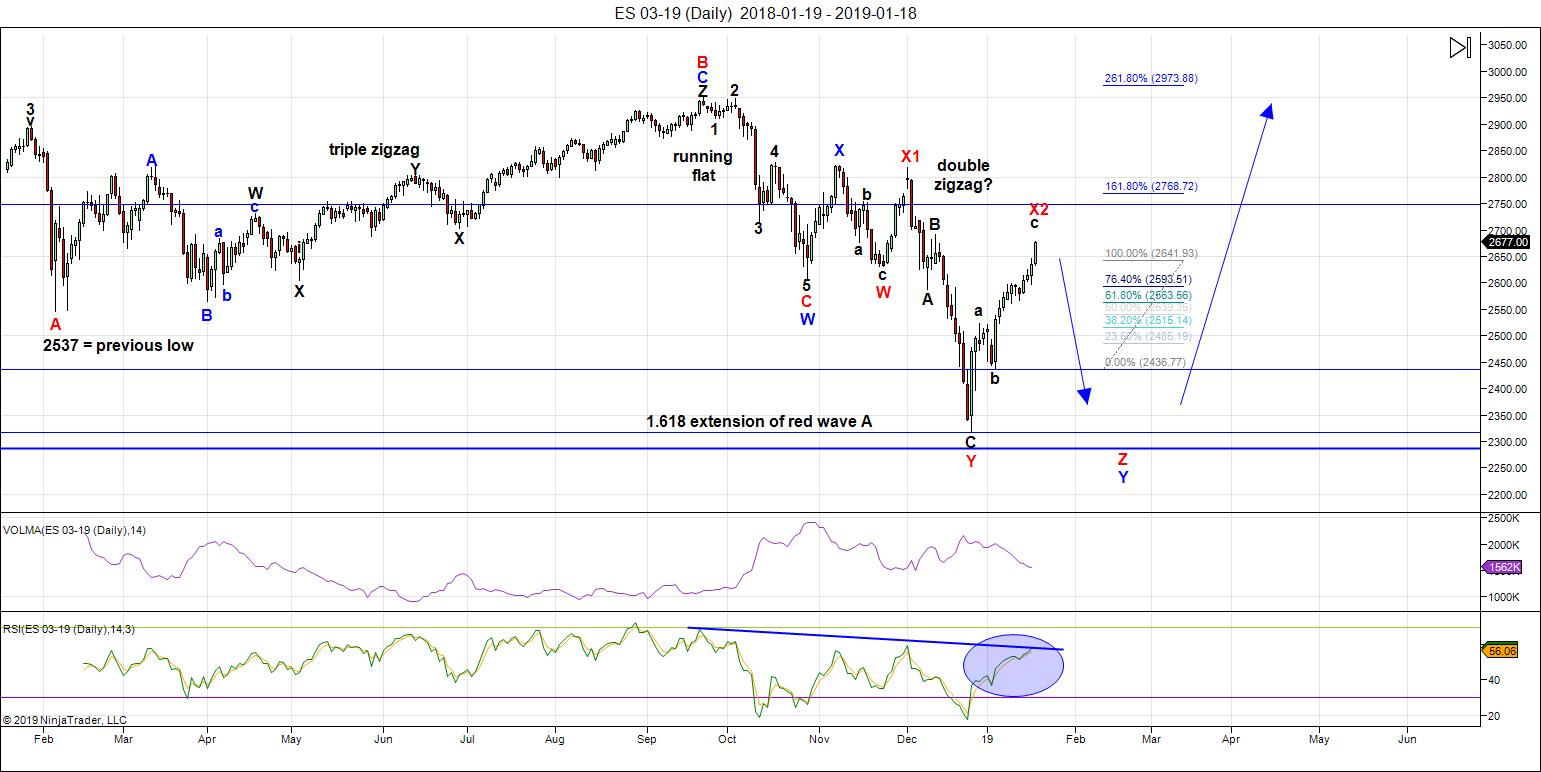
Above is the daily chart of ES (click to enlarge, as with any of my charts).
The current huge countertrend rally has lasted four weeks; it now appears to be in the final sub wave. I don’t have a clear indication of exactly where the top might be, but it’s relatively close. We’ll be looking early next week for a first/second wave Elliott wave entry point.
I put us currently at the top of the third wave of the fifth wave of the corrective C wave up. Wave counts in corrective waves are always extremely difficult, because often, the waves are not clear (and there is no commonality in their structure — corrective waves can be vastly different from each other, not like impulsive waves).
The final pattern to the downside is still up in the air. I would expect a zigzag to the downside, but with such a large rise, and with only two patterns determined so far in this large fourth wave, there are other possibilities. However, with currencies, the US Dollar, and Oil all expected to turn at the same time, the odds are that the wave structure to the downside will be a fairly solid drop of almost 400 points.
The downside target at the moment is the previous low at approx. 2318. We could drop lower, but this level is a fibonacci level which is a common stopping point for a fourth wave, and I have nothing to support a further drop (doesn’t mean it can’t happen).
So … we continue to watch and wait. Part of the issue is that many indices are in the same position internationally; it’s not just the US indices we’re waiting for. When the market is good and ready, we’re going to turn down … and I expect it to be very soon.
Summary: My preference is for a dramatic drop in a zigzag (5-3-5) pattern to complete a triple zigzag with a wave at least to the previous low that could start as early as Tuesday. The rally may have a bit more life, but it’s quickly coming to an end. The culmination of this drop should mark the bottom of large fourth wave in progress since January 29, 2018 – almost a full year of Hell.
___________________________
Trader's Gold Subscribers get a comprehensive view of the market, including hourly (and even smaller timeframes, when appropriate) on a daily basis. They also receive updates through the comments area. I provide only the daily timeframe for the free blog, as a "snapshot" of where the market currently trades and the next move on a weekly basis.
______________________________________
Sign up for: The Chart Show
Next Date: Wednesday, January 30 at 5:00 pm EST (US market time)

The Chart Show is a one hour webinar in which Peter Temple provides the Elliott Wave analysis in real time for the US market, gold, silver, oil, major USD currency pairs, and more. You won't find a more accurate or comprehensive market prediction anywhere for this price.
Get caught up on the market from an Elliott Wave perspective. You’ll also get Andy Pancholi cycle turn dates for the SP500 for the balance of the current month. There’ll be a Q&A session during and at the end of the webinar and the possibility (depending on time) of taking requests.
For more information and to sign up, click here.
| "I think you are the only Elliot Wave technician on the planet who knows what he's doing.” |
| m.d. (professional trader) |
All registrants will receive the video playback of the webinar, so even if you miss it, you’ll be sent the full video replay within about an hour of its conclusion.


Peter t
Thank you for your updates .
I must say this is certainly a difficult time
For me trying to figure out this market .
My main issues are:
The benner business cycle which has a very good
Track record . A 2018 high was forecast with a 2021 low .
The Venus bull market is basically a 20 month time period
From low to low . That cycle began in Oct I believe ( I need to look it up )
The mars Uranus cycle turned up Jan 4 2019 and it is a typical 2 year cycle
Low to low .
George Lindsay stated from a major high you look for an important
Low from 12 years 3 months to 12 years 8 months .
We are most definately coming into a series of cycle lows
Which begin as early as Oct 2019 into 2022.
What ever takes place between now and Sept this year
The bigger picture I must agree with you.
Anyways I need to do more longer term research .
I have been narrowly focused and now need to expand my research .
This next week is very important yet the following week
Is equally important .
Thanks for everything
Joe
Thanks indeed for the updates!
Every single good analyst I know is seeing us completing a five wave move with a fourth and fifth wave remaining to complete the move up. Some see this move as the C wave of an abc move off the Dec 26 lows to complete a second wave. Others, like Peter of course see an incomplete larger complex fourth wave still unfolding. The market has demonstrated repeatedly how difficult it is to call turns in this market, and whether or not it comes next week remains to be seen. I personally think the most reliable turn signal will be a gap higher that REMAINS open during the session. Good luck to everyone this week!
I intended to say a VIX gap higher….
Interesting developments Joe.
I am seeing quite a few counts that have switched to an impulse up.
Another analyst I really repect has noted that one of his intermediate trend indicators just issued a buy signal.
Lots of conclicting market signals.
If the CBs are now expanding, instead of shrinking their balance sheets, all bets are off imho…
Your long positions just might be the right side of this market.
One view is that we are in a falling expanding wedge pattern, with a 60% probability of an upside break. The size of the wedge is suggesting a very big move and a straddle trade was recommended. After a close look at bids compared to delta, I thought an options strangle was the smarter trade. SPY Feb 4 260/269 put/call fit the bill.
Also long DUST. Rolled 24 strike calls up to 25 on what looks like start of a fifth wave down in Gold.
Verne
The Dow and spx I only see 3 waves up on the daily chart .
I try not to force wave counts into what I want to see .
The nasdaq comp looks like a 5 but I have not dug into the wave
Relationships yet something does not look right to me just by
Looking at the chart .
The weekly Dow and spx was just 1 leg up and no way for me
To decipher that at this point .
Some stock charts do look like 5’s but also seeing many 3’s .
Short term overbought readings and a potential bearish
Puetz cycle from now into Feb 4 .
Until we get past this cycle or at the least see how the market reacts
My bias must be to allow for a downside move .
Breaking those Oct and Dec lows ( some stocks bottomed in Oct while
The indexs bottomed in Dec ) a break of the Dec lows makes
A solid case for an acceleration to the downside .
If we see a choppy sloppy pullback followed by another high
I’d be more comfortable but this present cycle even though
It’s not technically following the typical model has still not failed .
My bias being time more so than anything means this week
Will become a inflection point .
If I was to call for a wave 4 now on spx and Dow we still should
Expect a decline . The indicators also say expect a decline .
The intraday chart is a bunch of 3’s as well .
Option expiry weeks can skew the market as positions get unwound .
A decline following an option expiry is fine by me yet we also
Entered a possible mini crash cycle .
I feel like we should all follow world stock indexs to get a feel
For how this cycle is working, or not working .
One thing that gives me a slight bias that we bottomed was the peak
Price in the Dow last week did in fact warn of a failure to this present
Puetz cycle . That said despite that warning we saw a down market
From the early Dec new moon into the early Jan solar eclipse followed
By a bounce into the lunar eclipse . Not a perfect set up yet not a complete
Failure by any means .
At this point in time I’m going to keep all options on the table yet
I still favor a higher market by September .
I’m not going to get to short term focused once we get past Feb 4
As well as Feb 15-19 th .
Each leg at a time right now for me will help me define what comes next .
If this cycle is going to take this market lower then I’d avoid trying to
Trade with the mindset of seeing a bounce because there should not
Be any meaningful bounces for the next 14 trading days if this cycle continues .
At best we will see a bounce next monday yet this week would be just down.
A choppy market would tip the odds that it’s not working .
I cannot call this with much confidance at this point .
I’d say chasing downward momentum would work if we are going to see
This puetz cycle prove itself .
World markets included .
I’m keeping an open mind and have pin pointed my risk, my hedging stradegy
And my outright exit stradegy if things get out of hand and I have created my
‘re entry stradegy .
Now it’s up to the market to tell me it’s intensions .
Joe
Joe, one of the rsasons some analysts changed their count was the length of the C subwaves. Although Ellliott did not specifically state it, the entire concept of degree implies that a smaller degree wave should not exceed a larger dgree one in either time or size. I think that is reasonable, and see counts that routinely completely ignore this point.
Thank you for the post Peter! This will be worth the wait when it finally makes it…
2630 was the “stop” level through which the market ran to stop the bears. That is also the short term trendline support. Now trading below it. Next big support comes in around 2560-2570. I have now been following Joe’s astro dates for almost a year now and it has surprised me with its accuracy.
I have been trying to use the astro dates and have been adding them to my charts and trying to follow them as well and add to my trading…so appreciated Joe and I bought the book…
What book, pray tell?
I have agree. Of all the folk thrashing around on the forum, myself included, Joe’s calls have been, by far, the most accurate. Don’t know how he does it. I am totally lost on the stars! lol!
Very happy today on long vol trades!!!!
If the VIX gap open remains unfilled, I will add to short trades.
We will have an island reversal if the market gap down also remains open.
VX has an upside break from bullish falling wedge, as do other vol instruments.
We shall see if we do have a turn, finally…
Joe, you mentioned my suggested fractal for 8/24/15 makes more sense than early 2003.
Back in 2015, 9/28 full moon, 9/30 perigree. Swing low 9/29, 1 calendar/trading day after lunar eclipse.
For 2019, 1/21 full moon and perigree. Today, 1/22 is the day after, so covered my shorts.
Lol!
I added to my short trades today based on the VIX gap higher remaining unfilled.
Using a very tight trailing stop on open positions.
Here is hoping we do not get a gap down tomorrow.
What a bizarro market!!
Hiya Red Dog:
Another one from Luri…
.https://invst.ly/9syo2
Thanks Verne. Interesting times. What is your view on gold.
Long and strong DUST.
I think we are going to see a ferocious fifth wave down in precious metals, typical of commodity fifth waves, and the triple leveraged ETFs are gonna EXPLODE..he!he! 🙂
Here is an update of the chart I published a link to on Thursday night. https://imgur.com/a/OC68Aez Notice there was a slight throwover above both lines on Friday’s close but as I mentioned on my follow-up comment, it would take 2 closes convincingly above those lines to make one favor a bullish resolution. Today went immediately back below both lines in convincing fashion. For those of you who researched Speed Resistance Lines (SRLs), here is another for you based on the DJIA all-time high close on October 3, and its low subsequent close on Christmas Eve… https://imgur.com/a/odv3LlR SRLS are a great analytical tool, especially because so few technicians know them or use them. They are suggesting Friday’s high could be a lot more important than one might now imagine… Incidentally, if you research cycles or turning point patterns, check out 82 trading days from the 1-26-18 high. The next 3 turns fall on May 24, September 20, and 2 trading days ago, January 18… May 24 was a couple of trading days away from a pretty good bottom, but Jan 26 and Sep 20 were bullseye important closing highs for SPX. Will that also be true for January 18?
Jan 2019 perhaps? 🙂
OK, let’s deal with Steve Puetz for a moment. Joe and I have both posted about Puetz and lunar eclipses and their relationships to market crashes. I have great respect for Joe’s research abd if I differ with him in any opinions on Puetz’s work, it is only because I am quoting what Puetz has actually written about his research. Here is a post I made on this site around a year ago in February 2018:
Peter G
February 27, 2018, 10:41 pm
This is not a prediction. It is a reminder of the research by Steve Puetz (pronounced Pitts) on market crashes. 1)Lunar eclipses or full moons one cycle away from a lunar eclipse were always coincident to the beginning of the famous market crashes. 2) The full moon coincident to the beginning of the crash has always been within 6 weeks of a solar eclipse. 3) The “panic phases” of all 12 crashes studied were entirely encompassed within one of the following periods: a) February 4- April 5, b) September 3- October 29. … Puetz never claimed these conditions CAUSED crashes. His claim was that all crashes he studied were accompanied by the above conditions. Notice that we are very close to the Feb 4 to April 5 time window. Will we crash here and add to the research of Puetz by extending backward the apparently strict time windows he established? We had all best remember that true crashes are rare generational occurrences so you should never really expect one. That does not mean, however, that you should not be prepared for one if other technical factors line up. Based on the charts I have shown you over the past 5 days, we can argue there is a technical set-up. Let’s repeat…that ALLOWS for a crash based on most of the Puetz parameters (except for time windows) but it does not PREDICT one. As you know, there is a big difference!
Verne the book is called Forecast 2019 by Raymond Merriman…very interesting and good read..
Thanks Marie…
Peter g
Over this past year, you and I have been more in agreement with each other
Then apart . My hat is off to both of us in that regard .
Now when in it comes to the puetz cycle we do indeed have our differences .
About 17 years ago I dug through every crash and mini crash I could find .
I looked at chris carolans work as well as the ” puetz cycle ” from what I’ll just say
Was his original woork . I looked at 18 year eclipse cycles I looked at just about
Everything I could imagine by combining Chris carolans work to that of Steve puetz.
I’ll admit I have not read much of what puetz has written but I have studied all market
Crashes of various degrees . I believe credit should be given where it’s due. The puetz
Cycle I take seriously but I follow it on a very strict basis . I have seen it work just about every
Year with very high accuracy based on a very strict set of parameters . Now maybe puetz
Has altered or allowed for verious parameters that I do not but I give puetz credit for inspiring
Me to do all the research I have done . Chris carolan and his spiral calendar began with a very
Simple format using the moon for which he received an award for . Both these guys inspired
Me to research and to form my own opinion based on market history . Since not every crash
Plays out I learned to flip the chart upside down and found myself amazed .
Then I added James mars langham along with Donald Bradley’s work which has taken me
Thousands of hours to put together . In total I cannot say how many hours of research I have
Done studying just market crashes . The mathematics of them , the occilators which call lows
And the timing .
So as one who also reseoects your thoughts I just want to say thanks for the positive note but
To me the time parameters matter yet it’s a combination of several aspects all coming together
That I look at and at times like right now I’m not convinced either way on the overall short
Term .
Liz h
I agree with you but I can’t say much to add to your thinking until after next week .
Vivek
Thanks, it’s been a lot of work to get to this point but I’m not perfect and have my head
Handed to me at times .
Marie
Take what you learn and study it by going back in history and seeing with your own eyes
So you can actually understand fully and see what is going on and also flip the chart upside down
On the failures just to see if there is any correlations ( inversions can be your friend if you understand them )
Verne
I’m not sure just yet how to call this . Peter g made a great few posts which I agree with .
If you looked at my spreadsheets you would think at least in part of my life I had ” no life ”
I’ll just say I had months of free time and an inspiration to find out what was really going on.
You can thank Robert prechter and Steve hochberg for that .
Peter t has made it very clear his thoughts about the wave principle and I agree with him .
Read the original Elliott wave book and not prechters and you will see a few differences .
Also look at actual waves and their relationships with each other . A lot of people regurgitate
The same thing and they don’t actually dig to what is going on .
Having followed Peter t for almost 5 years now I respect his attention to detail !
Thank you Mr Temple
Joe
Verne
What do you think of this guy’s trade ?
There is also a link to a message board on reddit
In the article .
https://www.marketwatch.com/story/trader-says-he-has-no-money-at-risk-then-promptly-loses-almost-2000-2019-01-22?mod=ampfoot_mostpop
Joe,, a famous adages come to mind:
“A little knowledge js a dangerous thing”.
“A fool and his money will soon be parted”
Janhary seems to be the month for this kind of blood-letting.
It was last January that we saw the SVXY meltdown.
This trader clearly did not understand that equties markets are run by criminals who routinely pool their resources to blow up trades like this, no matter what you think the statistical downside risk.
He now knows better. Whoever is running the risk desk at Robinhood should be shown the door, imho….
Verne I too have been patiently waiting for the down in gold..
My indicators are still mixed though
My elliot wave charts still show that there are still a couple possibilities and that a break out up small is still not out of the cards..
The one I would like to believe is that we are in e up of a triangle and then should be our next down leg which I am looking at turning in February..I have 1236 as a line in the sand..
but i am still showing that a (b) up may not be finished..and could still break out of this triangle going up..in which we could hit the 1400 area..
always looking for input..so if you see something I don’t? thanx..
Joe..i am going to try that chart inversion when I have a chance never looked at things upside down.. that could give a fresh perspective..
Luri has a great MA buy/sell trigger we have been using. I asked her to chart DUST and it just triggered long, rare for triply leveraged ETFs. You could be right about an incomplete fourth wave triangle.
BTW Marie, Lara Iriarte agrees with you that Gold is finishing a minor fourth with a fifth up to come while I was expecting a 5 of C to finish a second wave.
or if anyone else out there see’s something..on gold thanx!
Dow down 301 yesterday, implied open up 186 this morning = .618 … Peter T might have something here 😉
One the subject of accurate calls, Peter G has also delivered some beauties! 🤗
thanx verne I am not familiar with her name I will look her up always good to have more references…
Lol!
These banksters are incorrigible. I said I hope they don’t gap it up at the open and what do the cretins do?
Sadly for them, the open VIX gap pointed to the move as nothing but smoke n’ mirrors…”shaking the trees”! 😁
Verne, VIX has been below 9 sma since Jan. 4. It made similar downtrend moves last year starting last May 4 and July 6. Imo, its attempt to rise above 9sma is not much different from May 29-31, July 27,30 or August 15.
Liz VIX is funny that way. I think because of the relentless way in which vol has been shorted the last few years, you can see suppression right up to the very instant it breaks violently to the upside. It looks to me like vol continues to be accumulated nonetheless. VX has clearly broken above a bullish falling wedge so a back-test of the upper boundary would not be too surprising. If you are correct in the analogy the back test will violate the upper boundary on the way new lows and I would expect to see that unfold tomorrow. If the happens I cash in my chips. A gap higher in my view would strengthen the bullish case for vol. We shall see! 🙂
Unfortunately much of the original Puetz writings are not available and what is available freely on the web is secondhand knowledge at best. Even if he did subscribe to strict time frames at some point, based on his recent stuff I don’t believe this is the case now as the Bitcoin crash, at least how I look at it, would not qualify and yet Puetz counts this as a success.
do not believe he would hold to those stric
Ignore that last line.
Dan, here are more of the specifics from an online exchange on the “Long Waves” newsgroup between Peter Eliades and Chris Carolan back in 1999. It’s one of the few places you will find the actual original crashes studies by Puetz. Note that there were indeed no specific dates i.e. Feb-Apr and Sep-Nov time spans mentioned. Those came later on from further Puetz research… In fact, the beginning dates given below belie the two time windows mentioned as there are several that began outside those two time windows.
This was copied and pasted so excuse any disorganization of text…
Re: [MTA] On Eclipses
01 September 1999 03:01 UTC
1) Tulip mania-Feb 4, 1637 2)Miss Bubble-12/28/1719 3)S. Sea
Bubble-8/30/1720 4)1929-10/11/1929 5)1977 Soybean- June 1/1977
6)Precious Metals-3/4/1980 7)1987 crash 10/2/1987 8)1990 Tokyo
2/6/1990
The days given are the supposed crash start dates as noted in the
earlier post.
Peter
Chris Carolan wrote:
Thanks Peter, One more question, which 8 crashes did he use? I found a
later list of 12 in the archives, but what were the original eight?
thanks again Chris
—– Original Message —–
From: Peter Eliades
To: LONG WAVES
Sent: Tuesday, August 31, 1999 9:07 PM
Subject: Re: [MTA] On Eclipses
Puetz’s original research goes back to May 1994 and it was
motivated by a Prechter statement in 1993 that suggested that a
potential relationship between eclipses and important market turns. In
his first research report, he noted that all 8 of the greatest market
crashes in history (I personally find that a rather brash and subjective
statement) began (by “began” he means the top prior to the complete
crash leg down e.g. October 2, 1987 and October 11, 1929) within a time
period of 6 market days before to 3 market days after a full moon that
occurred within 6 weeks of a solar eclipse. The more common occurrence
was that the full moon accompanying the crash within the stipulated
period above was also a lunar eclipse, but if not, it would be a full
moon one cycle away from a lunar eclipse full moon. The requirement
remains, however that the full moon accompanying the start of the crash
must be within 6 weeks of a solar eclipse. In that first research
report, he calculated that for all eight crashes to accidentally fall
within the required intervals would be .23 (the chance of any one crash
beginning within one of the four full moon intervals defined above)
raised to the 8th power, or one chance in 127,696. If the Hong Kong
crash conformed to the above pattern, and I believe it did, then the
odds go to 1 in 555,200 that it was a coincidence.
Puetz was careful to disavow the suggestion that these eclipse
combinations caused the crashes. If his pattern follows here and if one
is convinced that this market top will be followed by a crash, then the
August 26 full moon is the last one this year to be within 6 weeks of a
solar eclipse and one cycle of a lunar eclipse. So far, the market has
dutifully topped out almost exactly on that date. As I said, let the
games begin. There sure are a lot of cocky complacent bulls around. I
welcome and look forward to your further explanations and commentaries,
Chris.
Peter Eliades
Stockmarket Cycles
I don’t know about you guys but it is clear to me this market wants to head higher.
We have some kind of triangle unfolding and all indications are that the break will be to the upside. I have no idea where we are in the larger count but the bears are going to have to wait…
Hey Peter G, yes that secondhand discussion is really all we have to go on with, as well as the other second reference which mentions explicit specific timeframes. Even Puetz himself does not have a copy of his initial writings on the subject. The only mention of a specific time frame in the last ten years that i am aware of is his book where he writes Jan to March and I think it was July to September as containing the significant majority of crashes. The fact that he dates the early crashes/panics as commencing in early to mid Jan leads me to believe he no longer subscribes to a specific explicit timeframe (if he ever did that is).
C’mon, Verne, I know you are a bear at heart :), and so am I. Make the market prove itself. There are a myriad of reasons for the bear to take over again almost immediately. Two convincing closes above the two lines in the chart I showed a few days ago would reinforce a bullish case, but until and unless that happens, look for the bear around the next corner. Here’s the link for the updated chart after Tuesday’s close and my quick commentary:
Here is an update of the chart I published a link to on Thursday night. https://imgur.com/a/OC68Aez Notice there was a slight throwover above both lines on Friday’s close but as I mentioned on my follow-up comment, it would take 2 closes convincingly above those lines to make one favor a bullish resolution. Today went immediately back below both lines in convincing fashion.
Thanks for the encouragement Peter!
You know what I have discovered over the years?
I am just about PERFECT contrarian indicator when it comes to the market as regards starting to get bullish vibes!
They sure have down an amazing job in levitating this animal! 🙂
Peter g
Thank you for your post .
I’m presently in the ocean just north of San Francisco .
I’ll look at 1929 and 1987 again before responding .
I’ll ask though since to me this present cycle looks to be failing .
Based on what you wrote then technically the the mid Feb full moon
6 wks after the Jan solar eclipse would be the start point or high ?
And then the market would crash ?
Lastly when would the end point of the crash be in terms of time ?
From my understanding using the puetz cycle , the years 1929 and 1987
Are not the same ( that’s why I’ll look it up before responding )
Using chris carolans work though 1929 are pretty much exact .
I’m ok with learning something new and thank you for the post .
My last question is a simple one .
What happens on Monday if the market gaps down ?
Monday to me is a reversal day going into Feb 4 .
A gap up should reverse to the downside
A gap down should reverse to the upside .
I may call the typical of the puetz cycle yet I base this on my own research
And I credit Mr puetz because it is really his work that inspired me .
I’ll have no phone for a few days so I’ll respond after taking in what you wrote
And looking at 1929 and 1987 .
I can argue though just look at the 2016 elections on election night in the futures
Or the following day in the cash market .
I can point you to the March 6-9 2009 bottom . It would take me a long time
To write it all up but I can assure I have done a ton of research on this .
I can’t claim it’s my work though because at the heart of it it is all Steve puetz.
When is this year’s spring low due based on Chris carolans work ?
What day was it due in 2018 or 2017 or 2016 ? I’m not asking for an answer just saying
It’s worth a look .
Talk soon I hope
Thanks again
Joe
I make no secret of the fact that I am not an analyst. I am a trader. Those two things are NOT the same. Analysis attempts to provide information about probable market direction, while traders must actually APPLY that information to execute profitable trades. Many people confuse the two. I recently mentioned how few anlysts seem to be aware of the phenomenon of algo driven distortion of short term fib retracements. As a trader you simply cannot miss it. I have also mentioned how often we are seeing what used to be reliable bearish reversal signals completely negated, the most recent example being of course this week’s island reversal. In fact you can now almost always EXPECT this to happen. Surprising to me that there is so little mention of what is so inescapably obvious. If you dismiss the participation and active intervention in equities markets by central banks, the price action will befuddle you. When you do, it all makes perfect sense. Selling calls at the open. Will reload if we take out 2660.
This market just gets stranger and stranger!
This morning, ES is high enough that we may just keep rising to the previous high. If that’s the case, I’ve never seen an ending wave that’s corrective (which this wave up definitely is) outside of a triangle or ending diagonal, which we don’t have here.
So … let’s see what happens.
Option 1: ES is currently at about the 76% retrace level of the wave down from 2677. If we turn down after the open, then we should get a wave down likely just below 2600. That’s because a wave down from here would be a C wave and in fact, it would be the same length as the A wave down. The 76% retrace level for ES is 2662. Rising above that level would tend to suggest we’re going to a new high.
Option 2: If we keep rising, then we’re going to likely turn down at 2677 or a little above and it will be one more all the wave down to the 2330 bottom or a little lower.
I’m more inclined to think, looking at the waves up, that we’re still going to get a wave down from here, then turn around and do another high after completing a C wave. But I’ve got to keep an open mind.
Currency pairs more support the first open rather than the second.
I’m not getting much information from oil, which could go either way at the moment.
The current “intervention” is of course the FED annoncement that it will end QT.
I was certain this ammunition would be held in reserve for the final wave up. We all knew, however, that this was inevitable.
We have yet another remarkable example of a violent negation of what looked like a perfectly legitimate nested 1,2 count with a third down at multiple degrees on deck. I have seen this movie so often the last few years I can practically predict it.
Frankly, the early deployment of the QT possible ending is in my opinion OMINOUS….!!!!
Lol! Let me get ahead of likely questions about WHY ominous…does anyone believe this market would hold up without CB support, or doubt the possibility that they ALREADY ended QT? If so, the ONLY reason to actually TALK about it is that what they were ALREADY doing was failing to produce the desired results…simple…! 😊
The triangle commonly used to be a penultimate wave. Go take a look at the last several ones that formed in this market.
It will be interesting to see if the current thrust is any different..l
A close above 2660 seems to me short term bullish.
The mid to longer term picture remains murky.
Predictions about what Mr. Market is or is not going to do is way above my pay-grade.
He seems to take great delight in proving everybody wrong…! 🤔
We are going to close above an important pivot so we have at least one more wave up imho. It looks like yet another triangle of some sort so while it could possibly some sort of fourth wave, it looks to me like over-all the banksters have executed another wave coup…
Have a great week-end all!
Yep, Institutional data firm sees inflation and earnings slowing Q4 and Q1 with GDP announced on 30th with a 1-handle (also Fed day). So drifting higher into that date is definite possibility, then…
Great weekend!
All I know is the closing price today was right on my 2 lines again. Absolutely no damage was done to the bearish case. Still very bearish until or unless there are 2 good closes above the lines. The market saw and respected the lines today…
https://imgur.com/a/EU5ANpz
Agreed. Multi- year trendlines remain busted and we are ultimately heading South. With CB buying however, we could hug the underside for far longer than people expect. Unless the initial wave breaks the rising wedge lower boundary, the grind likely continues…
Verne,
I am in 100% agreement with you that the recent bearish technicals is saved just when it is about to break.
I know what you mean.
Good that you bring it up openly.
Hi Ho Vince.
I can tell that you are a trader.
The thing that greatly surprises me is that more traders don’t point it out. This has been going on for a long time and is affecting every trader, whatever set-up metrics they use. I am also of the opinion that wave development is also being affected, and this makes it tough for analysts to figure out what is going on.
About 18 months ago I started to notice extremely anomalous trading patterns in SVXY. One startling example was a move riight up the upper B band where if you expected any kind of reversal, it did not happen. Price remained pinned there for weeks! What happened next was even more incredible. Price jumped ABOVE the upper B band and REMAINED there for several sessions. I had never seen anything like it. We know how that ended. While I shorted it, I left 90% of my profits on the table as I lacked the courage of my convictions.
The way this market is now trading is starting to remind me of that event…
S
Peter g
I’m not going to debate the puetz window anymore .
I’ll try to avoid commenting on it in the future .
my reasoning is it’s simpler to agree to disagree is all .
That said I’ll let you try to make sense of 1929 and the puetz dates
mentioned in your post above .
Additionally I was going to post a chart of the year 1999 since it was mentioned
Yet I’ve decided to just leave it alone .
You can check my data ( please do )
1929
Piers mentioned by your post
Oct 11 ? Oct 10 1929 was a first quarter moon
Nov 9 which is not mentioned was a 1 st qtr moon
Nov 1 1929 was a solar eclipse
Nov 17 was a lunar eclipse
From my point of view 1929 the cycle failed badly so there must
Have been something else going on .
Or my data on eclipses is wrong ( I’d double check my data )
Daily Dow chart has 5 waves up and the grind goes on .
24971 is still a tough level to get through and the .618 retrace might
Be it for now .
Feb 13-19th is still a strong cluster in my timing .
I’m not sure it’s a high or low .
Temp gov ‘re open until Feb 15 and we get a bit of drama in the mix .
A 3 wave decline in wave 2 ?
A mid Feb high in my view then calls for a sideways mkt
Feb 13-19 and March 5 are turn dates yet I can’t call it a directional move
From date to date .
Monday is a new day , I’m not sure how to call it .
Feb 4 and Feb 13-19 th time range should both be highs or lows .
If I had my way Feb 4 and Feb 13-19 th and March 5 would all be highs of sorts
Yet all those highs at about the same price level .
A gap up Monday implies a drop into Feb 4 which then calls for a Feb 13-19 low
Yet March 5 most likely a high with a March 15 ish low .
Many things pivot around the Feb 4 and Feb 13-19 th time range
With what looks to me like 5 waves up on the cash Dow daily chart I’m not
Short term bullish . A deep retrace is due .
Call it wave A completing now or call it wave 1 of 5 .
Intraday chart I won’t touch .
Mars Uranus called it and I won’t fight it .
Enjoy your weekend
Joe
A new weekend post is live at: https://worldcyclesinstitute.com/next-up-down/
don’t know if this means anything but the NYA and Indices have topped pretty much 44 to 46 days after each top of the Baltic dry index since December 13, 2017
If that holds that would again put us at its high by the end of the week for the indices, which seems to be align with many of the things timing wise ..I am curious to see the follow thru on that one this week..
This website is for educational purposes relating to Elliott Wave, natural cycles, and the Quantum Revolution (Great Awakening). I welcome questions or comments about any of these subjects. Due to a heavy schedule, I may not have the time to answer questions that relate to my area of expertise.
I reserve the right to remove any comment that is deemed negative, is unhelpful, or off-topic. Such comments may be removed.
Want to comment? You need to be logged in to comment. You can register here.