
 The Bulls’ Last Stand
My predicted drop to a new low hasn’t panned out quite yet … but it will! This week’s slow-moving rally continues to illustrate the Hopium Effect in action, but is showing that it’s waning.
It reminds me of Custer’s Last Stand. The Battle of the Little Bighorn in 1876 was a revolution of sorts. The Lakota and other Plains Indians (or native Americans, as we more properly refer to them now) rose up against US forces and defeated them. That ferocious battle has been ennobled as “Custer’s Last Stand” – but in truth, Custer and his men never stood a fighting chance. So it is with the current rally.
What’s interesting is that this happened during a major depression, called the Long Depression, which had begun a few years earlier. 1876 is considered the bottom of that depression. The depression of 1873 followed a period of over-expansion and high inflation, which is typical and we see the same things happening today. The depression brought a decade or so of deflation.
The Long Depression was a worldwide price and economic recession, beginning in 1873 and running either through the spring of 1879, or 1896, depending on the metrics used. … The episode was labeled the “Great Depression” at the time, and it held that designation until the Great Depression of the 1930s.
The point is that revolutions and civil wars always accompany cold and dry periods (which was reflective of the climate of that era). We’re seeing the same types of unrest (in their early stages) play out on the world stage. Don’t look for a major international war (they should start to dissipate) but look for civil wars and revolutions to ensue in countries around the world over the decades to come.
The American Civil War began in 1861, which was also a very cold, dry period. It lasted until 1865, when we saw a revival in rainfall internationally for the latter half of that decade. Rainfall revives the economy. It’s turning cold and dry now, but on a much larger scale, worldwide. On a smaller scale (and closer to home), we’ve seen virtually no snow at all this winter in Western Canada. Farmers will soon be raising the alarm.
I wouldn’t expect the civil war that’s erupting in France to decline. In fact, I’d expect it to smoulder during the coming fifth wave up to a new high, only to erupt on a larger scale when we turn back down again later this year. Then is will spread to countries around the world.
In any event, the current bullish streak we’ve seen in the past week is the “market’s last stand.” The larger direction is down and I’m expecting that to become obvious once again as early as Monday (although it may have a little more Hopium still left in its system).
On another note, Zerohedge has an article on the similarities between the top of the cycle degree third wave (in John F. Kennedy’s era) and the current topping pattern. They should look much the same: They’re both major tops of major waves. Near the end of the 60’s we topped the third wave and went into a multi-year, fourth wave recession (the 1970s).
Now we have the final wave top in progress. In both cases the patterns are the same — a deep fourth wave and a final fifth wave to a terminal high.
On several different scales, history rhymes.
_____________________________
The International Last Stand
Here are indices around the world that are all in the same position — much of the world is ready for a turn to the downside. All the patterns are the same — an ABC corrective rally that will fully retrace by Elliott Wave rules (in other words, it’s in three waves).
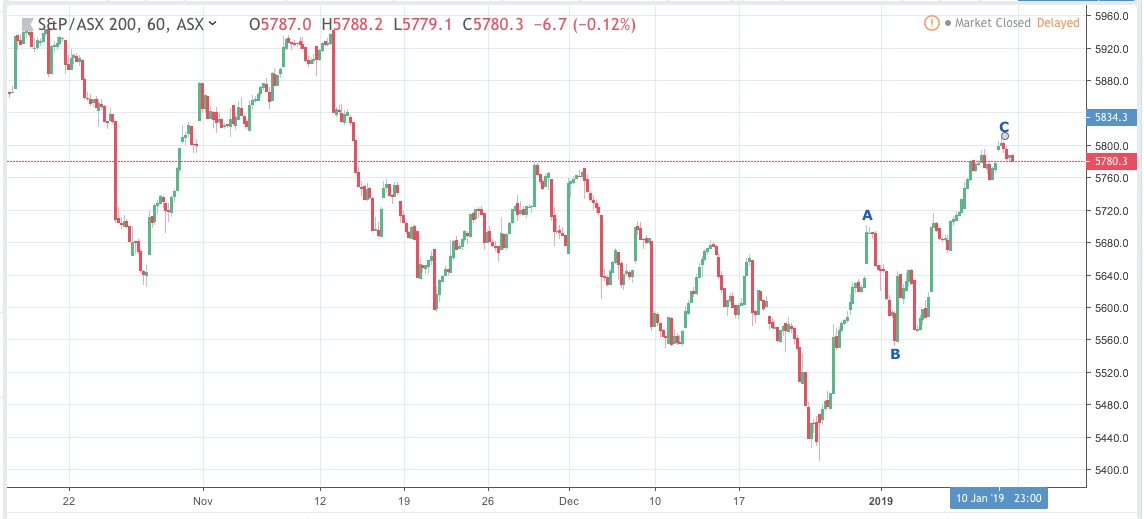 Above is the 60 minute chart of the ASX 200 (Australia’s stock exchange).
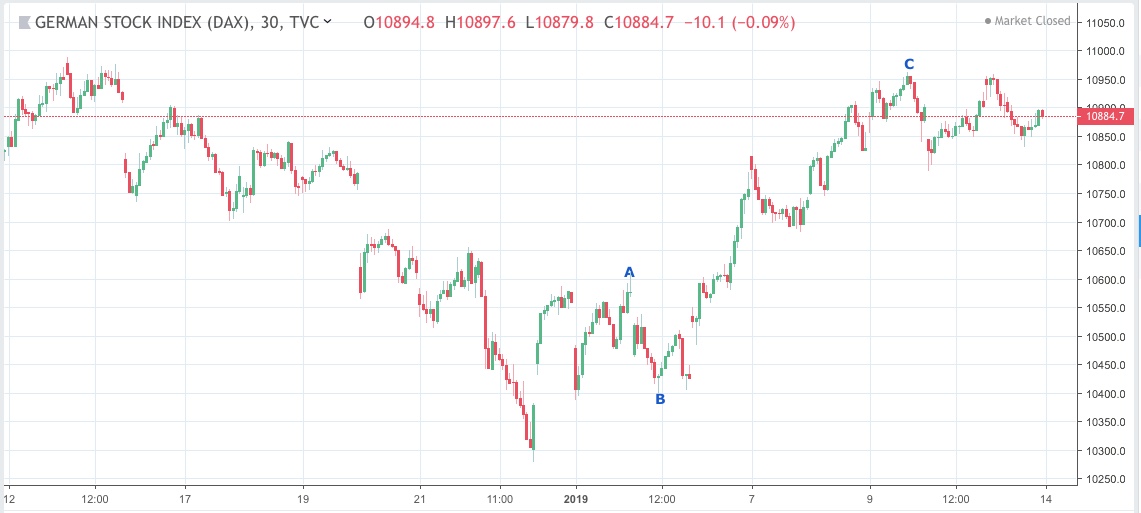 Above is the 30 minute chart of the DAX (Germany’s stock exchange).
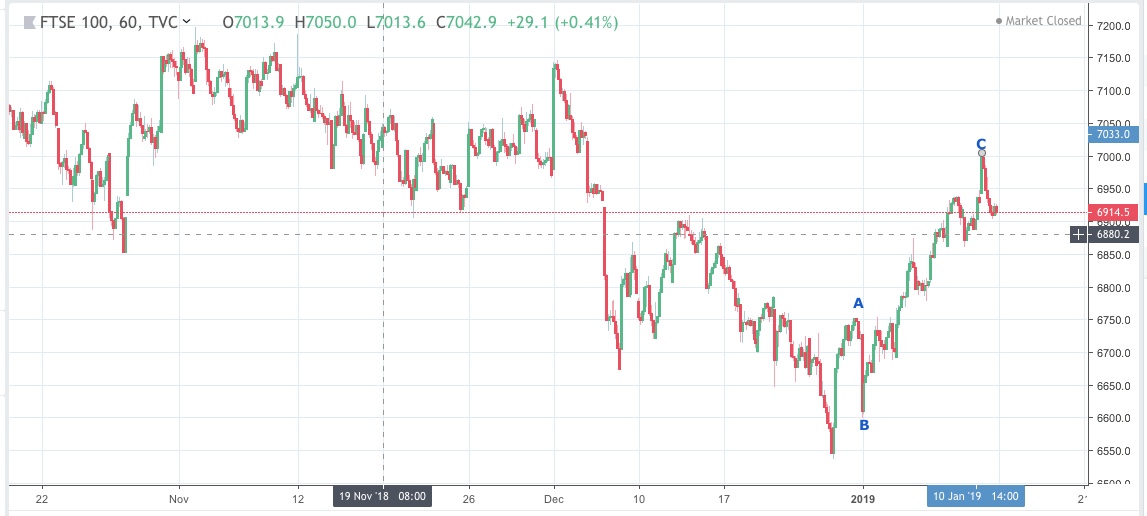 Above is the 60 minute chart of the FTSE 100 (The top 100 companies in the London stock exchange).
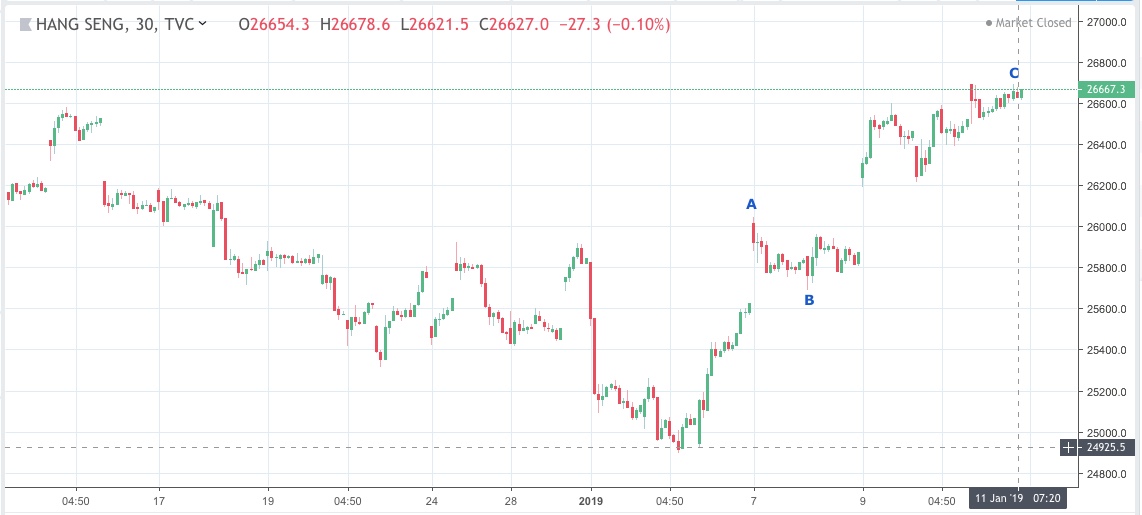 Above is the 30 minute chart of the Hang Seng (Hong Kong’s stock exchange).
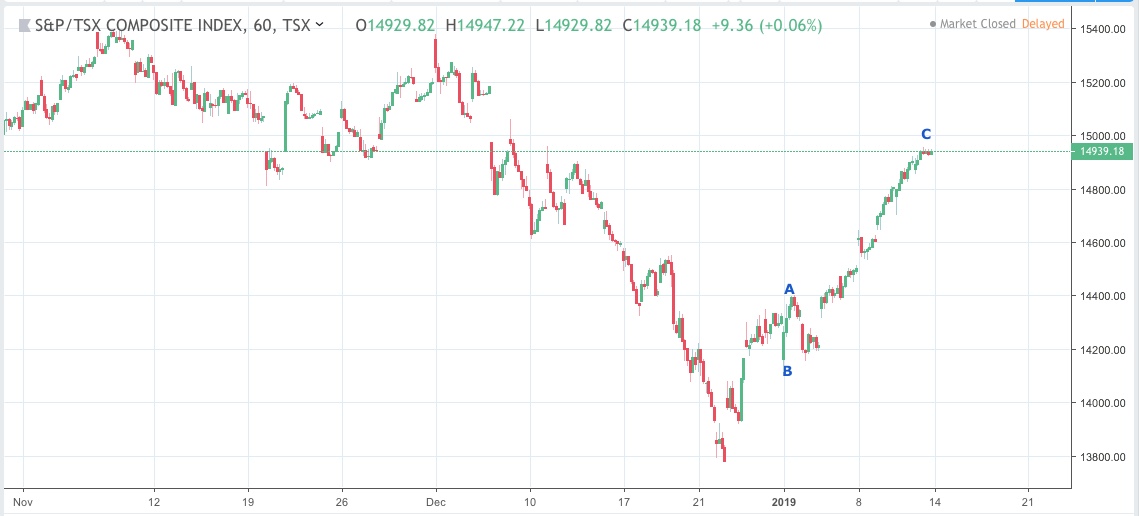 Above is the 60 minute chart of the TSX (Toronto’s stock exchange).
We wait, but it won’t by much longer.
___________________________________
Elliott Wave Basics
There are two types of Elliott wave patterns:
- Motive (or impulsive waves) which are “trend” waves.
- Corrective waves, which are “counter trend” waves.
Motive (impulsive) waves contain five distinct waves that move the market forward in a trend. Countertrend waves are in 3 waves and simply correct the trend.
All these patterns move at what we call multiple degrees of trend (in other words, the market is fractal, meaning there are smaller series of waves that move in the same patterns within the larger patterns). The keys to analyzing Elliott waves is being able to recognize the patterns and the “degree” of trend (or countertrend) that you’re working within.
Impulsive (motive) waves move in very distinct and reliable patterns of five waves. Subwaves of motive waves measure out to specific lengths (fibonacci ratios) very accurately. Motive waves are the easiest waves to trade. You find them in a trending market.
Waves 1, 3, and 5 of a motive wave pattern each contain 5 impulsive subwaves. Waves 2 and 4 are countertrend waves and move in 3 waves.
Countertrend waves move in 3 waves and always retrace to their start eventually. Countertrend (corrective waves) are typically in patterns — for example, a triangle, flat, or zigzag. Waves within those patterns can be difficult to predict, but the patterns themselves are very predictable.
Trend waves move in 5 waves and partially retrace. The difference in these waves is not covered in “The Elliott Wave Principle” book. There are two types:
- Simple 5 wavers are found in zigzags, flats, and other nondescript corrective patterns. They have 5 waves, and sometimes the third wave has a recognizable 5 wave pattern, but most of the time, they don’t.
- Impulsive waves require each of waves 1, 3, and 5 to have recognizable 5 wave patterns in their subwaves
Fibonacci ratios run all through the market. They determine the lengths of waves and provide entry and exit points. These measurements are really accurate in trending markets, but more difficult to identify in corrective markets (we’ve been in a corrective market in all the asset classes I cover since 2009).
To use Elliott wave analysis accurately, you must be able to recognize the difference between a trend wave (motive) and a countertrend wave (corrective). There’s very much more to proper Elliott wave analysis, but this gives you the basics.
____________________________
Registration for Commenting
Want to comment? You need to be logged in to comment. You can register here.
If you register, it protects your information. It also allows you to comment without filling in your information each time. Once you’re registered, simply go to the home page and click on the login link top right in order to log yourself in. Usually, you’ll be logged in for several days before needing to be logged in again.
______________________________
Problem receiving blog comment emails? Try whitelisting the address. More info.
______________________________
Get an upper hand … JC 2
Get an upper hand in trading …Seeing all the different currency pairs and the wave structures and hearing you explain why this has to do that on a nightly bases gives one a upper hand when trading. Elliott Wave applies to all stock and indices and can be applied to any candlestick chart. If someone ask what you want for Christmas – Tell them a membership to Peter’s “Traders Gold!”—JC |
the real deal SM 2
The real deal …‘Educational, insightful and thorough market analysis for all levels of traders. It’s Elliott Wave at its best….Peter Temple is the real deal’ —SM |
Couldn’t be happier … KK 2
Couldn’t be happier …The analysis and insight you provide is simply amazing! I’ve been trading the futures and equity markets for well over thirty years and usually average around 5% monthly. Since joining your Traders Gold Service two months ago, that number has better than doubled. I couldn’t be happier.—KK |
Tops in your field DZ 2
Tops in your field …You are tops in your field. Tried to follow Elliot Wave international for years. They were always behind the market. After discovering you, I perceive that you are an expert in reading the waves, which puts you way ahead of the rest of your peers. And you can read the Waves like you are reading tomorrow’s financial section. I pray you stay healthy. —DZ |
Rise above the rest … SM 2
Rise above the rest …I have only ever met a few people who, in their chosen fields (astrology, medicine, music, martial arts, technical analysis), rise above all the rest and you are one of them…you have ‘the gift’…and that’s why I’m a Trader’s Gold member. —SM |
A true expert in Elliott Wave FL 2
A true expert in Elliott Wave …You are a true expert in EW analysis. What you provide is not available anywhere and is priceless. Subscription on your services is the best thing I have ever done. Many thanks for your effort to make me a better investor. I now have more trust in my investment decisions. I hope you will continue the excellent work! —FL |
Have not had a losing week RW 2
Have not had a losing week …I have been with Peter almost a year. The only thing that matters is have I made money with his service. I think I have finally turned the corner using Peter’s EW. I have not had a losing week in the last 5 months. Thanks Peter, for your amazing amount of hard work. —RW |
The best of them JL 2
The best of them …Last couple of years, I subscribed to several ‘market traders’. You are by far the best of them and the personal contact is awesome. Daily and daily updates are very well written! Besides your expertise in EW, I also like your cycles analysis. Best investment I ever made! —JL |
US Market Snapshot (based on end-of-week wave structure)
Here's the latest daily chart of ES (emini futures)
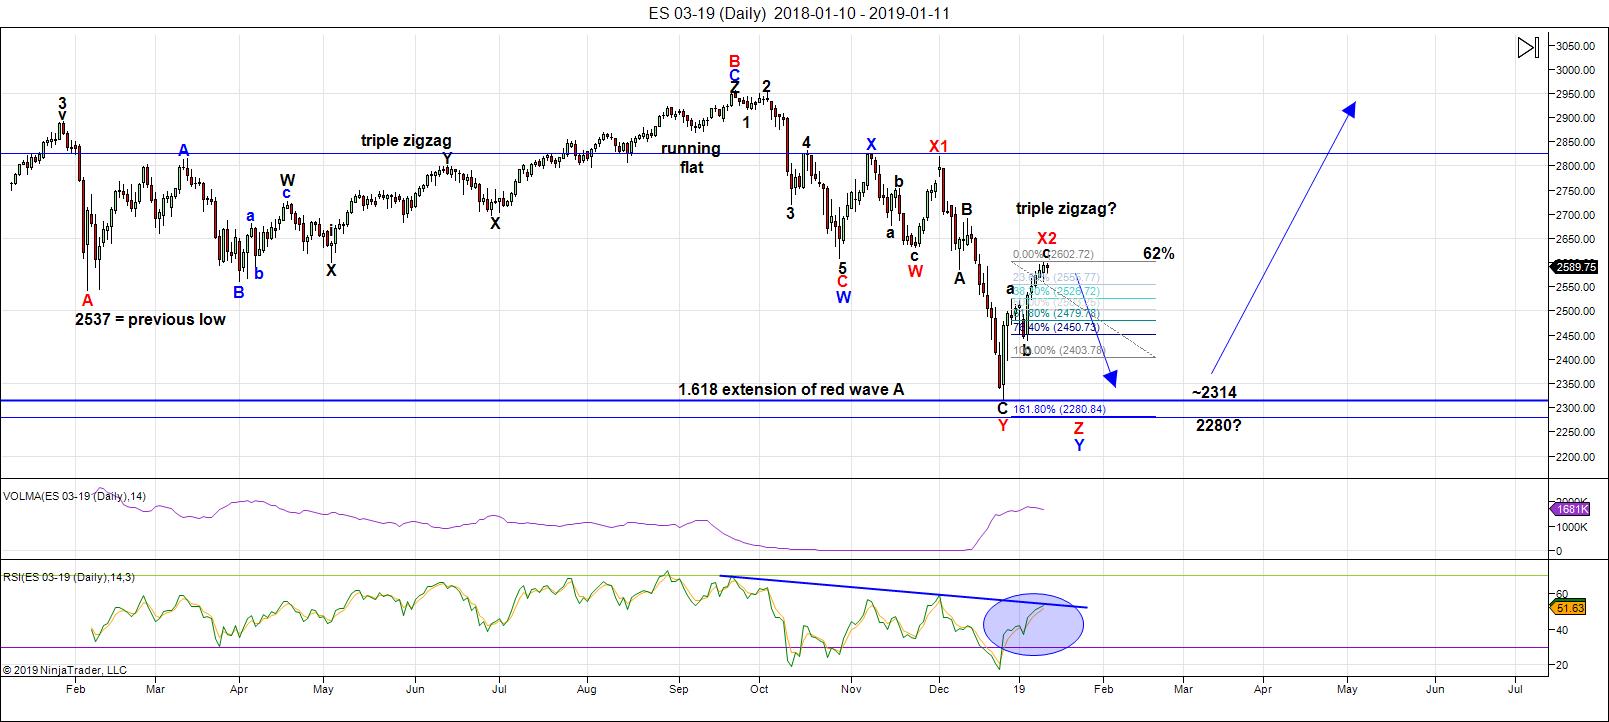
Above is the daily chart of ES (click to enlarge, as with any of my charts).
Last week, the current rally achieved a level that told me the current pattern (the way I'd labelled it) is incorrect. Elliott Wave is very good at telling you when you're wrong. In this case, the change is relatively subtle and doesn't affect the eventual outcome; rather it confirms it.
The short story is that I've come to the conclusion that we've only had two patterns down from January 29, 2018: a running flat and a triple zigzag (not yet complete).
Instead of having completed a regular flat in between these two patterns, I now believe we began and rare triple zigzag where I had previously labelled a flat (the patterns are exactly the same). So, if I delete the regular flat in the current chart (above) and make the entire pattern down from about 2810 a triple zigzag, it all works from an Elliott wave perspective.
The top of the wave we're in has risen to the 62% retrace level of the previous zigzag from red X1 down. This wave down is also 2.618 X the length of the first zigzag (down from blue X at 2810, or so). Blue X marks the start of the triple zigzag pattern to the downside.
Now, if the third zigzag down starting from where we are today ends up being 1.618 X the first zigzag (which would be a typical length of the fifth wave — in this case, you could count the three zigzags as part of a 5 wave combination), this targets a bottom in ES of 2280.
However, it makes more sense to me that we would target the previous low only, which was an earlier target based upon a very reliable measurement. In that case, we may still have a continued rise of about 25 points. This is speculative on my part, as we have a series of two ending diagonals in a row that have formed at the top. In other words, we're ready to come down now.
So ... we watch and wait. Part of the issue is that many indices are in the same position internationally; it's not just the US indices we're waiting for. When the market is good and ready, we're going to turn down ... and I expect it to be very soon.
Summary: Look for a dramatic drop in a zigzag (5-3-5) pattern to complete a triple zigzag with a wave at least to the previous low that could start as early as Monday. We could also rise as much as another 20-25 points before we see that turn. The culmination of this drop should mark the bottom of large fourth wave in progress since January 29, 2018 - almost a full year of Hell.
___________________________
Trader's Gold Subscribers get a comprehensive view of the market, including hourly (and even smaller timeframes, when appropriate) on a daily basis. They also receive updates through the comments area. I provide only the daily timeframe for the free blog, as a "snapshot" of where the market currently trades and the next move on a weekly basis.
______________________________________
Sign up for: The Chart Show
Next Date: Wednesday, January 16 at 5:00 pm EST (US market time)

The Chart Show is a one hour webinar in which Peter Temple provides the Elliott Wave analysis in real time for the US market, gold, silver, oil, major USD currency pairs, and more. You won't find a more accurate or comprehensive market prediction anywhere for this price.
Get caught up on the market from an Elliott Wave perspective. You’ll also get Andy Pancholi cycle turn dates for the SP500 for the balance of the current month. There’ll be a Q&A session during and at the end of the webinar and the possibility (depending on time) of taking requests.
For more information and to sign up, click here.
| "I think you are the only Elliot Wave technician on the planet who knows what he's doing.” |
| m.d. (professional trader) |
All registrants will receive the video playback of the webinar, so even if you miss it, you’ll be sent the full video replay within about an hour of its conclusion.


Thanks Peter!
Where is everybody? 🙂
The expectation for a negative market start for the month of January has certainly been up-ended by Mr. Market.
He does seem to be in the habit of up-ending expectations these days. What is interesting is that the January effect is now forecasting a positive 2019 for the market. While there have been exceptions, the odds of a positive year are statistically over-whelming. Considering all the warning macro-economic flags that are flying, this raises an interesting conflict of economic reality versus statistical probability. In my view, what we are dealing with here is the ruthlessness of central bankers. No one can say with any certainty, in my humble opinion, how long they can continue to keep prices aloft. That they can and do affect price is to my mind not even a debatable question. Any market observer cannot help but notice by simply following money flows how massive market purchases are being made at critical moments of market price action. This brings us to the question of the current clear bearish rising wedge in the market. The reasonable expectation is for the break from the wedge to be to the downside. It is interesting that quite a few folk are pointing to this pattern and opining what the price action following its conclusion SHOULD be. I for one, am not so sure!
Never underestimate the banksters!
Hi Peter.
I am thinking the next low will be closer to 2242.
Someone here had mentioned the bollinger band 1.4 on VIX as using a sell signal on overall markets. I think we are getting that today. A close below 2560 today would be very encouraging for the bearish case. Bulls have been ramping up the market between 10:00 and 12:00 last few days. Lets see if today is any different !
Yep. The predictable pattern continues. Downside gaps feverishly bought. It is quite remarkable looking at those ridiculously long candle tails. I suspect we have a fourth wave of the ED underway this morning. The final downside break from the wedge will probably not be amenable to long candle tails. Time for patience imho….
This is one of the weaker bounces – I have started initiating some shorts. Would like to sell more around 2615 – 2625 area.
I also got filled on some stink bids on VXX 35 strike calls expiring Jan 25 2019.
Order filled at 4.50 per contract.
That instrument will cease trading on Jan 26 when they will retire and replace it. If things go as we expect, it should go out with a bang! :-))
Stink bid might be golden. An institutional manager is observing that his short positions were stinky toward the first of Oct, NOV and Dec, then were golden (to use your words 🙂 Not happening quite so quickly this month but is convicted to more shorts than longs right now.. He think institutional money buying beginning of month (and year?) then they fade it. We’ll see.
How far out and how are u strucuturing u r shorts. I am doing spy feb 22 250/235 spreads.
So far so good. Bid on contracts closed at 4.48 so slightly in the red.
I don’t expect that to be the case for too long based on the closing candles.
Would have much preferred to see a gap higher but that is why I began with a very light position. I would be deighted to lower my cost basis with one more beat down.
We shall see…!
I would expect some news to trigger the drop, like brexit, gov shutdown, trade war, all of the above?
I have a cluster of swing dates for 16 and 17 January.
Where is Luri – love an updated BTC chart
https://www.zerohedge.com/news/2019-01-14/russia-prepares-buy-10-billion-bitcoin-evade-us-sanctions
The banksters are buying…news or no news.
There will ultimately be an exogenous shock whose impact will be too disastrous to buy. I suspect it will be bigger than trade talk propaganda or government shutdown talking points. For now, they are definitely keeping prices aloft.
Peter t
I’m a believer in global cooling but I must say
That this past December was one of the warmest I’ve
Seen in southern Oregon on the coast . I’m now 200 miles
North and a bit chilly .
I’m not sure to call the past Dec warm and wet or just a bit of
Warm .
I remember you writing a few years back about Dr wheeler and
I’m thinking you wrote that as the sunspots begin to rise it gets
Colder . That caught me off guard back when I read that .
Nothing to add in regards to stocks or index’s .
I just thought I’d mention the odd December temp wise .
For the southern Oregon coast where I am . Dec Jan and Feb
Are the usual months of some cold yet I must say I enjoyed
The oddity this year .
Thanks for your post : )
It’s an el nino year. Warm here, too. But supposed to be done by February.
Russia started selling us treasuries a few years ago
Because of the Obama administration.
If they want to buy bitcoin they should understand bitcoin
Is priced in us dollars !
Gold is also priced in us dollars .
How does any of this change the sanctions ?
Verne
It’s not the banksters or the computerized trading that is driving stocks higher .
It’s not manipulation .
The wave count is driven through mass human mood swings .
The bankers couldn’t stop the 20% drop we just witnessed, they have not
Stopped the wave formations.
https://mobile.reuters.com/article/amp/idUSKCN1P82I8
Exactly re: your comments on bankers. This is a worldwide phenomenon. The international indices are moving in unison.
El Nino ? I’ll have to look into that
I wonder if la Nina is next ?
Thanks for the reply
I agree about that the long term trend of the market will not be altered by CB cash infusions
Having said that, you simply cannot credibly argue that these massive intraday swings we are seeing in the markets are due to retail investors, namely herd sentiment. I know we have been back and forth regarding this topic and so we will simply have to agree to disagree on this particular point.
Speaking of algorythmic trading Greg Mannarino recently published code showing market buy and sell triggers.
I have to say I am always stunned to find traders who deny their market foot-print. I honestly just dont get it.
People still try to argue with me about why their1.618 fib stops are so often run with such precision. Every trader worth his salt knows EXACTLY where the machines retrace to. As I said, the denial of someting so obvious truly baffles me, but it is what it is…!
Rats!!
For awhile there it was looking like the futures thrust from the triangle was going to let me add some more cheap VXX calls…these banksters may be crazy, but they are not STUPID! 😁😁😁
Verne, you have a good reason for VXX options instead of VIX options?
Spreads are quite similar, sometimes slightly better with VXX.
The last day it trades is Jan 26 2019…
I got filled on a set of orders on this spike up. Ended up selling around 2600 – 2605 area. Its about 10-15 shy of an ideal target, but I wanted to get locked and loaded on this side. From what we have seen, this market can hang around this zone (2575 – 2625) for a few more days.
Vivek – Are you put spreads…whats your expiry on those one’s
verne
im only saying the market as a whole moves cyclically
and it is money from all over the world that moves it .
to pin it down to just the bankers is a mistake.
there is a combination of bankers, brokers, fund managers,
pensions, electronic traders. all use various to similar methods.
ive heard over the decades its the PPT etc… but at the end of the day
the wave counts keep fitting and working. the longer term oscillators going
back some 80 years still show the same extremes .
if people would adjust their “1.618 ” STOPS then that issue would go away .
the point im trying to make is : we must adjust to what the market does
not what we think it should do.
most of the time our methods that we use will work BUT not always.
Peter T had a downside target that pretty much nailed the swing low
and the market bounced from that level .
did the banksters read his post ?
if the full moon on jan 20 becomes A high ? do we assume the PUETZ cycle is still working ? do we say the bankers lost control if the market tanks or do we blame them for the mini crash or outright crash ?
why is it that the bankers are the ones who get bailed out every time we get a big crash ?
anyone can leverage themselves but when they are wrong and get wiped out
they dont get bailed out .
why crypto ? would having a digital system with no cash change anything ?
would having a digital system with no cash force you to keep your money in the bank and prevent a run on the bank since you could not take your cash out and put it under your mattress ?
would that be a manipulation ? ( forcing the masses to keep the banks in control )
or would you move your digital money somewhere you considered safer ?
either way we would lose control of our own money .
ill sum it up : i agree with you to a point that the markets and financial systems are rigged to rob the masses our their money .
we must understand this in order to survive .
anyways you understand whats going on so i wont get carried away .
the big picture always wins and nobody- the fed or banksters etc can stop
whats coming .
they wont stop global cooling by taxing us either
Until we get w break of the lower wedge boundary, we have to assume the move up will continue.
I see bearish reversal signals being negated by cash dumps. Even a blind trader can see this is not retail investors buying this market. The declining volume on the move up continues to point to a terminal move. It is particularly evident on the most recent upward break.
I am getting that same feeling I got after I sold SPX @ 2840 in July 2018. I just hope its not a 2 month wait as it was in Aug-Sep last year ! I have one last piece to sell for which I have a 2625 target. I will wait for a break of lower wedge to buy options. As on now, I will stick to outright shorts. Way too many people talking about 2630 as the 50% retrace to use as a stop. Something tells me that if we get there, we will likely push through just to stop out as many shorts as possible
2613.13-2617.65 CASH SPX we came close today to the lower range
verne
all those 2630 stops ? great for those who wish to run them id think
for me though its the 2613.13-2617.65 range as a high and that full moon lunar
eclipse is going to matter.
sitting tight yet …. still no weekly chart B wave or ? the door is opening for a bearish trade NO doubt
I have a healthy respect for the ability of buyers (whoever they are, to drive this market higher). We have all learned how fool-hardy it is to try and predict exactly when these upward ramps are going to turn, much less trying to trade against the immediate uptrend. I was on another site yesterday and saw a so-called EW guru post a downward count of 1,2 and opined that was the strangest thing I had ever seen considering we were in a clear sideways consolidation entered in a short- term uptrend. That pattern generally presages an upward break as every competent trader knows. The guy got really upset with me and sarcastically asked me if I had a license as a registered financial adviser, and accused me of offering trading advice!
I have never seen a guy who presents himself as an EW expert offering wave counts, then takes umbrage when visitors to his site talk about actual trades they are making based on their own understanding of the pattern. Of course we all saw the upward break from the pattern which was no surprise.
The U.S. code that applies to fiduciary obligation is triggered only when compensation is offered for said advice. There is absolutely no legal prohibition of individuals sharing their own trade ideas on a public forum, not is the host of the site in any way legally liable for what other readers do with that information.
Needless to say, I apologised for opening my big mouth and have made my last comment over there. It was a remarkable experience. I sure hope no one traded his 1,2 downward count! 🙂
Joe:
I monitored the full moon price action for a few months awhile back and I found the correlation to not be very consistent. Sometimes we had market lows and sometimes we did not. I think it is definitely worth keeping an eye on but in my view that cycle can be negated by CB buying. I have seen it done.
“If you are not a registered investment adviser (and even if you were) it is not legal for you to provide others with buy, sell, hold recommendations. I’m going to be patient with you, and ask you to consider this: you have no ideas what others are doing. For example. Someone might have looked at the ‘c’ wave up today, shorted it there, and rode it down into the close. Then, that makes your advice just plain ‘wrong’ for that person.
The fact is you only see ‘your’ time frame, and ‘your’ way of trading. And I’m not criticizing you for that.
But, while on this site, you simply may not provide buy, sell or hold recommendations at any time on any security. Period. Again, it is not lawful, and you are not providing the person with the required disclaimers, etc. This is an educational wave-counting site ‘only’. No buy, sell or hold recommendations are provided.
If you can not abide by these guidelines, then I will have to spam your comments, close your access here, or I will have to take the whole blog into ‘moderated’ mode where no-one’s comments get published until I review them.
Have I made myself clear?”
___________________________________________________________________________________
https://tinyurl.com/yb699qq4
Verne Carty November 4, 2018 at 10:26 AM
Thank you.
I have learned more about EW in six months of reading your posts,than six years of subscribing to the guys who ‘wrote the book”
Imho, none better…
I am hearing sounds of capitulation everywhere as lots of traders are not talking about an impulse up lol!
It would seem that Mr. Market has done a remarkable job of shifting sentiment has he not? 🙂
Verne
I’ll agree and say you are generally correct about the new and full moons .
That said the full moon lunar eclipse is going to be an important one to watch .
The reasoning behind it is the previous new moon solar eclipse was A Low .
It wasn’t the low like the full moon going into Dec 26 but if the Jan 20th lunar eclipse
Ends up as a high it will forecast a Feb 13-19th low .
Not everything works but that is the theory I’m working with .
The Bradley model has a cycle low ( turn date I believe Jan 22 )
I’m not saying not will crash or rally . Just saying I would not prefer to see a
Jan 20-23 high at all .
On some individual stocks I am seeing a 5 wave impulse taking shape yet the 5 th wave up
While technically in place looks like it needs a little more up to have the right look .
The nasdaq composite daily chart is another example .
I’m seeing way more 3 wave moves to the upside then I am seeing 5’s
I had preferred the market peaked last week and by Friday at the latest .
My thoughts and preferences were dead wrong ( and I added to long positions on Dec 26 open )
I have mentioned several times that the puetz cycle has not been perfect yet it still to this day
Has not failed ( the way I see it anyways )
The spx 2613-2617 range has not been exceded .
I don’t mind being wrong and the market going higher but …..
I think people should at the very least have some solid exit stradegies thought out
If this market begins to stall and then turn lower .
Jan 20 full moon lunar eclipse then Feb 4 new moon should be a directional
Move from date to date . High to low is what it looks to be setting up as .
A 5 wave impulse needs a retrace . An A wave on a weekly charts needs a retrace
In wave B .
If we are truly in a bear market ??? All hell is about to break loose .
I’m not sold on the bearish case nor the bullish case at this time.
My case has been that from Jan 4 to March 8 this bearishness should end .
How ever I can add that on March 5 mercury goes retrograde which will only add
To the complicated confusions going on in traders minds .
Puetz cycle runs Jan 20-Feb 13-19th
Feb 13 mars Uranus conjunct
Bradley model turn Jan 22-23 ?
Mercury retrograde March 5-March 26 plus 10 days
March 15-April 5
No way am I going to attempt to call this market at this time.
Even a fake out drop into Jan 20-22-23 and a rally into Feb 13-19
Still leaves March open for debate .
Mars Uranus crash phase is behind us so this rally is good to see .
But I’m not tuned in to all the others .
One thought I’m questioning on the NYA is that we are in wave B up
Of a much longer triangle . Wave A down was all of 2018 .
Wave B up would take months and wave C ? ???? No way I’ll be confidant
To call wave C this far in advance but …… It might not end up as a triangle
It might just be a simple B wave .
The market looks terrible at this point
Joe, you could be right about this coming full moon. The problem I have with the lunar cycles is that they are clearly not consistent, therefore it is impossible to trade them with any confidence. It is my belief that there may also be some who trade against the prevailing wisdom of these cycles. We know for example, a lot of the HFT algos are programmed to now retrace 1.72 to deliberately run 1.618 stops placed in the market. It still surprises me how few are aware of this fact. I think this kind of trading and low volume is also resulting in wave distortion in the form of more combinations. As someone said, the great limitation of EW is that although it does a fair job of telling WHERE, you are going, it is awful at saying WHEN…
BTW. I do agree that it does appear we are in the C wave of a big abc up with four and five of C incomplete, That is the only thing that makes sense to me if the wave up is counter trend and I am puzzled by all the immediate bearish counts I have been seeing…
If the pattern of the final C wave is an ED, we need to tag 2598.75 in a fourth wave before we head up in the final ZZ for a fifth wave. It seems to me trying to enter bearish trades absent a clear break of the wedge would be pre-mature, and that is why I have been mainly keeping powder dry, except for a few early long vol trades.
Some report on oil came out just now, judging by the spikes.
2617.65 on spx was where wave C and a were equal.
Now that 2617 has been broken I’m seeing 2724.99 to
2826.08.
The 2724.99 is where wave C = 1.618 which then argues a wave 3
On the daily chart. I’m enjoying the run higher yet it bothers me .
I’ve seen these moves happen far to often after big declines .
Everyone gets bearish and then Mr market grinds ever higher .
there is a gap near 2650.54 that might get filled and I’d watch
The 200 dma which might be the resistance everyone targets .
I’m starting to think I got lucky and bought the bottom .
Jan 4 was the end of the typical mars Uranus cycle .
The market may drop back hard yet it did get very oversold
So not much I can add anymore until I grasp what’s going on .
The Venus bull cycle is in effect as is the mars Uranus bull cycle .
A few minor bear cycles coming yet I’m not sure how to read them .
Today’s extended move tips the odds that we bottomed yet the puetz
Cycle has not failed at this point .
First 5 days of January calls the month of January and January calls the year .
The past few years have proved many of the old adages wrong .
Years ending in 9 tend to be bullish and years ending in 2 tend to be lows/bottoms .
The risk now as I see it is from Jan 20 to Feb 13-18 yet it’s really Jan 20 to Feb 4 .
A 10 trade day decline is somewhat of a norm .
The drop from the all time highs was a 3 wave move not an impulse so no solid
Argument to justify a new print low .
I’m just going to let the market prove itself and keep my short term thoughts
Open . We were looking for a wave 4 low ? The price levels were tested and
The market then turned up . Maybe I got lucky and bought the bottom of wave 4
Yet I did so because of the extreme readings in my occilators .
I had a few that showed the market more oversold then the 2009 bottom yet most
Did show the market more oversold then the 2015-2016 lows .
If this market manages to put in a swing high in mid Feb then I’d expect a sideways trading range to follow .
At this point price has exceded my expectation for an initial leg up .
I’ll add , this is typical action following an important low .
What comes next I do not know .
This is one of if not the longest duration rally legs since the market drop .
Something did indeed change .
I don’t mind bear markets yet this drop from the Sept Oct highs did seem
Abit short in duration .
Not sure about option expiry
Till now, the market rally is in line with most of historical precedents. Both the level (a retrace of 38.2 to 50% of the full decline) and duration (about 3 weeks). If this has to follow previous moves, I would expect a low about 6 weeks from Dec 26 low (that would be around Feb 6) followed by a rally back to current levels in another 10 weeks (so sometime in the middle of April). Thats the time when bullish and bearish outcomes start to diverge. In case we have already topped, then the market should start heading down. In case this was indeed a wave 4, we should continue higher to a double top (2940) or a new high. Using my methods, I do not have a way differentiate between these two outcomes just yet (and from a trading standpoint, there is no need to force a distinction just yet).
Regarding Mr. Moon theory : I am new to use of astro for markets. I started back testing simple trading systems on New Moon/Full Moon cycle. I ran a simple buy and sell method – buy in 3 units one day before, the day of and the day after and the same sequence to sell. The event days are always New Moon or Full Moon days. In case its a market close, I move it to the closest trading day. A trading method of buying full moon and selling new moon does have a 60% hit rate, but thats not great in itself. However, if you divide the market into bull market and bear market, then implement the following : During bull markets – buy full moon and sell new moon. During bear markets – buy new moon and sell full moon. This strategy has a much higher hit rate and much better expected value. The only problem is that I defined bull and bear markets when testing this hypothesis. I now have to come up with a real time algorithmic way to defining bull or bear market and then test the hypothesis. The other thing to try would be to calculate the conditional probability to predicting bull or bear market based on last 2 or 3 month of price action around new and full moon. Will keep you posted on the research
So its open position full moon, close position new moon, where position is long on bull market and short on bear market. Formulating this way makes the pattern a bit clearer i think.
Excellent summary Bart…
Very well said!
Liz offered a slight modification that may smooth out some of the inconsistency with a recommendation of + four days on each cycle.
Vol picking up…
VXX hinting at the very least an interim high in place.
Have a great evening all!
Vivek
I look at the moon at pedigree and apogee as well as full or new .
I’m not sold on a new moon low or full moon highs yet I have seen years
Where they have been consistant . So new or full moons to me are just potential turn points .
Same hold true with moon at pedigree or apogee . What I look for is just a few months back
And then look at indicators for oversold or overbought readings near the dates .
The federal reserve did a study many years ago regarding the moon which I have read but it
Was a long time ago . The theory then was new moon lows to full moon highs .
The puetz cycle to me is specific . A new moon high to a solar eclipse low then bounce into
Lunar eclipse then a drop into the new moon .
There was a slight irregularity with this theory as I see it . The Dec 26 low was a full moon
The solar eclipse another low ( not exactly but the market rose after )
If the moon is going to show any consistancies I would expect it to begin in Feb or March .
So far we saw the important low on a full moon and a higher and kind of low on the new moon
Solar eclipse . Jan 20 th is next then Feb 4 . After that time period I’ll pay more attention .
Mercury retrograde March 5 to March 26 has its own scenerio . Essentially I’d say a swing low
Of sorts March 15 and I don’t know what the moon will be as of yet ( I’ll need to look it up )
Back in 2003 I used to trade mercury retrograde on the short side using the 10 day lag .
It held true for about 2 years and then changed . Back then I traded it from 10 days after
Which in this case example would be from March 15 to March 26 . I would see mini crashes .
Of late the past few years with this past decemember as the oddball . Mercury retrograde has
Shown swing lows 10 days after the start . I have back tested this somewhat in depth and that
Is a more typical expectation . Hence March 15 is another swing period to pay attention to .
Puetz Jan 20 to Feb 4 with end of cycle Feb 13-19 th
Mars Uranus conjunction Feb 13 has also shown lows yet the crash phase of that cycle is behind us.
Then comes March 5 , mercury retrograde which runs into March 26 . You then add 10 days to the start
And end dates yet focus on the kid point March 15 .
All of these are potential mini crash time periods yet not high odds , more like 50/50
Yet they depend on certain set ups .
March 15 becomes an important swing date ( I don’t know the moon for this date )
Until I sit down and draw these out and wait for the set up to take shape I can only mention
These odd cycles and be aware of them .
That said, we are in an option expiry week and that by itself might be a reason alone
To see a decline next week as all the positions get unwound over the next few days
In March we get futures expiry . When is first notice day ?
I’m using my phone so perigee and apogee
Hard to read sometimes
In support of Jan. 20 being an important turn date that I have read here several times, this article and charts were published at Zerohedge today.
https://www.zerohedge.com/news/2019-01-16/beware-lehman-analog-why-nomura-expects-rally-reverse-sharply-friday
Yep. One cannot dismiss the role of the Central Banks.
Take a look at the most recent reporting of their balance sheets. Coincidence??!!
Using the high date of 1/26/2018 on the square of 9, sees 358 on the same angle as the date in degrees. Today was 355.
Hi Red Pup! er…Red Dog.
This one’s for you bud…compliments of Luri! 🙂
.https://invst.ly/9syo2
Thank you.
Date specific
Mini-sized Dow Futures $5 multiplier YM Stock Index The business day immediately preceding the third Friday of the contract month.
3rd Friday in March is March 15 th so the day prior would be March 14 th .
Then the June contract is the front month contract .
Mercury retrograde midpoint March 15 ties to this by coincidance .
I have no opinion at this point , just gathering notes is all
Blower944
That was a great article and while I have a different approach the writer
Did a great job of putting the time turn points into perspective .
Thank you for the link
I think nomura ( the link ) makes a good argument yet I also think he is wrong on the bigger picture .
In that article he is assuming the top is in and we have a long bear market going forward into 2020 .
Not going to say he is wrong but I think he will be .
First of all , we need a 5 th wave up to a new high before getting bearish .
Secondly we have entered a bullish cycle which needs to run its course .
He does allow for a weak sideways upward bias so he is allowing for it yet
he is not looking for a new all time high .
I did think short term and for the most part cyclically he is generally correct .
I’ll create that same overlay and begin to watch it from a distance using a weekly chart .
I must say though with so many extreme to even mildly bearish articles I’m seeing it appears
Everyone is bearish . That to me implies higher prices despite any pullback .
Verne
I’m not going to argue the central banks nor the bankers . I’m just going to say
If they are buying to support the market then they have perfect timing .
Let’s see next week’s market action though before saying hey something is outside the norm .
I have wondered about the crypto currencies and just can’t buy into them .
If I was going to though I’d use my same timing methods so Jan 20 still a concern .
The gold stocks again Jan 20 th .
Bond market or us dollar again Jan 20 to Feb 4 .
Sometimes these cycles appear to fail yet show up perfectly in other markets
Are interest rates turning down now ? Is gold holding up or stalling ?
Us dollar index ? Stock indexs , foreign markets etc….
It all matters .
As Peter says , it’s all the same market
Enjoy the week everyone , I’m going to wait the next few days out.
Interesting read
https://lunatictrader.com/performance/
No problem Joe. I know we think a bit differently on the subject. We can certainly agree that whatever the outcome of their intervention, it will be short-lived. We saw how quickly the lift engineered by Trump’s tax give-aways evaporated. I suspect
China and the others will ultimately fare no better with the current largesse…
Peter t
This article you might find interesting .
It’s not so much about the stock market yet
You may find an interest
https://lunatictrader.com/2013/11/19/the-long-term-crash-cycle/
Great article, Joe. Thanks! A keeper.
So from this article I just realized, whenever a bubble is due, the subject of the bubble is easily chosen. There is plenty of choice of subject to blow air into…
ES overlap. One more wave up before the fat lady…ahem…at least clears the pipes…
Gorgeous VXX bull flag….
Yesterday we got to 61.2% retrace of the December decline. Would not be surprising to see that level again today / tomorrow just to stop out some shorts. Missed yesterday’s chart show. Will head over there now to get some of Peter T’s wisdom.
R.I.P. Jack Bogle, father of “Passive Investing”.
How interesting the time of his passing…!
Perfect way to run stops @ 2630. I sold whatever remaining pieces I had planned on selling on that pop !
Quite a big pop. No chance im taking shorts here until it turns. Been burnt too many times by the bears failing to follow through.
I got lambasted on another site a few days ago when I challenged a bullish nested 1,2 count and warned people how unwise it was to execute short trades until we had a clear and decisive break of the larger wedge’s lower boundary.
I have to say I was impressed with subsequent private contact to concede the point and an invitation to continue to post, but not talk about specific trades. It is quite rare these days to see that kind of humility.
Bottom line? That wedge remains intact.
https://www.youtube.com/watch?v=mCQp_RcLxfE
A fractal to think about:
12/26/2002 to 1/17/2003 = 16 TDs; low to Hi; full moon = 1/18, 1/23 = perigree
12/26/2018 to 1/17/2019 = 16 TDs; low to ?? ; full moon & perigree = 1/21
The fractal from 8/24/15 has a swing high on 9/17/15. https://worldcyclesinstitute.com/a-finish-with-a-flourish/comment-page-1/#comment-35462
Liz h
I’m seeing 12-27-2002 as the closing low and Dec 312002 as print low
Then a rally into Jan 13 2003 .
I get what your saying if your think of the moon but otherwise
I’m not so sure it fits today .
Tossing out the moon though only because I haven’t looked .
July 23 2002 closing low , July 24 print low and reversal up into August 22 2002
That was a 22 trade day rally closing low to closing high which was very choppy and corrective .
Then came a 34 trade day decline into the bottom on Oct 10 2002 .
A bit of Fibonacci involved July 23 close low plus 55 trade days to Oct 9 close low plus
55 trade days again to Dec 27 2002 close low
I’ll watch it yet honestly I’m not seeing the correlation since the swings are a bit different
Your 2015 fractal I understand and makes more sense to me
food for thought only .
i base most all my research on the cash dow .
for tomorrow ill look to take a short position using the YM futures
yet i will enter that short position at CASH DOW 24615.10 .
that level is a .554 retrace not the .618 .
i intend to use that level as my stop if im profitable in my trade
this is a day trade only .
i will use that same 24615.1 level for monday as well .
my trades are intended to be very short term in nature yet
if filled and we do see a decent drop i may hold through the weekend
yet most likely not unless i see Thursdays low taken out and the dow closes
near the lows of the day .
if this is a SHORT SQUEEZE then this trade may fail since everyone short will
cover and options traders will be forced out as well going into the weekend .
bottom line: im viewing 24615.10 as a line in the sand so to speak .
it my line though so please do your own research .
im long several stocks and this will be an early hedge and a test short
My favorite analytical tools are the ones I think very few others are looking at. The chart at the link below is the daily closing chart of SPX going back to the early 2016 lows. I have drawn 1/3 and 2/3 Speed Resistance Lines (SRL) from the 2-11-16 closing low to the 9-20-18 all-time closing high. These are fabulous technical tools invented by past market master Edson Gould. Not enough room or time to explain them here so search online if you’re interested in their construction. The black rising line is the 2/3 SRL (even though TradesStation) mislabels it 33.33%. Notice when it was convincingly broken in mid-December the decline accelerated. The next target would be the 1/3 SRL which is currently around 2242 and rising. Often, as with the breaking of trendlines, prices will come back after an important and decisive break to “kiss” the line from below before continuing to the next target. Today, that line was at 2654 and rising around 1.1 points/day, i.e. around 18 SPX points above today’s close. But that’s not all! I have drawn a line joining the closing highs of 1-26-18 and 9-20-18 and then drew a lower parallel channel on the most external low (most external to the lower parallel channel line) between the two highs. It occurred on 4-2-18. Notice that the lower channel held the declines to closing lows on 10-29, 11-23, and 12-7 through 12-13. Then came the break and the acceleration lower. We are now close to also “kissing” that line from underneath at almost the same level as the SRL detailed above. Today, the lower parallel line was around 2651.35 and moving up around 0.354 points/day. If these lines are convincingly surpassed to the upside, I would have to concede this market is going higher, perhaps a lot higher. I don’t believe that is going to happen here but I will let the market tell its own story. In the meantime, these lines should provide powerful resistance to convincing closes above 2650-2660. Here is the link to the chart. Click on it to enlarge it… Enjoy 🙂
https://imgur.com/a/63tL2oM
Great info Peter G…as ususal! 😎
If there is no major reversal today I’d say we will power onto new highs from here to end the bull. If we are going for an S&P double bottom i would expect it to happen over a period of 3 days in a short sharp drop.
Move up CLEARLY corrective. They have just about completed the task of shaking out all the bearish positions! 🙂
It could well be. All the stops being taken out may have pushed this up today. I still expect a rapid reversal if this is gonna drop to Peters target.
This website is for educational purposes relating to Elliott Wave, natural cycles, and the Quantum Revolution (Great Awakening). I welcome questions or comments about any of these subjects. Due to a heavy schedule, I may not have the time to answer questions that relate to my area of expertise.
I reserve the right to remove any comment that is deemed negative, is unhelpful, or off-topic. Such comments may be removed.
Want to comment? You need to be logged in to comment. You can register here.