
 Full Moons
Well, the influence of the full moon on Wednesday didn’t do very much to affect the markets. But, it was certainly apparent in the free blog: Animal spirits were out of control and on full display.
I’ve attempted over the past several years here to promote the idea that the manner in which the market moves is a science: It’s a result of the influence of the solar system (primarily) on the human psyche. There can really be no other logical explanation for these patterns that repeat over and over again ad infinitum and adhere to wavelengths that “magically” align with fibonacci ratios.
As a science, because of the repeating patterns (with rules and guidelines that stipulate how these patterns must trace out in charts), EW can be used as a very accurate predictive tool; in fact, the most accurate predictive tool that I’ve found anywhere so far.
I can only prove this science by providing accurate projections for what’s going to happen going forward in the market, and I’ve done that consistently for over three years with very few errors (and that’s over several asset classes that include almost a dozen individual assets).
I’ve only been able to achieve that level of accuracy by spending several years of research on the movement of the market, disproving along the way some of the rules and guidelines put forward in the Prechter/Frost book, The Elliott Wave Principle. There are a number of issues and omissions in that book that have plagued the implementation of Mr. Elliott’s work by others not prepared to do their own research (their own thinking).
That’s not to say the book is not a good training ground, but it’s only a start. The principle is indeed complicated, but I have never seen it fail. Any errors have been my own.
There is so much misinformation about this science that I don’t see the benefit of allowing people to come on this site and add to that confusion by promoting their own version of EW rules and guidelines that are simply not true, either in my work, the work of Prechter/Frost, or the work of Mr. Elliott himself. I have made my views on this matter very clear with a blurb that sits just above the fields in which you must use to comment.
That’s the reason one current commenter has been placed on “moderation” (after two warnings). Moderation means that comments must be approved by me before being displayed, which is tedious for me, and something that I only get around to doing sporadically.
On the other hand, I have no issue with someone disputing my count, or work. But, you’d better know what you’re talking about, (with at least a strong knowledge of the Elliott Wave Principle). If not, it’s simply opinion, which has no value, is a complete waste of time, and has no place here.
The other issue of “the kids” on the free blog fighting amongst themselves, is quite frankly ridiculous and irritating, as it would be in any family.
If you can’t control your emotions (critical if you’re even contemplating involving yourself in the world of trading), then please don’t comment here. Otherwise, you’ll force me to ban you, which is, for me, a click of a button. It quickly solves the problem.
There’s a lot of information generated within the comments which I find really interesting and worthwhile; I hope you do, too. Therefore, my inclination is to keep it going. I want it to be a learning environment, for cycles (the influence of the Universe) and EW (or any other sciences or methodologies that help to understand the movement of the market and, by extension, the world in which we live).
But if the downside of bickering (and “fake news” about Mr. Elliott and his work) continues, and makes the free blog a shouting match not worthy of paying attention to, then I’ll shut it down.
If it does not allow me to reach my objective of extolling Mr. Elliott’s work as a science, then I’ll shut it down.
I do not want to be the school teacher who makes the entire class stay late because one low-life is chewing gum. But if that’s the only solution, so be it. It’s up to you to decide, quite frankly. I’m a big supporter of the work of many of the contributors here; I’m nothing special myself, and Mr. Elliott’s work in only one approach to the market.
Let’s try to keep free speech alive, even though a major trait of a five hundred year cycle top is to shut it down — you can see that happening all over the world as this cycle turn plays out.
What has been will be again, what has been done will be done again; there is nothing new under the sun. Ecclesiastes 1:9
I’m on your side; I want this to work. Don’t make me any crazier than I already am … lol.
____________________________
The Problem With Not Everybody Playing Ball (the market, too!)
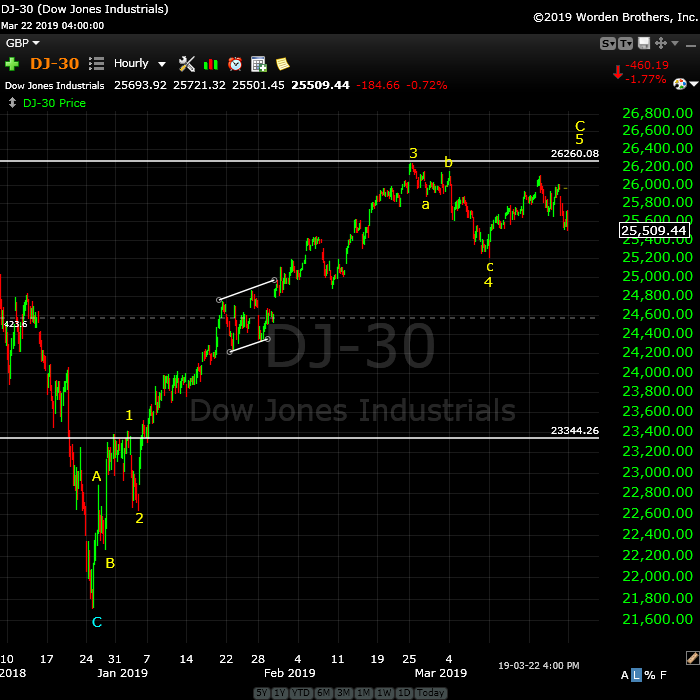
Above is the hourly chart of the DOW. (click to expand)
Above is the one hour chart of the DOW. This chart is now looking a lot like the SP500. it clearly needs a final high, as we have 3 waves down from the top.
There’s a similar problem with the market that the free blog has. Once in a while, somebody gets out-of-line. IWM and the DOW are fulfilling that role, at the moment.
As I’ve shown many times on this site, when you get tops like the current one we have in progress, all the US indices must reach highs properly. You cannot start an important wave down (a corrective pattern in this case) from somewhere in the middle of a wave structure. You also can’t start either the C wave of a flat, or a zigzag with a wave in three waves; It must be a five-waver.
As I often say,
“Trade what you see, not what you think.”
_____________________________
Elliott Wave Basics
Here is a page dedicated to a relatively basic description of the Elliott Wave Principle. You’ll also find a link to the book by Bob Prechter and A. J. Frost.
____________________________
Registration for Commenting
Want to comment? You need to be logged in to comment. You can register here.
If you register, it protects your information. It also allows you to comment without filling in your information each time. Once you’re registered, simply go to the home page and click on the login link top right in order to log yourself in. Usually, you’ll be logged in for several days before needing to be logged in again.
______________________________
Problem receiving blog comment emails? Try whitelisting the address. More info.
______________________________
A true expert in Elliott Wave FL 2
A true expert in Elliott Wave …You are a true expert in EW analysis. What you provide is not available anywhere and is priceless. Subscription on your services is the best thing I have ever done. Many thanks for your effort to make me a better investor. I now have more trust in my investment decisions. I hope you will continue the excellent work! —FL |
Have not had a losing week RW 2
Have not had a losing week …I have been with Peter almost a year. The only thing that matters is have I made money with his service. I think I have finally turned the corner using Peter’s EW. I have not had a losing week in the last 5 months. Thanks Peter, for your amazing amount of hard work. —RW |
The best of them JL 2
The best of them …Last couple of years, I subscribed to several ‘market traders’. You are by far the best of them and the personal contact is awesome. Daily and daily updates are very well written! Besides your expertise in EW, I also like your cycles analysis. Best investment I ever made! —JL |
Get an upper hand … JC 2
Get an upper hand in trading …Seeing all the different currency pairs and the wave structures and hearing you explain why this has to do that on a nightly bases gives one a upper hand when trading. Elliott Wave applies to all stock and indices and can be applied to any candlestick chart. If someone ask what you want for Christmas – Tell them a membership to Peter’s “Traders Gold!”—JC |
Couldn’t be happier … KK 2
Couldn’t be happier …The analysis and insight you provide is simply amazing! I’ve been trading the futures and equity markets for well over thirty years and usually average around 5% monthly. Since joining your Traders Gold Service two months ago, that number has better than doubled. I couldn’t be happier.—KK |
Rise above the rest … SM 2
Rise above the rest …I have only ever met a few people who, in their chosen fields (astrology, medicine, music, martial arts, technical analysis), rise above all the rest and you are one of them…you have ‘the gift’…and that’s why I’m a Trader’s Gold member. —SM |
Tops in your field DZ 2
Tops in your field …You are tops in your field. Tried to follow Elliot Wave international for years. They were always behind the market. After discovering you, I perceive that you are an expert in reading the waves, which puts you way ahead of the rest of your peers. And you can read the Waves like you are reading tomorrow’s financial section. I pray you stay healthy. —DZ |
the real deal SM 2
The real deal …‘Educational, insightful and thorough market analysis for all levels of traders. It’s Elliott Wave at its best….Peter Temple is the real deal’ —SM |
US Market Snapshot (based on end-of-week wave structure)
Here's the latest daily chart of ES (emini futures)
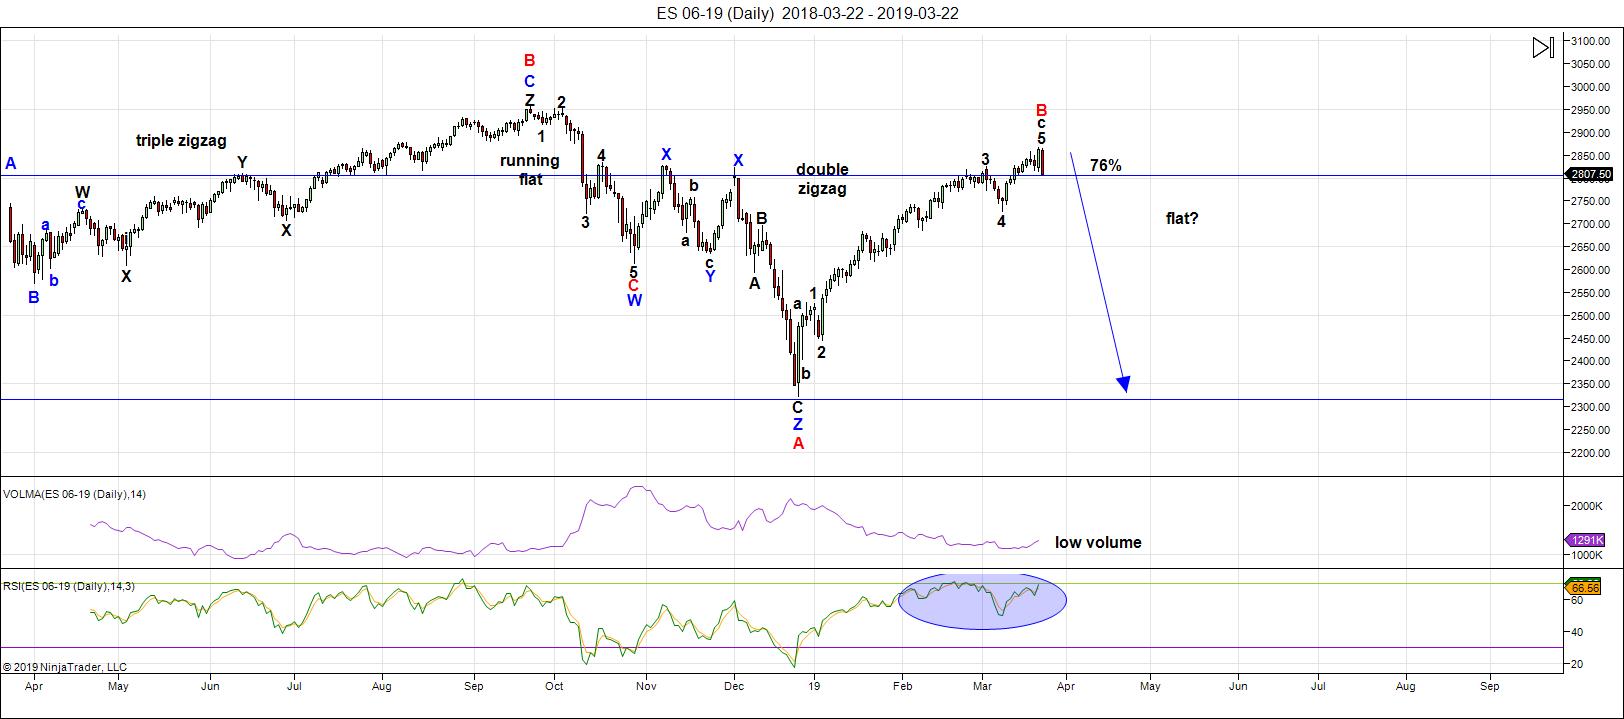
Above is the daily chart of ES (click to enlarge, as with any of my charts).
We're still sitting near the top of a B wave that's risen to about the 76% level of the height of the previous set of waves down from the all-time high at October 3, 2018. Almost all the other assets I cover on a daily basis are hovering near inflection points.
However, the US indices are having a difficult time getting all "the gang" to a new high. IWM and the DOW both look like new interim hight are required before everything heads down in a dramatic capitulation. The US Dollar Index also has just a bit more work to do before it turns up in earnest.
So, it looks like we have one more high to go in ES - a minimal new high to finish what appears to be an ending expanding diagonal.
The next major move is to the downside.
As I've been saying, the wave up from Dec. 26 is clearly corrective and, as a result, must fully retrace. This is supported by the US Dollar Index, the major USD currency pairs, WTI Oil, along with DAX and other international exchanges.
Summary: My preference is for a dramatic drop in a C wave to a new low that should begin this week. The culmination of this drop should mark the bottom of large fourth wave in progress since January 29, 2018 - over a full year of Hell. It may be a dramatic drop that lasts multiple months, and will target the previous fourth wave area somewhere under 2100.
Once we've completed the fourth wave down, we'll have a long climb to a final new high in a fifth wave.
_____________________
___________________________
Trader's Gold Subscribers get a comprehensive view of the market, including hourly (and even smaller timeframes, when appropriate) on a daily basis. They also receive updates through the comments area. I provide only the daily timeframe for the free blog, as a "snapshot" of where the market currently trades and the next move on a weekly basis.
______________________________________
Sign up for: The Chart Show
Next Date: Wednesday, March 27 at 5:00 pm EST (US market time)

The Chart Show is a one hour webinar in which Peter Temple provides the Elliott Wave analysis in real time for the US market, gold, silver, oil, major USD currency pairs, and more. You won't find a more accurate or comprehensive market prediction anywhere for this price.
Get caught up on the market from an Elliott Wave perspective. There’ll be a Q&A session during and at the end of the webinar and the possibility (depending on time) of taking requests.
For more information and to sign up, click here.
| "I think you are the only Elliot Wave technician on the planet who knows what he's doing.” |
| m.d. (professional trader) |
All registrants will receive the video playback of the webinar, so even if you miss it, you’ll be sent the full video replay within about an hour of its conclusion.


Thank u SIR PETER..hoping the new high in SPX gets us to my 2880 target..its only 20 points above previous high..
Hi Peter,
Congrats for your prediction, this week ended by a significant drop, as you planned.
I actually have a question about EW and the influence, or not, from Central Banks.
They are investing massively to influence the overall stock markets (US only 4000 billions balance sheet), playing with interest rates like crazy, dropping billions in various fancy QEs (whatever names they have), but at the end, no influence in the EW predictions?
Thanks for your explanation.
Cheers
Ser
I’ve answered this same question many times, but since there are some interesting aspects of the wave structures (certainly around the 2009 B wave bottom), I’ll do a blog post on this next weekend. It would be a good example “chapter” for the book I’m trying to get to.
The answer is “yes and no.”
The “yes” part is that from 2009 to the present in the SP500 and related indices, we have a B wave. On page 58 of the Principle book, Prechter provides his opinion that this is impossible (“Erroneous Concepts and Patterns”). Ralph Elliott, on the other hand, believed they were possible. He was obviously correct, as We have one across all NYSE related indices, obviously a result of the QE of central banks. In fact, you can see the wave changes at the bottom of the wave large set of waves down from 2007 to 2009. These waves began as impulsive waves, but didn’t complete near the bottom (that where the stimulus began) and so the entire wave down must be classified as a corrective wave. Although I didn’t pay all that much attention at the time, it predicted another wave up to a new high.
That is the influence of QE, reflected in the wave structure.
The natural 172 and 516 year cycles tops were in 2007. We expected the crash then, but the printing of debt by central banks changed the game. However, as I’ve also written many times before, I do not buy your premise that they change interest rates. Quite the contrary, because they follow the market. The ups and downs of bond yields determine interest rate policy. If you mean they “play” with them within a predetermined range, that I can buy, but treasury bonds are the final word.
The “no” part is this: The subwaves all play out as they should. The “B wave” up from 2009 is a B wave because it’s clearly a corrective structure. Within that structure, Elliott wave principles hold true, as they always have and always will (until proven otherwise). The planets still revolve as they always have (and hopefully always will), influencing the emotions of humans on this tiny revolving rock called Earth, so the waves play out appropriately to the beat of the Universe.
I have seen no anomalies in the wave structure up from 2009 and I’m doing analysis daily at all degrees of trend across multiple assets classes (and following international indices).
Hope this helps. I try not to get into markets fundamentals to any great degree because it’s important that I keep bias out of my technical analysis.
Thanks Again, Peter.
You have probably already thought of this, but here it is, just in case:
Maybe in order to help you with the work load you could have a couple of moderators from around the world take shifts approving posts? That has worked well in other forums.
Have a great week!
Peter..thank you for the post and for keeping the blog….and sad to see you go Verne happy trading…
Also found a good site..Spaceweatherlive.com for more research on the geo thermal storms..if anyone interested..
Thanks for this. I may add to my list of links.
sorry meant geomagnetic..not thermal
You’re welcome. 🙂
https://twitter.com/allerotrot/status/1109890206176546817?s=21
BPCOMPQ…the trend is clearly down…suspect by Friday, April 12, 2019 the NASDAQ will be dramatically lower…💥
https://en.m.wikipedia.org/wiki/United_States_Treasury_securityThe problems with debt issuance became apparent in the late 1920s. The system suffered from chronic over-subscription, where interest rates were so attractive that there were more purchasers of debt than supplied by the government. This indicated that the government was paying too much for debt. As government debt was undervalued, debt purchasers could buy from the government and immediately sell to another market participant at a higher price.
In 1929, the US Treasury shifted from the fixed-price subscription system to a system of auctioning where ‘Treasury Bills’ would be sold to the highest bidder. Securities were then issued on a pro rata system where securities would be allocated to the highest bidder until their demand was full. If more treasuries were supplied by the government, they would then be allocated to the next highest bidder. This system allowed the market, rather than the government, to set the price. On December 10, 1929, the Treasury issued its first auction. The result was the issuing of $224 million three-month bills. The highest bid was at 99.310 with the lowest bid accepted at 99.152.
Thanks for this, Joe. Important info. Here’s the link, as the one you put up doesn’t work: https://en.wikipedia.org/wiki/United_States_Treasury_security
(you need to remove “the” from the link).
Thanks Peter. Trumps “exoneration” may provide the boost it needs to get to new highs. Charles Lloyd – No more bickering between us or anyone else.
I agree Q..sorry i snapd at u..i jus take my approach VERY seriously..& am putting my $ where my mouth is..hope you saw my picture of the actual entry i did on fri.
Imma not hindsight trading..i trade almost evryday @ open & either go long or short by 940am est time. dont always have time to come here & post b4 i enter.
Whereva mkt opens..i look at my indicators & where mkt is in relation to 10 & 20 sma..this approach has been refined ova past 5 yrs & utilizes my 25+ years of trading..its my baby..& why i was so defensive..
imma sorry 4 bein so personal 2ward ya!
Very nice Q and Charles (:
And lets not forget, spring is in the air…
Autumn over here mate.
And still very dry. Just doesn’t want to rain properly.
Ok well said, so equinox.
Thanks for correcting the link peter
When I pasted the link it added to the sentence and that’s why the ” the ”
ended up in the link .
MCD
Not sure if McDonalds is in a triangle or not but of so
a poke below 178.27 would be expected .
177.01–176.44 is a gap on the daily chart .
Dow stocks
I have never been a fan of the 1.618 time retracement yet
it might be something to consider .
from the dec 24 closing low in the heavier weighted dow stocks im following
we saw a rally from the dec 24 closing low to the feb 25 print high ( also closing high )
the 1.236 time retrace called the march 11 low ( I don’t use the 1.236 time line either )
the 1.382 time retrace called the march 19 high ( normally id expect it to be a low )
The 1.50 time retrace is what id normally look at yet since these seem to be outside the norm I used the 1.618 time retrace .
41 daily bars up * .618 = 25.33 trade days.
That leaves 6 to 7 trade days to go .
This is not something id hang my hat on or jump up and down about but it is something id look at in the event that this week is pretty much all down .
The YM would have 2 equal point moves down at 25120 yet the 1.618 * A
would call for wave C to end at 24,486.
I can see where roughly 700 dow points can be shaved by the individual stocks with in it yet my main focus has been the Jan 22 lows .
The lesser weighted dow stocks are for the most part back in sync with the heavier weighted dow stocks . It will take both groups to get the dow down near 24,000 ( cash dow )
BA : No idea on the wave count on the downside so just following it .
HD, UNH, MMM, GS, BA, AAPL as a group dropped back and hit the .382 retrace had a weak bounce and are set up to head lower to most likely the .618 retrace.
If they can manage that it would be 2 equal waves down .
5 day and 10 day trin are beginning to move in tandem and are not into oversold territory .
5 day and 10 day adv dec line are mixed yet pointing downward and not into oversold territory .
Hourly $tick somewhat oversold yet that is an hourly chart and in my opinion a bit of noise.
My own price oscillators still have more downside available .
I am long several stocks and understand the risks in this market .
Do not assume that my longer term bullish view ignores the downside bias I’m seeing short term.
As Always we must all do our own homework .
Keeping to myself for the next week .
Good luck trading everyone .
Tom; did you post an energy chart? If so; didn’t notice.
Hi André, could you post your current market view please? Thank you.
Winter is over and spring is here. I’ve laid out the dates of my 17.6 year stock market cycle in a simple timetable.
http://www.17yearstockmarketcycle.com/
Good luck all,
Kerry
Thanks for sharing Kerry. Do you consider 2017 to be the end of secular bear market that started in 2000 ? I am trying to understand your time cycles. Its a little confusing, but I am guessing your columns are overarching bull or bear cycle while the horizontal rows are cycles within the larger cycle.
Hi Vivek,
You are correct, the columns are the longer term secular bull or bear cycles. The rows are the cyclical bull or bear cycles within the larger cycle. 2018 was the end of the secular bear/beginning of the new secular bull market according to my cycle. (2017 is red and so was a top).
Kerry
Kerry,
Thanks for clarifying. I will have to do my own work on your research to see if it makes sense from my perspective. A quick run on my data set threw out 17.65 years to minimize error – so I will use that and see if things fit. It comes to within a month for 1982, 2000 and 2017. However, there is significant variance in performance over the first 24 months of the data set. After that is where rubber hits the road. In this case, it would point to around Dec 2019. By then, we should be on our way to new highs if your conjecture is correct. Lets see if it plays out. Always good to get new perspective on looking at markets.
Nice work but i strongly believe central bank easing programs have altered this 17.6 year cycle you have identified. We shall see what happens as your forecast is the complete opposite of Peters’ so i presume one will be correct and the other wrong.
Thanks Q, people have been saying that QE distorted market cycles and my cycle won’t hold since my book was published in 2013. However, if you believe in cycles, which I do, then you expect the cycle to win out. Whilst QE stopped deflation, we’ve had a poor period of productivity and growth. I’m optimistic that is changing.
My cycle is unambiguous and hasn’t changed since I identified it. I’m either right or wrong and as I love to say, time will tell.
I agree there will be a big boost in productivity but for that to happen the world governments need to convince corporations to invest into productivity and not their own shares as all that does is waste precious capital by making the shareholders and executives richer at the expense of longer term business gains. A ban on share buybacks would be the best policy to force companies to invest in their future but a Trump government will certainly not make that happen.
Hi Kerry very interesting. I have several indicators that can predict the movement of the markets. But sometimes they let me down because the research is not finished. Last week was perfect. This week is an very important week. I think we make the Head and Shoulder pattern on Wednesday. Watch http://www.prognoseus500.nl/
Thanks Willem, I’ll keep an eye on your pattern.
PS – I live the moving wave on your blog, very cool.
Hi Tom,
Can you please post your energy chart. Are you getting your data from Solarham, I wonder how you are creating those charts. Please post when you get a chance.
Looks like this mornings pop is fading……
I have a feeling we are heading down now. I’d like to see an acceleration to the downside asap to confirm.
My next astro turn date is April1-2, for now it looks like a top.
I hope we haven’t lost our friend Tom….and energy charts.. 🙁
I did find this.. I think it is similar..so figure it is worth a watch…
https://www.spaceweatherlive.com/en/auroral-activity/aurora-forecast
Hi Marie,
How does it corelate to market can you explain a bit
Still looking..quite like a bull market..evry dip gettin bought up..
Imma still bullish on spx headin into the Fall of 2019..thinkin we get to 2880..then down to 2600 or so..& back up to 3400.. Target is 4K by 2020.
Unless we get some kinda black swan..this puppy stays up IMHO
Peter T
You have attracted many smart and talented people to this site .
Just something to keep in mind is all .
Joe
haha … you included!
Mercury goes direct march 28th
2 days from now
Sorry I made a terrible mistake. In to the weekend we go to a High (not a LOW) The max High is 2872 and 2879(fut). As soon we make that we make a (HUGE?) turn. Expecting the High Thursday US market Open. (=testing calculation)
http://www.prognoseus500.nl/
Kerry Balenthiran
I have not looked into your 17.6 yr cycle with much detail yet on the surface its looking more like a 35 – 36 year cycle ?
recently I have come across a 28 year cycle which I have not dug into but I intend to .
its more like 11 years 11 years then 6 years ( 28 yr ) then 11 11 6
your 17.6 or even the 35-36 yr cycles may fit into this .
example 1879-1890-1901-1907-1918-1929-1935-1946-1957-1963-1974-1985-1991-2002-2013-2019-2030-2041-2047.
How I came up with this was by just playing around with the calendar .
Chris Carolan who has the spiral calendar site noted the 58 yr cycle
half of which is 29 years.
There is a fair amount of information about the 18 yr cycle ( 17.6 )
From what I gather from your work. the yr 2018 was a cycle low ?
Higher prices into the year 2023 ?
How well do your cycles line up if you began in the year 1907 ?
or even say the year 1683, 1711, 1817 , 1873 ?
the more I work with cycles the more I find the need to go backwards in time.
Just thinking is all .
Thanks for your post
Hi Joe,
Yes it is a full cycle of 35.2 years but since 18 years is a popular bull/bear cycle I went with the half cycle for the name. It is made up of 4.4 year & 2.2 year cycles, so 4.4+2.2+4.4=11 and 4.4+2.2=6.6 so that could fit what you say.
Yes 2018 was a low (or end of sideways bear market), 2023 a high.
I haven’t taken the cycle back further as I didn’t have the data. I believe that 1841 was a low. 1841+35.2+35.2=1911.4. 1911.4+17.6=1929.
ATB,
Kerry
Peter T
I have mentioned to you in the past that I have not followed currencies very closely.
I’m not asking about trading them I’m just looking for a spot to begin some research that may take me in the right direction.
Which currencies do you think should be followed the most ?
I do watch the us dollar yet I’m intending to create a basket .
Any info would be appreciated and im mostly looking for a starting point
on which currencies to pay attention to . can be 10 or 3 and this is not
for trading at this point .
Do you think Robert prechters SCB is valid today ?
http://www.stablecurrencyindex.com/overview/currentcomp.html
http://reynoldsoptions.blogspot.com/2005/06/ewi-stable-currency-benchmark.html
Kerry
Thanks again
I appreciate the detail .
The mkt today is a bit messed up in my view .
short term hourly tick becoming overbought yet the trin numbers
showing a lot of selling .
leaving the mkt alone for the week as noted a few days ago .
still looking bearish short term to me .
My projections are still calling..for a 2880 top.
Once SPX hits that level..I have 2 possibilities:
..1 a 200 point drop..to the 2600 area then back up to 2950 to 3K
..2 a deeper C wave like SIR PETER is calling for..down to below 2200
Either way..imma seeing a turn coming soon. My long term long positions now @ jus 20% long.. mostly doing intra day trades based on my 10 & 20 sma strategy.
Also noticing..a golden cross bout 2 unfold in spx..
50 day @..2747
200 day @..2755
Could see the bullish cross..as soon..as tomorrow..
This could push the S&P up to my target..at 2880
Kerry, I have a hard time wrapping my brain around 2018 being a cycle bottom or even the end of a sideways bear market of any kind. The NY Composite Index made new all-time highs (above those of 2000) in 2004, 2005, 2006, 2007, and then again in 2013, 2014, 2015, 2016, 2017, and 2018. That was one hell of a bear market??? How about Peter Eliades’ two main longer term cycles. One is 17 years long and with only 1 (or maybe counting 2017-2018 as the second) two minor one year discrepancies, pinpoints some of the most important turning points of the past 120 years: 1898(B), 1915(B), 1932(B), 1949(B), 1966(T) and (B), 1983(B)(Minus 1), 2000(T), and 2017(T) one month off Jan 2018 top which stands to this day on NYA. The next most impressive is exactly 20 years long with each resolution a very major bottom in 1922, 1942, 1962, 1982, and 2002. Can’t get much more accurate than that, can you?
HI Peter G,
I can see why you’re having a hard time seeing 2018 as the beginning of a massive bull market. If you adjust the Dow for inflation there was a long term sideways move from 2000 to 2016 and UK markets are significantly lower.
In terms of list of dates you mention with the comment “Can’t get much more accurate than that, can you?”, I beg to differ. Where is 1929? 1974? 1987? 2007? 2009? Why are some bottoms and some tops? How can this be used to take a position going forwards? These are all problems I had when I first started looking into cycles, particularly Armstrong’s cycle. I wanted something I could trade with confidence, incorporating other things such as technical analysis of course. My research led me to my own cycle.
1929(T), 1931(B), 1936(T), 1938(B), 1942(T), 1943(B), 1944(T), 1945(B), 1946(T),
1947(B), 1965(T), 1974(B)
1982(B), 1987(T), 2000(T), 2002 (B), 2007(T), 2009(B), 2013 (wobble), 2015 (wobble), 2017 (wobble).
Clear and unambiguous. Is it correct though? We don’t know yet but in my book published in 2013 I stated that the 2009 drop was the lowest (like 1974) after the low after the 2015 commodity bust was the date to buy and hold and that is what I have done and it has held me in good stead so far. Is 2023 the next significant top, will 2035 be the top of the next secular bull market? We don’t know, but I am willing to bet my buy and hold portfolio on it.
https://www.amazon.com/17-6-Year-Stock-Market-Cycle/dp/0857192736/ref=cm_cr_arp_d_product_top?ie=UTF8
ATB,
Kerry
Hardy har ha! A bear market? I dont think all ships rise in a bear market..
Its been a bull market..since 2009..still is..but it will be ova in anutha 2..to..3 years IMHO..
Ultimately, we’re being foolish if we think we “know” what’s going to happen. That mindset is the quickest way to lose money. But we can use research to guide us in our investment decisions, and we’ll have the greatest confidence in our own research. This is what I said in the comments section back in 2017, from the post “The Top is at Hand”:
Kerry Balenthiran
October 14, 2017, 12:27 pm
“I’m with you Kent, 2009 and 2016 were major lows. Up and away in this new 17.6 year secular bull market imho.”
https://worldcyclesinstitute.com/the-top-is-at-hand/
Well when you confuse a bull and a bear market that seems pretty darn foolish if you ask me. The best tool a trader can have is EW, especially when you have an analyst as talented as Peter Temple. He may not always help us time the market but he generally knows which direction things are heading!
Bill,
I am new to Geomagnetic storms as well..Toms’s charts if the chart I found is similar the market should move with the wave of storm energy at least that is what I saw from his chart…but I am watching to see..
one thing I have read though is that in large Geomagnetic storms..meaning like a 6or 7..the week after is when people are affected and a market like the Small Caps are mostly effected from it since it is mostly individuals who buy it..and should go down..
I dont see any 6 or 7 in there most of the time i see it at or below 5. Are you talking about the KP index and K values correct?
just a thought..I think one of the bigger things Elliot Wave has taught me..is when not to buy. and when to wait…I know we always think of it in more of terms of buying
I never did buy the “inflation-adjusted” arguments, Kerry. I would argue the market does a good job of self-adjustment for inflation. As to the missed turning points, you are certainly not arguing that one cycle explains all important turning points, are you? Try telling a person that you believed 2000 would be an important top for the next 17.6 years and that the only reason it kept going to higher and higher prices for 10 of the next 18 (17.6) years is because of inflation. On a historical basis, that period was relatively inflation-free. As to missed turning points, try a 25-year cycle from 1907 to 1932 to 1957 to 1982 to 2007 to account for 3 more of the most important turns of the past 100 years. Those three cycles alone (17 year, 20 year, 25 year) account for an impressive percentage of the important turns of the past 100 years or longer, and they need no arbitrary adjustments for inflation to argue for their relative importance… As to the primary important 1974 low, try a shorter 212 week cycle leading up to that bottom with amazing accuracy…
Peeps alway try & distort numbers using inflation adjusted this or that..
Simply look at the charts..did the market rise over the past 10 years? yes or no?
Even the most bearish analyst out there knows this has been a bull mkt..any1 who tells u otherwise is either lying or doesnt understand the mkts & economy!
Real returns matter more than nominal returns, hence why people look at the Dow/Gold ratio or prices of indices in other currencies and other asset classes of course. Housing had its day, as did gold, and bonds.
I’ve never advocated selling in 2000 and not reinvesting until 2018, that would be madness.
“As to the missed turning points, you are certainly not arguing that one cycle explains all important turning points, are you? ”
Yes I am.
yes.. the KP index..
I still see a top April 1-2, and I hope Tom will come back with his beautifull energy..
Kerry
from my point of view the 2009 lows were extremes similar to 1974 as well as 1939-1939 ( going from memory here ).
the recent lows in dec 2018 were not as extreme but close .
the snap back into feb-march this year off of those dec 2018 lows was also an extreme move which I can only at this point consider the beginning point of a new bull market cycle.
Right now though as much as I am bullish for the year 2019 I am expecting a fairly deep drop into the year 2021 .
Todays market action was not bullish from what im looking at .
Looking at the individual dow stocks the mkt gapped up and closed
lower than the open. yes the cash dow closed up 91 pts and yes it closed higher than the open yet when I look at the individual stocks it was a lower close than the open .
The 5 and 10 readings on the advance decline line ( $add) are mixed .
the 5 day now turning up and the 10 day still point down .
The $trin readings also giving a mixed picture
I update my own oscillators on Saturdays or Sundays so no comments on those.
5 day trin sum
this indicator is a very very short term indicator .
readings at 4.00 imply an overbought reading yet more times than not
4.50 to 4.25 is about it before a short term high .
readings from 7.0 to 9.0 are typical oversold readings .
again this is a very short term indicator .
the last 5 closing numbers beginning with todays close and going back 5 trade days
1.06 + 1.77 + .61 + 1.15 + 1.60 =6.19 <– a technical oversold reading
5 day trin sum above
5 day moving average of the daily trin = 1.24 = Kind of oversold but nowhere near any extreme.
10 day moving average of the daily trin sits at 1.15 which id say is more overbought than oversold yet nowhere near any extreme .
5 day adv-dec line sits at 104 which is neutral ( minus 600 to plus 600 is the range )
10 day adv dec line sits at 247 which again is a neutral reading .
hourly tick is showing an overbought reading yet I view that as a bit of noise .
I use the hourly tick along with the others for short term entries yet I watch it .
Overall the market is mixed .
Mercury goes direct today so if this market is going to turn down it must do so
next week or I will abandon my shorter term bearish bias .
PG is NOT a major dow stock mover yet I watch it as an indicator and it is a stock that has gone up and up and up .
Solar Storms :
what I have noticed in regards to solar storms and my own observations is this .
when I see a solar storm I add 39 hours and look for a stronger than normal move to hit the market . More times than not that move is BULLISH !
I use this link : http://www.n3kl.org/sun/noaa.html
the oscillating stuff on the link I have tried to make sense out of and have zero luck finding anything from it . I only look for the Red bars on the KP index and I watch for the word STORM in the upper left side of the page .
They don't hit all that often . I look for the storms near planetary turn dates and like I said prior . More times than not the storms are a Bullish signal so if I am short I usually exit and turn o the long side.
BA
Why would anyone want to position themselves in Boeing at this time ?
I can see a short term trader considering a trade but a longer term position
investor id expect to sit back until the dust settles .
The Feb 25 highs in the dow are the key to my wave count as are the jan 22 lows .
short term trading aside I must view the market as bearish until the feb 25 highs are taken out .
Longer term I see 30,000 cash dow with an extreme to as high as 38,610
Breaking below the dec 2018 lows is extremely bearish and im not expecting those lows to be taken out anytime soon ( My opinion based on my own cycles work )
The year 2016 we saw an inversion which I have not yet figured out .
Aug 13- Sept 6th 2019 is a cycle high as is Dec 2019- Jan 2020 .
there is many cycles coming together calling for lows in the year 2020-2021
and I have not rules out the year 2023.
Bottom line: I appreciate Kerry's work as well as Peter G and I include Peter T
as well .
For those interested in the sunspot cycle .
This guy has been around long enough and I have followed his site for about 17 years .
im posting 2 links because there is a ton of data available .
sunspots : http://www.solen.info/solar/images/cycle24.png
His site : http://www.solen.info/solar/
He is very good at keeping his site data current and there is a lot of historical data available for anyone interested in doing their own work.
Ok..for those who like cycles..riddle me this.. is the 2015 to 2016 flash crash cycle repeating?
2015..2016:
Yearly High..May 20 2015 @ 2134
1st Low..Aug 24 2015 @ 1867 Took 66 trading days
Recovery high..Nov 3 2015 @ 2116 Took 50 trading days..93% retrace
New Low..Feb 11 2016 @ 1810 Took 68 trading days
2018..2019
Yearly High..Sep 21 2018 @ 2940
1st Low..Dec 26 2018 @ 2346 took 66 trading days..WOW!
Recovery high..Mar 21 2019 @ 2860 took 58 trading days..86% retrace
..8 trading days longer..if spx topped
New Low..? Jun 17 2019 If takes 60 trading days..8 days shorter
Key note..spx spent 45 trading days..betwn Nov 3 2015 & Jan 7 2016
..wandering between 2116..& 1985
However..once 1985 support gave way..it took just 24 trading days to drop rapidly..175 points..to new low!
Reminds me..of the range we are seeing between..2860 & 2785..
Imma thinkin once spx drops below 50 & 200 sma..its game ova til new lows..
Hello Charles:
Would you send me an e-mail? Thanks!
Whats ur email Mr Verne
I would like to send you a few charts for you to review.
Thank you,
Max
Hey there Mr Verne..jus emailed ya!
Lemme know how u are doin..U must b cleanin up this week!
🙂
U git my email Verne?..i had an old gmail email i sent u a few yrs ago..
agreed..looks similar to 2015..2016 chart..
also the upper trend from 2015 high and 2016 high is pretty strong..and where Dec 2018 low hit..so lands around 2350 to 2400 depending on time..
and a trend line from 2003 low to 2016 to present also intersects at 2400 line..
so def a number to watch….
thank you joe for that information about what you have seen in regard to storms and planets
https://www.zerohedge.com/news/2019-03-28/first-we-didnt-believe-it-fast-melting-greenland-glacier-starts-growing-again
I have to laugh. Bit of an “I told you so here.”
Peter T
Thanks for the link .
down here on the southern Oregon coast were having our typical rainy season
yet it is also a bit more chilly then usual .
this past winter on the Columbia river was definitely colder than usual .
Charles
I am going to run your idea through my computer and see what your thinking .
I am seeing a smaller version of the decline from oct to dec tracing out yet it is a very minor correlation so not sur what to make of it .
I know your talking spx yet I have Dow data easily available so im going to use it
instead of spx .
Ill post a chart once I run it just to see how close it matches what your saying .
Marie
your welcome
charles
Just checking your dates and so far it makes sense
https://www.timeanddate.com/date/durationresult.html?m1=5&d1=20&y1=2015&m2=02&d2=11&y2=2016
—–
https://www.timeanddate.com/date/dateadded.html?m1=9&d1=21&y1=2018&type=add&ay=&am=&aw=&ad=267&rec=
Charles
I ran it just because and here is what I see .
Im posting a daily chart of the dow with your date ranges along with
a weekly chart I posted last week .
The main date id say is a correlation is the date of may 25th is.
So yea there is something to what your saying yet it would mean a
sideways choppy slow bearish slide before any collapse .
I know you used SPX yet for what its worth I see what your saying.
whether it works out or not remains to be seen .
Note both charts basically say the same thing which is
a Down month of May .
https://imgur.com/bTW6SuM
https://imgur.com/wcMgVft
Thank u Mr Joe..looks very similar IMHO..something bout that period of 2015..reminded me of todays mkt..then went back & saw the correlation.
Could b something..or could b nuttin..
but hey always interestin 2 see..cycles potentially repeatin!
Only..time..will..tell!
Thx 4 lookin more into that Mr Joe!
I remember that period of 2015 VERY WELL..as i made..10 x on Sept deep outta $ puts..
..then wished i had repeated for 2nd bigger drop.. in feb 2016
..dont wanna miss this 2nd drop again..but also time decay is a killa!!!
..i wish i had made more in drop last dec..but vol spiked too quick to repeat 2015.. did very well but no where near 10x..
Lookin at some options 4..June 2019..
..deep outta $ & will run..my variable charts..to find sweet spots..
i like spy & qqq puts..
If we countin..on new low..spy hit 233.76 on dec 26..2018..
qqq hit 143.46..on dec 24..2018..
So..something like..a $243 spy..or qqq $153 might b worth a nibble when time is right..
Could be a 10x.. any1 else got any good ideas?..
Hello Out There…
I trust everyone is doing well.
Not taking any replies as advice – but wondering if I could get your opinions…
My company is offering a 401K / 4% match — I have to sign up this weekend, and I have an option to choose my own allocations….stocks & bond mutual funds, target date funds and specialty funds…for the self directed option it says that the option is recommended for experienced investors, which I am not. I do follow Peter’s blog and I’m wondering if I should contribute at all at this time, but rather hold on to the cash — but I hate to give up a company match of 4% if I can do this and stay safe — keep my money from disappearing – does anyone have any opinions that they would share with me…
I take seriously Peter’s warning regarding investing — I don’t want to lose anything…
In advance thank you for reading my post.
Did not. Peter T can send you my current one.
U can also email me at..my name..777..@yahoo.
Thx Mr Verne
Charles, I just sent Verne’s address to you, but your email bounced back.
Jfrey
I’d go for it and take the match but I’ll assume
They will only match to a certain. Percent or dollar amount .
Also I’d say have them put it in cash and tell them your working
On the allocation and need time.
Not sure what a 4% match comes out to .
Many Thanks, Joe Longwill — appreciate you taking your time to reply to my post.
I like the ‘put it in cash’ while I work it out.
It’s all pretty confusing to me…but if I can select ‘commodities’ I’ve been told that should be a winning ticket. Problem is I have to get through the registration before I can see what is available if I make the selections myself. My contribution is 100% vested so to me if I don’t do it, I’m giving up free money…
Thanks again for your opinion.
A new weekend post is live at: https://worldcyclesinstitute.com/elliott-wave-and-central-banks/
This website is for educational purposes relating to Elliott Wave, natural cycles, and the Quantum Revolution (Great Awakening). I welcome questions or comments about any of these subjects. Due to a heavy schedule, I may not have the time to answer questions that relate to my area of expertise.
I reserve the right to remove any comment that is deemed negative, is unhelpful, or off-topic. Such comments may be removed.
Want to comment? You need to be logged in to comment. You can register here.