
 Fear Lurks Beneath the Surface
The good news is that the B wave in the SP500 is just about done. This fourth wave down late in the week foreshadows a big drop to come.
The waves up in ES/SPX are corrective and showing rather dramatic signs of coming to an end.
The wave structure of both the SP500 and the NDX has become quite complex and my analysis each night seems to take much longer to complete.
I had thought that when I started this weekend’s analysis, I’d be left with more questions than answers, but it turned out to be the opposite. It took some work, though.
This has led to a complete review of the higher degree wave structures of both these indices NDX/SP500). They’re aligned, but the structures are slightly different in that the SP500 is tracing out a flat as part of a corrective wave up from 2009, while the NDX is finishing an impulsive sequence. They will end at the same time.
We now seem to be at an important juncture. Once we get a small 5th wave up from the current interim low, it will finish off the last third wave for both indices. That means we have only fours and fives left to finish off each final sequence and that, in turn, means we have volatility ahead to complete the final topping process.
Whether we get finished before or after Christmas is a bit of a “crap shoot.” In any event, the top is very close.
______________________________
This Week’s Chart Show
In this week’s Chart Show, I’ll go through the longer term prediction for both NDX and the SP500 and give you a detailed route to the top. The charts have been slightly revised, measured, and give a clear picture from 2009 to today, with a measured projection for the highs.
You’ll get a clear view of where we’re going from here and a rough timeframe for the top.
Spoiler: This 500 year rally is coming to an end relatively soon. For the complete story, log into the Chart Show on Wednesday evening (links at the bottom of this post).
Stay tuned!
__________________________
Elliott Wave Basics
There are two types of Elliott wave patterns:
- Motive (or impulsive waves) which are “trend” waves.
- Corrective waves, which are “counter trend” waves.
Motive waves contain five distinct waves that move the market forward in a trend. Counter trend waves are in 3 waves and simply correct the trend.
All these patterns move at what we call multiple degrees of trend (in other words, the market is fractal, meaning there are smaller series of waves that move in the same patterns within the larger patterns). The keys to analyzing Elliott waves is being able to recognize the patterns and the “degree” of trend (or countertrend) that you’re working within.
Impulsive (motive) waves move in very distinct and reliable patterns of five waves. Subwaves of motive waves measure out to specific lengths (fibonacci ratios) very accurately. Motive waves are the easiest waves to trade. You find them in a trending market.
Waves 1, 3, and 5 of a motive wave pattern each contain 5 impulsive subwaves. Waves 2 and 4 are countertrend waves and move in 3 waves.
Countertrend waves move in 3 waves and always retrace to their start eventually. Counrtertrend (corrective waves) are typically in patterns — for example, a triangle, flat, or zigzag. Waves within those patterns can be difficult to predict, but the patterns themselves are very predictable.
Fibonacci ratios run all through the market. They determine the lengths of waves and provide entry and exit points. These measurements are really accurate in trending markets, but more difficult to identify in corrective markets (we’ve been in a corrective market in all the asset classes I cover since 2009).
To use Elliott wave analysis accurately, you must be able to recognize the difference between a trend wave (motive) and a countertrend wave (corrective). There’s very much more to proper Elliott wave analysis, but this gives you the basics.
____________________________
Registration for Commenting
Want to comment? You need to be logged in to comment. You can register here.
If you register, it protects your information. It also allows you to comment without filling in your information each time. Once you’re registered, simply go to the home page and click on the login link top right in order to log yourself in. Usually, you’ll be logged in for several days before needing to be logged in again.
______________________________
Problem receiving blog comment emails? Try whitelisting the address. More info.
______________________________
Get an upper hand … JC 2
Get an upper hand in trading …Seeing all the different currency pairs and the wave structures and hearing you explain why this has to do that on a nightly bases gives one a upper hand when trading. Elliott Wave applies to all stock and indices and can be applied to any candlestick chart. If someone ask what you want for Christmas – Tell them a membership to Peter’s “Traders Gold!”—JC |
Couldn’t be happier … KK 2
Couldn’t be happier …The analysis and insight you provide is simply amazing! I’ve been trading the futures and equity markets for well over thirty years and usually average around 5% monthly. Since joining your Traders Gold Service two months ago, that number has better than doubled. I couldn’t be happier.—KK |
Tops in your field DZ 2
Tops in your field …You are tops in your field. Tried to follow Elliot Wave international for years. They were always behind the market. After discovering you, I perceive that you are an expert in reading the waves, which puts you way ahead of the rest of your peers. And you can read the Waves like you are reading tomorrow’s financial section. I pray you stay healthy. —DZ |
the real deal SM 2
The real deal …‘Educational, insightful and thorough market analysis for all levels of traders. It’s Elliott Wave at its best….Peter Temple is the real deal’ —SM |
The best of them JL 2
The best of them …Last couple of years, I subscribed to several ‘market traders’. You are by far the best of them and the personal contact is awesome. Daily and daily updates are very well written! Besides your expertise in EW, I also like your cycles analysis. Best investment I ever made! —JL |
Rise above the rest … SM 2
Rise above the rest …I have only ever met a few people who, in their chosen fields (astrology, medicine, music, martial arts, technical analysis), rise above all the rest and you are one of them…you have ‘the gift’…and that’s why I’m a Trader’s Gold member. —SM |
Have not had a losing week RW 2
Have not had a losing week …I have been with Peter almost a year. The only thing that matters is have I made money with his service. I think I have finally turned the corner using Peter’s EW. I have not had a losing week in the last 5 months. Thanks Peter, for your amazing amount of hard work. —RW |
A true expert in Elliott Wave FL 2
A true expert in Elliott Wave …You are a true expert in EW analysis. What you provide is not available anywhere and is priceless. Subscription on your services is the best thing I have ever done. Many thanks for your effort to make me a better investor. I now have more trust in my investment decisions. I hope you will continue the excellent work! —FL |
The Market This Week
Here's the latest daily chart of ES (emini futures)
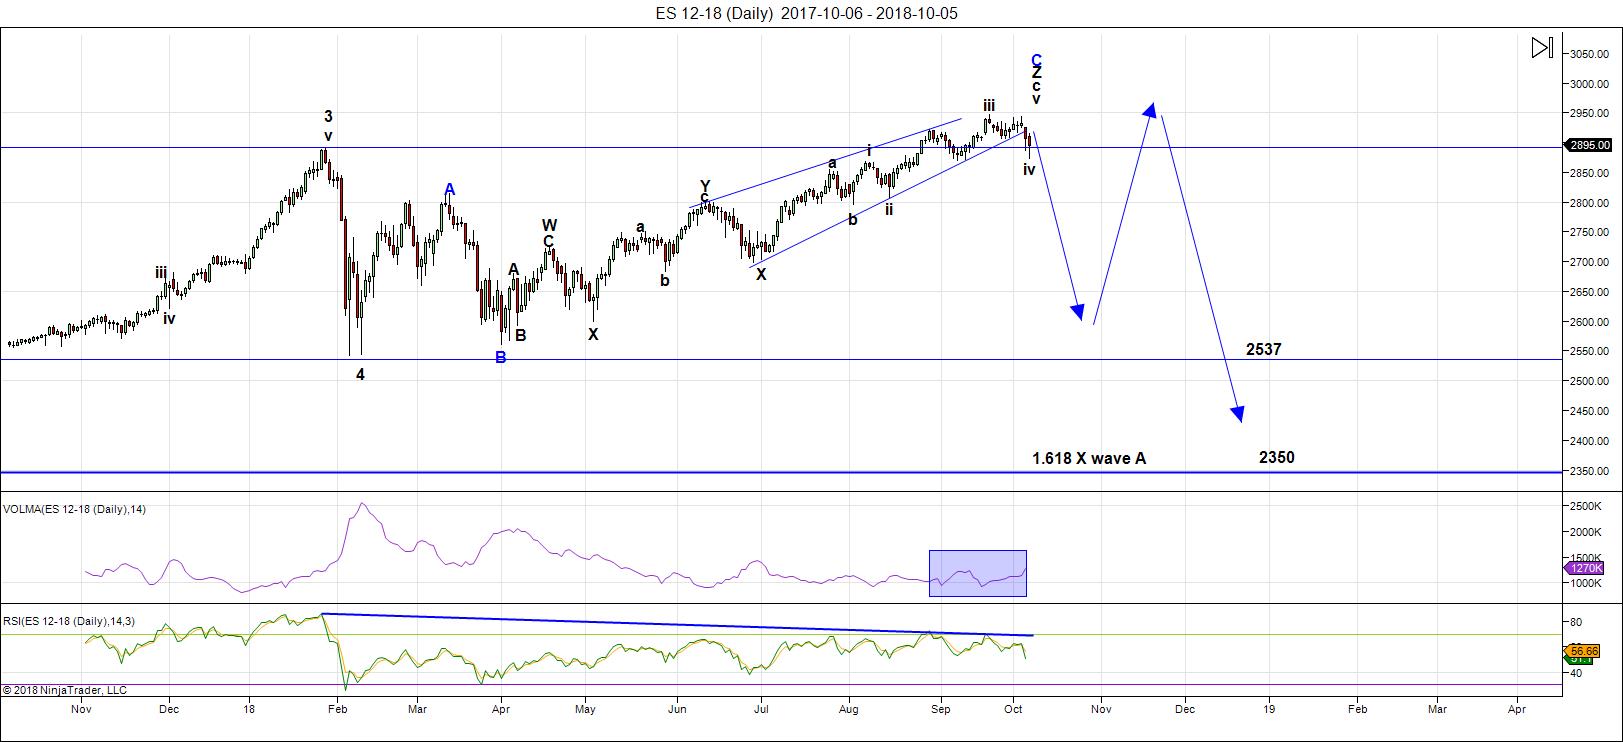
Above is the daily chart of ES (click to enlarge, as with any of my charts).
On Thursday we had a large drop and Friday confirmed a fourth wave in both ES and NQ. That drop didn't necessarily negate the ending expanding diagonal (which seems to have ended a small third wave up), but it did destroy the small ending diagonal that was forming as a fifth wave. The drop seems to have been the result of a failed small 5th wave, which will require a new small fifth wave high.
Ending diagonals can end 3rd waves, 5th waves, and C waves.
Back up we go to a new high.
In terms of the bigger picture, my preference for the resolution of this very large B wave that we've been locked in since the low in February is for a C wave down after we reach that new high. This is the pattern of a expanded flat. However, technically, it could also be a running flat. At the present time, the B wave (that's the ABC wave up from about 2532) is longer than the A wave (marked as the 4th wave down from January 29, 2018). A regular flat registers as an expanded flat when the B wave is over 105% of the length of the A wave—ie, the B wave would need to reach above 2889, which is has done.
That means that the ES/SPX has multiple possibilities as to a target on the downside. Accuracy (in determining the most probable target) is going to depend upon both counting and measuring the waves to the downside. It's impossible to pick a downside target at this point in the process.
If we select all of wave 4 (on the chart—down from January 29) as the "A wave," then we're looking at an expanded flat. In that case, this outcome is the most probable:
- the C wave of a flat is typically 100 - 165% of the length of the A wave (so the target would be from 2532 - approx. 2360) - preliminary targets
There are other options:
- a running flat would trace out a C wave that is NOT longer than the A wave (in other words, it would not go to a new low). I regard this option as very low probability because it's extremely rare (I've only ever seen one of them). However, if NDX is tracing out a final impulsive pattern, its fourth wave should not be very deep, which may also restrict the length of the C wave in the SP500.
Volume: flat, and very low.
Summary: We're waiting for a top in a B wave, which will result in a C wave to a new low. My preference is the larger structure (from January 29) represents an expanded flat. Once the c wave (down) is complete, expect a final fifth wave to a new high. That fifth wave up to a new high will be the end of the 500 year bull market.
___________________________
Trader's Gold Subscribers get a comprehensive view of the market, including hourly (and even smaller timeframes, when appropriate) on a daily basis. They also receive updates through the comments area. I provide only the daily timeframe for the free blog, as a "snapshot" of where the market currently trades and the next move on a weekly basis.
______________________________________
Sign up for: The Chart Show
Next Date: Wednesday, October 17 at 5:00 pm EST (US market time)

The Chart Show is a one hour webinar in which Peter Temple provides the Elliott Wave analysis in real time for the US market, gold, silver, oil, major USD currency pairs, and more. You won't find a more accurate or comprehensive market prediction anywhere for this price.
Get caught up on the market from an Elliott Wave perspective. You’ll also get Andy Pancholi cycle turn dates for the SP500 for the balance of the current month. There’ll be a Q&A session during and at the end of the webinar and the possibility (depending on time) of taking requests.
All registrants will receive the video playback of the webinar, so even if you miss it, you’ll be sent the full video replay within about an hour of its conclusion.


Thanks again for sharing your work, Peter.
Thanks Peter!
I have to say I am going to be quite surprised to see a new SPX high with all the bearish reversal signals I am seeing in so many indices and across so many time frames.
Let’s all crash the Chart Show this week people and support the efforts of our resident expert
I want the very best plan relieving the crafty banksters of as much of their capital as possible! 😁😁😁😁
Brexit all over again. I’m already getting the usual flack from calling a flat. I get used to it.
“flak” I think is the correct spelling …
Thanks Peter.
How confident are you that we hit a new high and not go down to you C wave low. Is there a time frame in which it will happen may be in 2 weeks we reach a high.
Bill,
I don’t understand the grammar in this question. You can tell for yourself whether we hit a new high or not … you’ve lost me.
All will be disclosed at the Chart Show this week.
If there is anyone I know who can credibly make the case for a new high, it’s Peter T. For some of us trading monster lots, getting that right can make a six figure difference so you cannot afford to get it wrong!!
See ya at the show!!! 😜
I think Bill was thinking that we were already in the C wave down and was headed for those downside targets without making any new highs. I was of the same opinion until I saw your comment that we were not quite done. One of my own pivot indicators ( in this case the 2900 pivot) was busted last Thursday and then proved resistance after a brief re-test and that kind of price action around pivots has in the past been a good sign that price would continue to fall away from the pivot after a fail to re-capture it. Of course that could still happen next week and would be the first confirmation that new highs could be a possibility.
Good morning everybody!
I will be exiting remaining short positions at the open and holding my VIX 15 strike puts. New highs or no, I am expecting at the very least a bounce, even if it is a dead cat one, after we put in a new low.
Bonds are in a bear market! Wow!
I thought TLT would resume its march higher but I am sure glad I did not take that trade!
Verne – I would not buy the popular narrative on bonds. Right before 1987, 2000 and 2007 peaks, thats the exactly what big banks were talking about. 3.28 was an important pivot for 30y rate. Another more important one is coming up (3.48). I have been building up my bond position for a few months and am adding the biggest pieces right now. Yields will top out before equities do. I am expecting a reversal in TLT before the end of this month.
The final wave down in Gold is underway. I am glad I waited to exit my bear call spreads as we had a few head fakes the last few weeks. Commodity fifth waves are unmistakable. I think a huge opportunity to trade the metals and miners long is just around the corner! I am hoping for a detailed update at the Chart Show!
Where is Charles Lloyd? His absence has coincided with a drop in the market. Hmmmmmmmm
Here is hoping he booked quick profits on those counter-trend trades, which admittedly , he called quite nicely!
It is quite remarkable how frequently wide-spread bullishness can truly serve as a contrary indicator!
Sorry ive been mia. Been working on a new trading algo..the buy the dip is not as easy as it was prior to the Dow topping and n100 new high..so i had to go back to the tool box to reconfigure my trading to go both ways. Ive been backtesting and changing settings..reprogramming..testing live. Good news is..imma ready to get back to action! Lotsa intraday moves and I wanna capture more profits.
Took the money and ran like my hair was on fire. Sold VXX 27.50 calls, DIA 268 puts, and SPY 289 puts at the open. Holding VIX 15 strike puts. We should get another great entry just ahead. The red line for me remains SPX 2900. As long as we stay below it, I will be backing up the truck for reload on each and every bounce. Still short RUT via TZA 9.50 calls. Lock and Load!!!
There is something truly ominous going on in the markets and I am wondering if anyone else is noticing what is going on. I trade fairly big lots and would rarely see the lot size split up on either the buy or sell side. I am not commonly seeing lot sizes broken up, especially on the sell side and this is really staring to irk me. Have you ever tried to sell 100 contracts and see your order filled in some cases literally one contract at a time? This is completely nuts and tells me that market liquidity is a HUGE problem. In fact this is what I have always been afraid of, and that when this market really starts to implode that bids are going to simply disappear. I am really not sure what can be done about this but I suspect few people are going to be prepared for this.
I meant to say NOW currently seeing lot sizes split…
Here we go! Dead cat bounce? Or on to new highs per Peter T’s expectations of a final fifth up? Above SPX 2900 and I would have to concur with the latter scenario. I cannot bring myself to go outright long this market so will trade any move above the 2900 pivot with bull put credit spreads. I am expecting puts to become virtually impossible to buy due to blown out spreads once the beast turns….!
I’m using Peters scenario as a baseline. I expect a bottom this week and hopefully a rapid surge to around 3000 S&P after which the fun to the downside begins
We did not get a new low today so something’s not quite right about this bounce. I think it really stinks!
It looks like we have yet another triangle underway. Triangles and EDs are what you get when an impending trend change is being vigorously opposed.
When triangles appear, you know the end is near!
They offer some of the very best trades set-ups and are one of my favorite patterns to trade as they are SO predictable!
Could be a fourth wave with a new low coming up. That I would not mind trading long for a bounce. That’s more like it! :}
looking for TZA to clear 10.00 before we get a real bounce when I could reload the clip. Lots of pent-up energy in all the leveraged short instruments. It is clear from their tepid performance so far we are not yet seeing any concern about this market.
Selling SPY 288/289 bear call credit spread expiring today for 0.30
If bounce commences later today will close short 288 leg and ride long position on any meaningful bounce. If not I just keep the premium thank you kindly!
Market internals are deteriorating dramatically already. I had covered half my short and now really need the bounce to reload. I won’t be happy if this market continues lower from here. In terms of liquidity – it makes complete sense for bids to disappear. Markets top when there are very few buyers left out there.
New low.
Now we can talk about either new highs or a dead cat bounce.
It really does not matter that much which we get. A great shorting opportunity just ahead. Looking for VIX confirmation that we have an interim bottom with a big red candle.
SPX has broken the wave “B” trend line now. A lot of the momentum names (SQ, PYPL, ADBE etc) all breaking their trend lines. This market is toast. I do not focus too much on intraday moves, but I do need a bounce to go back to my full size short. Get ready to see the bond market come back with a vengeance. I bought more TLT today.
Market internal deterioration did not only just begin.
It has been going on for WEEKS!!!!!
Buying back short SPY 288 calls and holding long 289 at zero cost basis.
Agree – Internals have been deteriorating for weeks. I should have stated that the “leadership of the market is deteriorating now”. Now lets see how far the bounce gets
I am going to be watching this bounce with very keen interest indeed.
I frankly am not expecting it to reclaim the 2090 support shelf. The technical damage done to this market has been substantial. I don’t think people actually realize the current decline is occurring in a context of broken market internals with the advance of recent weeks coming on razor thing market breadth. Not the stuff of which sustained moves higher are made.
It is clear t me that the passive ETFs have NOT begun to sell. When they do the leveraged short ETF are gong to absolutely explode. It is amazing that despite the unfolding carnage they have hardly moved. Wow!
Sold TZA calls on last move down. I know I got robbed as they should have gone for a LOT more but no worries. A bounce coming up and a chance to reload at cheaper prices!
Vivek,
How far out do you buy your strikes?
Bill – I end up just shorting SPY (and other ETFs) or e-mini. I do end up doing some options, but they are much smaller in size.
For treasuries, I buy TLT and I buy some individual cusips in new auctions.
Yields have broken out of a very long held downward channel and it sure does looks as if they are going higher. If that is the case a long TLT trade is going to be a looser….
The long trendline (since 1980s) is a lot more applicable to a 5y5y treasury forward rate than the spot 5y or 10y or 30y rate. It coincides very well with the 30y rate. I have seen people use spot yields for trend and elliot rules and thats one of the reasons the analysis comes up short. If yields have indeed broken out of the 40y old trendline, then time is up for every asset in this country. No matter what you hold, will be worth less than 20% of its current value. I just do not see the time for that move yet. That happens in 3 of 3, not right now. For my analysis to be right, yields cannot sell off more than 14 bps further than here. Thats about 2.5% on TLT. Thats all I am risking. And I expect the reversal to happen mid month. Ideally yields close unchanged for October.
I am still seeing VIX and VXX bull flags.
Looks like we are not quite done.
I wonder how the BTF dippers are faring these days….He!He!
The next pivot area the bears need to challenge is the former 2860- 2865 resistance/support region. One reason I have doubts that this move down is the real deal is that the initial impulse down really needs to demolish MULTIPLE support/resistance pivots. We simply did not see that happen on this recent decline, although it was significant.
What we have seen since the DJIA made a new all-time high on October 3 has been truly remarkable. Don’t know how many of you are acquainted with the construction of the TRIN or Arms Index, but it is a ratio of two ratios. Divide the ratio of up and down stocks on NYSE by the ratio of up and down volume. It tells us whether more volume is coming in on up or down issues on a relative basis. A reading above 1.00 means that there is more volume on down stocks than up stocks on the basis of advancing and declining issues and when investors start to feel some fear about prices, that ratio will normally start expanding above 1.00. Mark this and mark it well! An hourly chart of TRIN shows that there has not been even a single hour of trading since the DJIA made its all time high where TRIN has been over 1.00. Theoretically, at least, that tells us there is absolutely no fear about this decline and it is just another buy the dip opportunity.
Joe (I think he’s the one) has written about TRIN before in terms of its moving averages. Usually, in a decline of any significance in a bull market, the 10d MA of TRIN will get to 1.30 or higher as a bottom is reached. Friday’s 10d MA was 0.93. Today as I write this, The single-day TRIN is a remarkably low 0.58, again an indication that the dip is being bought with both hands in anticipation of sharply rising prices once again to the point where if the market closed here, the 10 d MA of TRIN would go back down to 0.87, more closely associated with a top than a bottom. No guarantees here, obviously, simply a recitation of a useful technical indicator and its typical history
This buying in the DJIA is irrational in the extreme when you looks at what is going on in the other indices. I am looking for another short entry here as I suspect it will play catch up to the downside.
I scaled back into short positions today as ViX not indicating we have an interim bottom. Still hedging with VIX 15 strike puts just in case we get a bankster ambush overnight, lol!
Sorry fellas..I havent had as much time to provide input here..ive been in the trading lab..reconfiguring my scalping..had to back test..study..reconstruct..test live..now its looking good. When you there wuz an up wave its easy to make money buying the dips..now the real fun begins with more intraday swings.. i went short at beginning of day..then switched to long in afternoon..seems to be a better approach given that top of B is near..
Vivek, I am conflicted on the matter of rates. I used to be cock-sure there was no way they could continue to rise in the coming deflationary depression. I am starting to re-think that thesis because of the possible impact of global defaults of dollar-denominated debt. I think this is the potential “Black Swan” many are over-looking as the conventional wisdom is that higher rates must be accompanied by inflationary pressure.
That concern makes complete sense for credit risk, but not for interest rate risk. In that move, you will see credit spreads widening quickly. We are seeing that right now with Italian bonds for example. We saw that in Greece… That environment leads to funds flowing into treasuries. Right now, treasuries rates are rising on days of good US data. That is the most telling sign. If treasury yields start rising on days of bad US data, thats when a black swan event becomes more likely. I loaded the boat on TLT 115 calls yesterday. Lets see how that plays out.
Peter G,
Thank You for your input. You seem to think that these TRIN readings are perhaps more telling than in the past. Is there a specific reason or two that makes you believe that? I believe the A/D Line is finally divergent with price. Any comments would be appreciated.
I bought back my DIA 265 puts I sold for 3.10 yesterday for 1.62, thanks to the giddy BTF dippers.
Hopefully they will fetch another double at the open. The long shadows on candles that used to so reliably signal market reversals are no longer doing so. It is really amusing that the BTF dippers yet have to figure this out and keep throwing their money at market declines, and for that we do kindly thank them!
How long before the sleepy herd awakes to the market paradigm shift?
Sold DIA 265 puts for 2.33.
Still holding VIX 15.00 strike puts and TZA calls.
Let’s see how things close today. If we don’t get some kind of bounce, Katy bar the door!!
Based on VIX price action, I think we are completing the fifth wave of an impulse down today. Odds are we see a bounce imho…
Then again, it could be a second wave already underway…not sure….
This market keeps failing. I was able to reset 25% more of my short on a bounce to 2900. Setting trailing stop at 2910 now. This is starting to look like a waterfall decline with wave “3” down yet to arrive.
Yep. 2900 now seems to be acting as resistance.
Exited half SLV bear call spreads today.
VIX hedging 15 strike puts will expire worthless tomorrow.
Looks to me like vol consolidating ahead of an upwards break.
Chart Show tomorrow should be most interesting! See y’all there!
PETER G
PLEASE PARDON THE ALL CAPS. I SPILLED COFFEE ON THIS LAPTOP AND THE CAP LOCKS STUCK ON . IN REFERENCE TO THE $TRIN I HAVE SEVERAL RULES TO NOTE.
THE 10 DAY SIMPLE MOVING AVERAGE OF THE DAILY CLOSING NUMBER.
A CLOSE BELOW 1.00 IMPLIES AND OVERBOUGHT READING ( IT CAN GO BELOW .90 )
A CLOSING BELOW 1.00 ON THE 10 DAY MOVING AVERAGE FOLLOWED BY A CLOSE BACK ABOVE 1.00 GIVES A SELL SIGNAL .
THAT SELL SIGNAL REMAINS IN EFFECT UNLESS YOU GET A CLOSE BACK BELOW 1.00 . IT IS NOT A PERFECT INDICATOR BY ANY MEANS YET IT IS INSIGHTFUL .
I ALSO LOOK FOR A MOVE ABOVE 1.30 YET MY LEVEL IS ACTUALLY 1.40
S CLOSE ABOVE 1.40 SIGNALS THE OVERSOLD READING AND A CLOSE BACK BELOW 1.40 GIVES THE BUYS SIGNAL .
FURTHER NOTE : I ALSO LOOK AT THE 5 DAY SIMPLE MOVING AVERAGE ON THE DAILY TRIN CLOSES .
THE 5 DAY TRIN SUM IS VERY SIMPLE .
YOU ADD UP THE 5 PREVIOUS CLOSING NUMBERS ON THE DAILY TRIN .
THIS IS A VERY SHORT TERM INDICATOR .
A 5 DAY TRIN SUM AT 4.00 IS AN OVERBOUGHT READING AND IT DOES NOT SHOW UP ALL THAT OFTEN.
BACK TO THE 10 DAY MOVING AVERAGE ON THE DAILY TRIN .
BY MY DATA ON SEPT 24 2018 THE 10 DAY MOVING AVERAGE CLOSED AT .786 WHICH IS A FAIRLY EXTREME OVERBOUGHT READING . ON OCT 3 THIS AVERAGE CLOSED AT .926 WHICH FAILED TO GIVE A SELL SIGNAL DESPITE THIS CURRENT SELL OFF.
ON OCT 8TH THIS AVERAGE CLOSED AT .851 AND IT IS BEGINNING TO RISE YET IT HAS NOT GIVEN A SELL SIGNAL AND CLOSED YESTERDAY AT .88
I AGREE WITH YOU THAT BASED ON THE DAILY TRIN THE MARKET IS MORE OVERBOUGHT THEN OVERSOLD
ANOTHER THING PEOPLE DON’T LOOK AT IS THE SPX/VIX WHICH HAS NEVER
CONFIRMED THESE HIGHS .
THAT SAID
THE 5 DAY ADV DECLINE LINE GOT A BIT OVERSOLD ON OCT 5TH YET THE 10 DAY
ADV DECLINE LINE WAS ONLY MARGINALLY OVERSOLD ON OCT 5TH.
SINCE THEN THEY HAVE BOTH TURNED UP .
THE 30 DAY ADV DECLINE LINE IS WORTH LOOKING AT THOUGH .
COMBINING IT ALL TOGETHER GIVES A MIXED PICTURE .
27 November 2018 SUN MERC CONJUNCT THE SIGNAL
29 January 2019 SUN MERC CONJUNCT THE SIGNAL
——————————————————————–
26 October 2018 SUN VENUS CONJUNCT THE SIGNAL
===========================================
15 October 2018 MERCURY VENUS CONJUNCTION START POINT
OCT 16 1ST QTR MOON
OCT 24TH FULL MOON
NOV 29 3RD QTR MOON
NOV 7 NEW MOON ( MARS URANUS TURN )
WEB BASED DATA FOR PLANET DATES , NOT FROM MY SPREAD SHEET .
MY WORK ARGUES WE ARE ENTERING THE START POINT OF A VENUS
BULL MARKET CYCLE WITH IN THE NEXT WEEK .
WE ARE STILL IN A MARS URANUS BEARISH CYCLE UNTIL JAN 20 TH 2019.
IM NOW ENDING MY BEARISH BIAS ON THE OVERALL STOCK INDEX’S
IM OFFICIALLY NEUTRAL AND WILL LOOK TO ADD STOCK POSITIONS
BETWEEN NOW AND JAN 20TH 2019.
THE TIME PERIOD BETWEEN NOV 7TH TO JAN 16 HAS TRADITIONALLY BEEN BULLISH YET THIS YEAR IM QUESTIONING THAT STATISTIC . MY PREFERENCE
IS THAT THE STOCK INDEX’S DECLINE FROM NOV 7 INTO JAN 20TH.
THAT SAID, MY STOCK PURCHASES BETWEEN NOW AND JANUARY WILL BE HIGHLY SELECTIVE AND RELATIVELY FEW.
SORRY FOR THE CAPS AS NOTED ABOVE .
JOE
SPX has now left the support trend line of wave “B” behind. DOW is the only major index that is still above the wave “B” trend line. My target for this decline is either 2792 (previous resistance) OR much lower as Peter T has mentioned. Either way, it should be all over before Oct 25th.
cash Dow at 26158 $tick at minus 800
im expecting a momentum low right here.
25700 is the next downside below .momentum low does not mean bottom.
no change to my post above
Exiting great short trades on SPY puts, TZA calls, VXX calls.
The bearish signs in this market were unmistakable. I hope everyone traded the down-draft profitably.
out of a short term bearish trade this morning at 26060
looking for a bullish trade at 25700
I am still at 75% short. I have no signal to believe that the sell off is done. I will cover some close to previous resistance (just below 2800). But from a wave perspective, I have no reason to cover at these prices.
I covered 25% of my short as SPX wave 3 down hit 3.618 fib extension of wave 1. Still think we get to 2792 – 2805 area in the next few days
Looking like we are almost to SIR PETERS C wave target..2790. Great call SIR PETER! Many thank yous..hopefully that’s the bottom..then back up to new highs. Glad I took profits and had a few shorts on.
I am covering my shorts at the close today. I had mentioned a couple of weeks ago that we are likely to have a 3-4% down day just like 2006 – looks like this was that day. I am not sure if we will decline through 2790 level. If we do, it will be Peter T’s favored outcome. But I am taking my money here. It has not been easy making money on the short side.
We are officially in SIR PETERS C wave!!! Below 2790
Hi Peter T,
Is there any update to your views, I though we will see a new high before wave B is complete and head down for wave C (which might end at 2532 or 2360).
Hi Bill,
I provide that information in the Chart Show, but I’m restricted in the free blog. Sorry.
Absolutely monster trades today. Wow!!!
SPX 288 10/10/ 18puts picked up for 1.23 yesterday went for over 12.00 before it was all over. My very best one day gain ever!!
BOO-YAH!!!!
Peter T – I am busy on Wednesdays during your Chart Show hour. Can I sign up and see a replay ?
Absolutely! I think you get sent the replay automatically, but if you don’t get it almost right away, let me know and I’ll send you a link asap.
How did the US bond market do today ?
Did we get any flight to ” safety ” ?
How about the US dollar index ?
Was there any flight to safety anywhere ?
Other than cash I mean
New Moon
The moon is currently in Scorpio
The moon is 0 days old
Bond markets did not respond till SPX broke 2800. Since then, it has been all FTQ. 10y yields are now 10 bps from the yield high and falling. My TLT 115 calls will come to save me tomorrow now that I have covered my outright shorts.
This website is for educational purposes relating to Elliott Wave, natural cycles, and the Quantum Revolution (Great Awakening). I welcome questions or comments about any of these subjects. Due to a heavy schedule, I may not have the time to answer questions that relate to my area of expertise.
I reserve the right to remove any comment that is deemed negative, is unhelpful, or off-topic. Such comments may be removed.
Want to comment? You need to be logged in to comment. You can register here.