
Update Friday morning, March 11, Before the Open
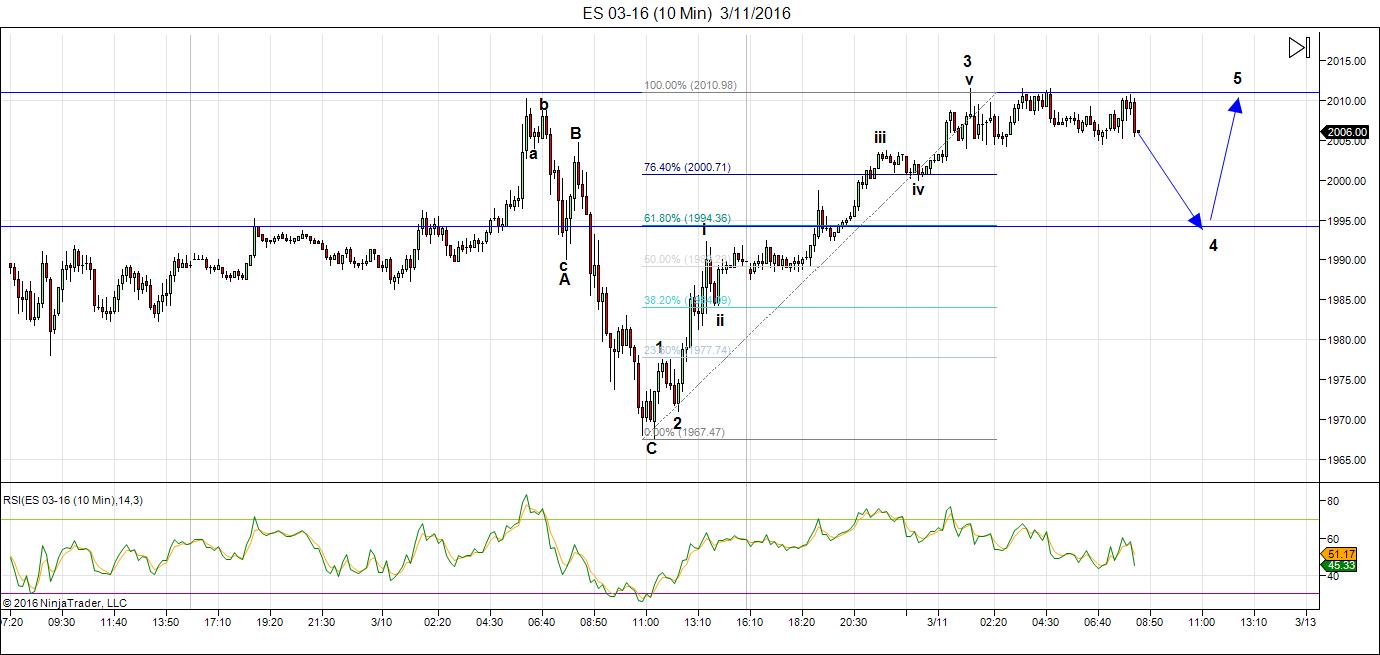
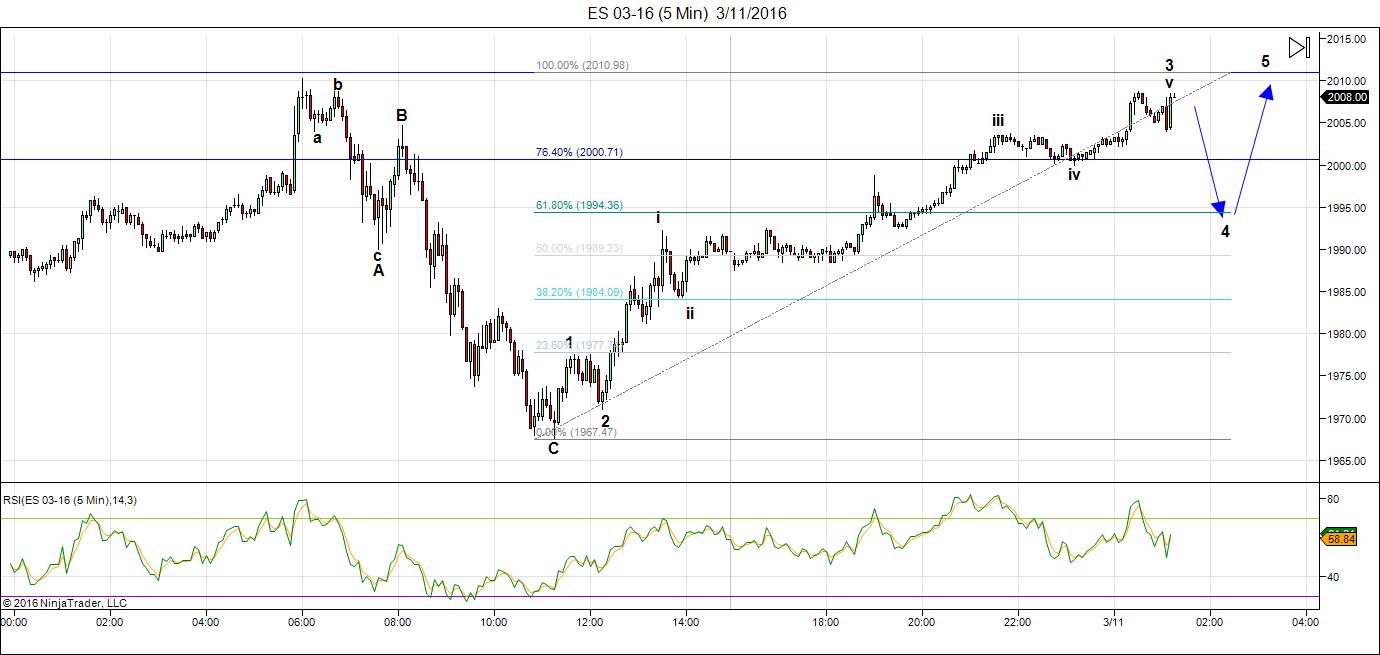
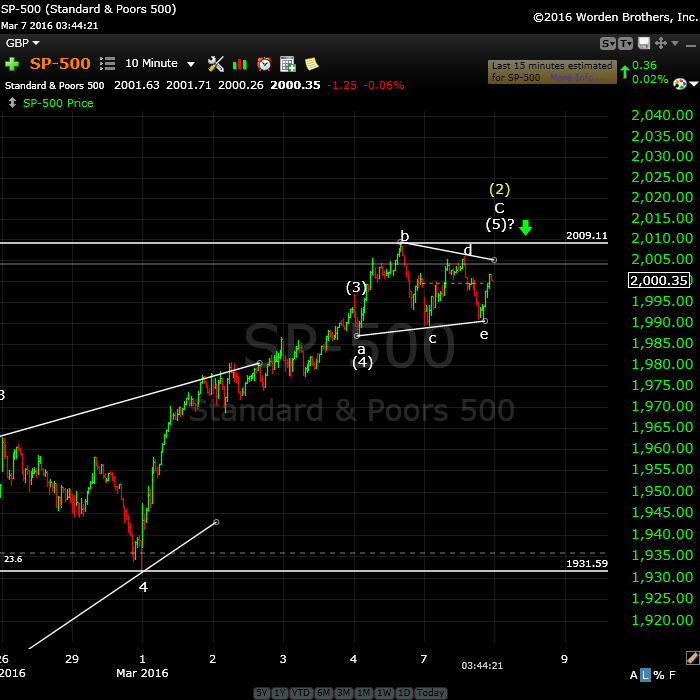
So here we are with a double top (what I’ve been whining about) in ES. This is the 60 min chart of ES (SPX futures). This now looks like a complete wave up to me, although I think we still need a fourth and fifth. It’s hard to say because often a last wave just gets shorter and shorter towards the top. The chart below will show what expect in the case that we’re not quite done yet.
Now, all the futures and major indices will need to top this morning before we head down. If you’re looking for a preferred entry point, lower on the page is an explanation of what that looks like. We could head down today or Monday.
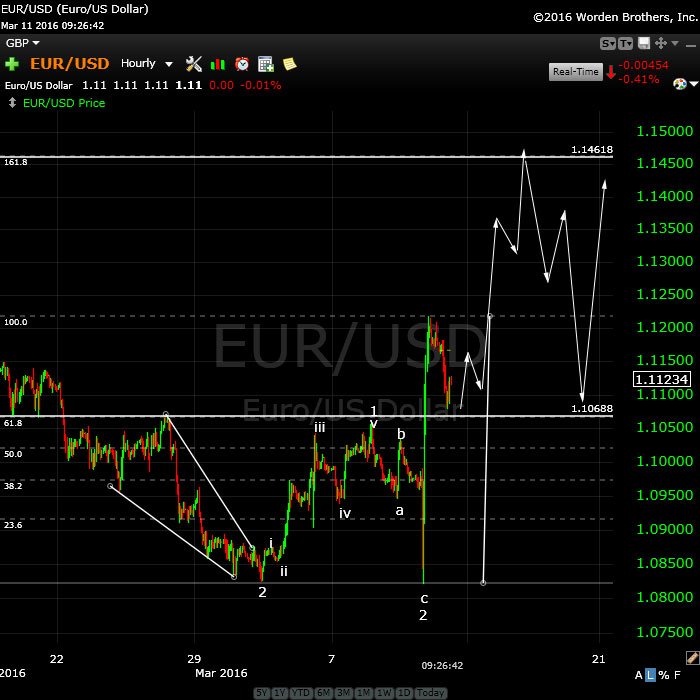
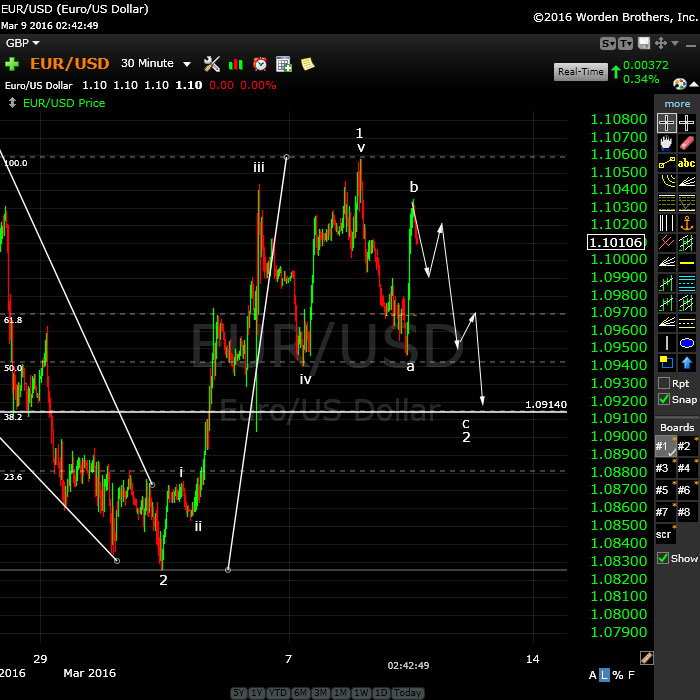
EURUSD is poised to head up. As I mentioned yesterday, it had not finished the current first wave up. It has now retraced 38%, so it’s heading into a fifth wave (of a typical first wave) This should send equities down, but only a little ways (fourth wave), then EURUSD should do a second wave (while equities do a small fifth?). Finally EURUSD will turn up into the third of the third (the “nowhere to hide” wave, cause it will shoot straight up—and by extension, equities straight down.
This chart was put together quite quickly, so I haven’t had time to properly label it.
The above explanation supports a fourth and fifth wave (today and Sunday) before the big drop starts on Monday.
__________________________
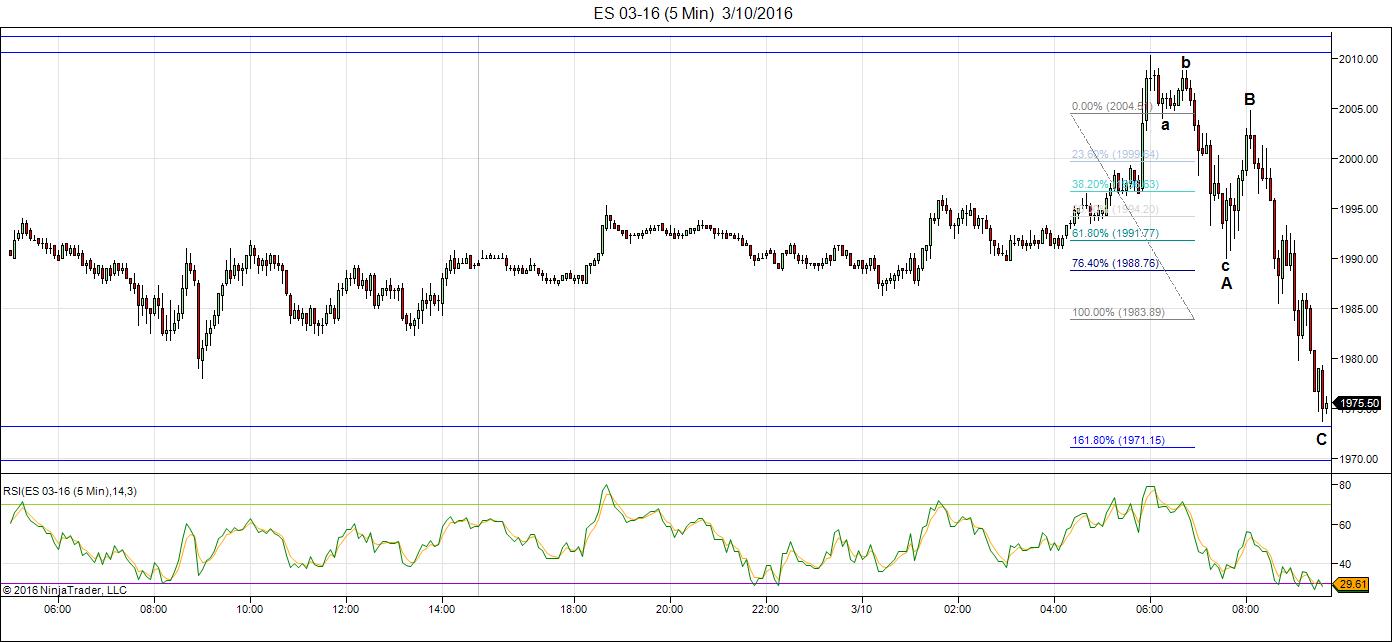
Update Thursday night, March 10, 3AM EST
Here’s a look tonight at the ES 60 minute chart. The market continues to roll along to my tune. Tonight we appear to have completed the third wave of the 5th up. It’s an extended wave and it’s projecting a top either Friday or Monday (my preference is Monday). We have a fourth wave down to do and then a final fifth to a top. This is the fifth of the fifth so should mark the end of the advance.
_______________________
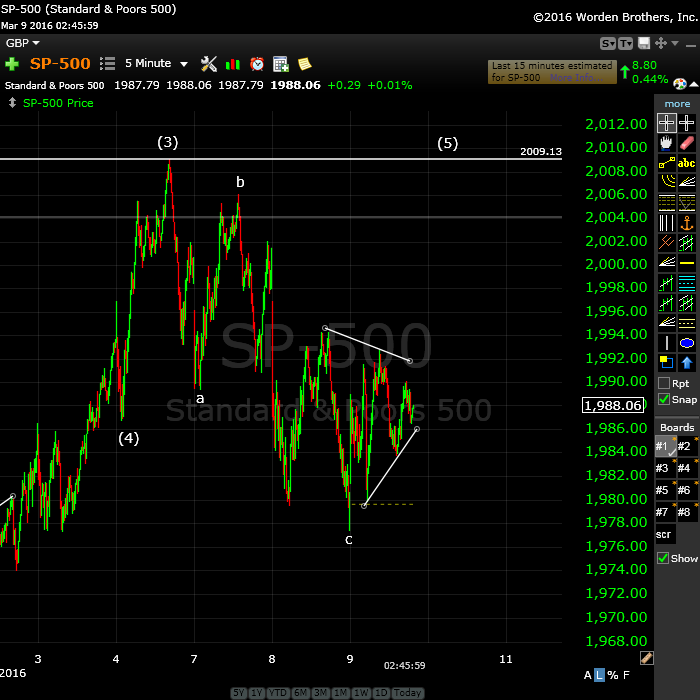
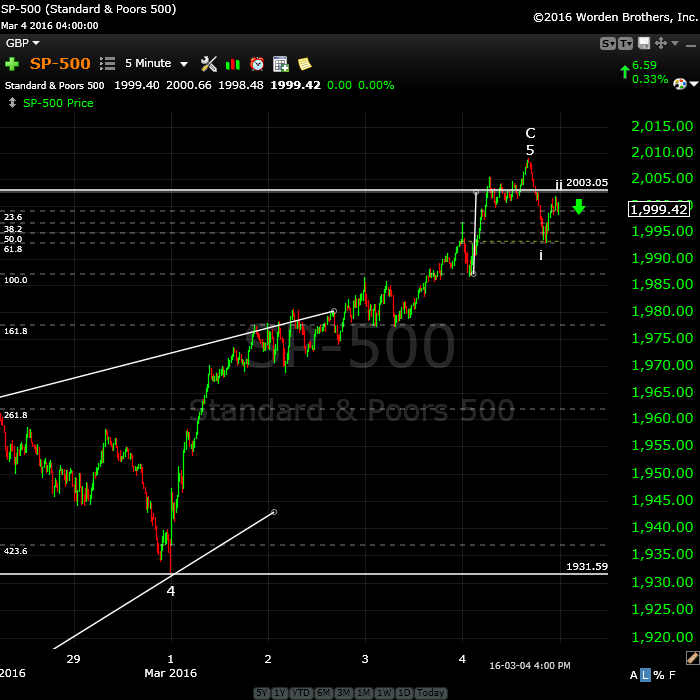
Update Thursday, March 10, 3:30 PM EST
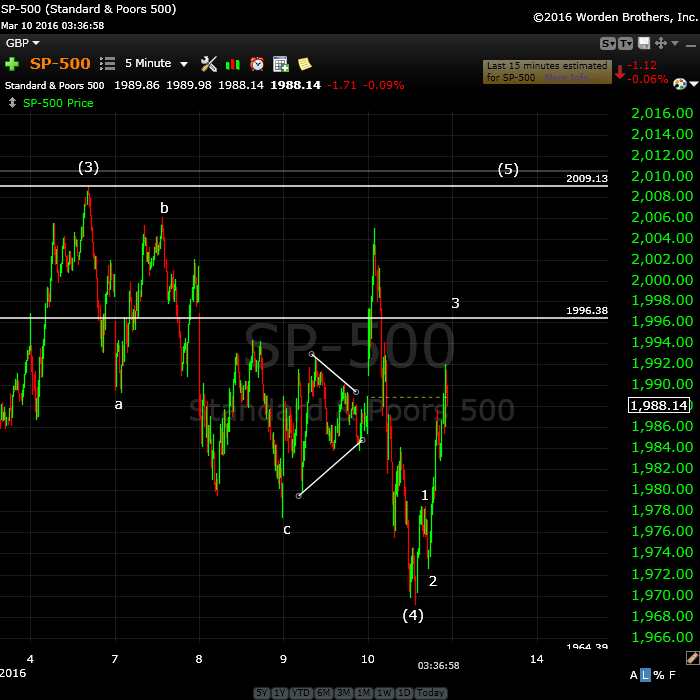
Above is the 5 minute chart of the SP500. As projected, we came down to the wave 4 level and bounced in a very motive set of waves. I put wave 3 to end at about 1996. Then we should see 4 and 5 to a new high. Ending waves are always in 5’s.
EURUSD also did exactly as expected last night. However the wave up is a bit short for a first wave, so it may have further to go before it retraces. I would expect the full wave up to go to ~1.12967. So I need to watch this one to see the next move.
____________________________
Update Thursday, March 10, 11:30am EST
Above is 5 min chart of ES (SPX futures). EW tells me this is a corrective wave (twice!), so I’m going with that until I see something motive. If we keep sliding and do a fourth and fifth wave and then a second up in 3 waves, I’ll change my tune, but right now, it’s warning me to stay away and that the trend is still up.
Draghi upset the market, but SPX did not make a new high (neither did the Nasdaq, or NQ, and a few more) and all the waves down are in 3 (overlapping waves). That’s my story and I’m sticking with it. 🙂
_____________________
Update Thursday, March 10, 8am EST
Well, Draghi gets the honours. We have a new high in futures (NQ still needs to get there). Cash will have to register the new high at the open. but after that, watch for a turnover. EURUSD has done as expected and show also turn up into a third wave rally.
The safest bet is to wait for 5 waves down and then 3 up to about 62% of the drop before an entry.
_______________________
Update Wednesday, March 9, 3PM EST
Here are the two charts I’m watching for a clue as to what’s happening.
Above is a 30 minute chart of the EURUSD, which moves contra to US equities. I have relabelled the waves, based upon the most recent moves. It appears I was off by one wave. I’m showing a very motive first wave (of a third wave) up. We look to be tracing out a flat (an abc wave in a 3-3-5 configuration. We have the C wave left to go. If it’s as long as the a wave, it should stop at about 1.092 or so, which is the 62% retrace line of the first wave up that I mentioned.
The drop in the euro should send equities higher, but not dramatically higher.
Above is the 5 minute chart of the SP500. We’ve completed an abc wave down, which appears to be a fourth wave, as it stopped at the 38% retrace level of the previous wave up. We’ve formed a triangle at a first wave up and we’re waiting for a rally to test the previous high.
The ECB meeting is scheduled for tomorrow at 7:45 am EST and that may provide some fireworks. However, I don’t have a cycle turn date coming up until Monday/Tuesday 14/15 (early next week).
A bit more patience, I’m afraid.
_________________________
Update Wednesday, March 9, Before the Bell
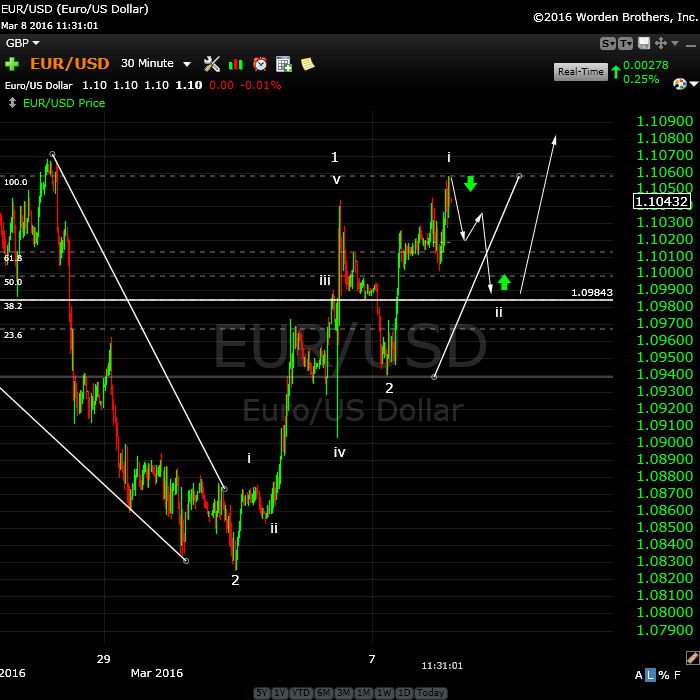
Futures have been heading back up all night. They’re about half-way to the top again. EURUSD has travelled well past where I thought it would stop to what is shaping up to be an even larger second wave. It’s got more to go, which will keep the equities heading up a little longer.
Today is an Andy Pancholi cycle turn date, so let’s see what happens. I don’t have another equities turn date for another 10 days.
I’m still looking for a double top.
________________________
Update Tuesday, March 8, 10:30 am EST
All the US indices are down in 3 waves, so we have to get them eventually back up to the top so they can turn over into the third wave down. This seems to be a fourth wave. The 1979 SPX area is the 38% retrace area of the previous wave up, so this may prove to be the bottom.
The March 5 cycle marked the top sure enough, but the test of that high apparently remains to be seen.
Obviously it’s going to take a couple of days to get back up to the top.
Above is the 30 minute chart of the eurusd. There’s a setup here in that the euro is correcting down in a second wave. It should turn up when it reaches 1.0985 or so. It will head into the third of third wave from here.
USDCAD is in the same position. The longer term trend is for the pair is now up, but it’s in the process of a 2nd wave correction.
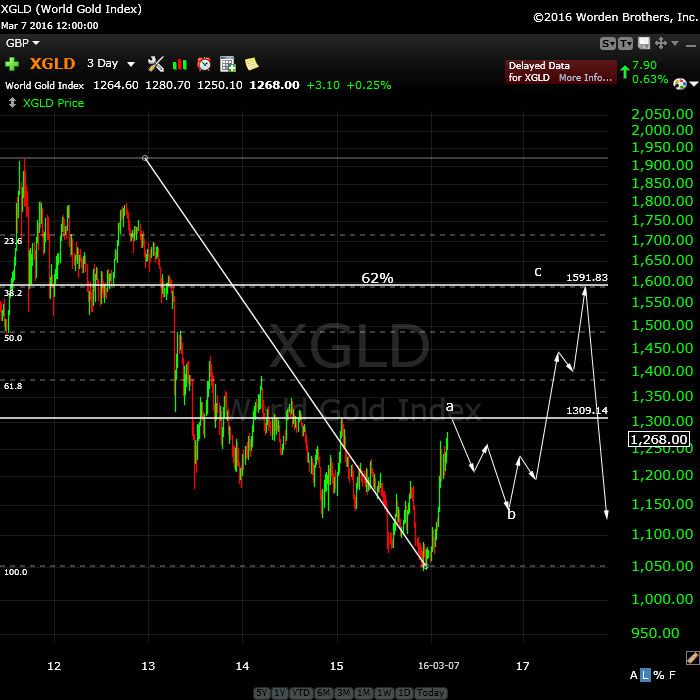
There’s a lot of chatter about gold out there, so here’s a 3 day chart of XGLD showing the projected path. We’re heading up to around 1600, before a final turnover and trajectory lower. However, we need to trace out a B wave at about 1300 before turning back up.
The entire corrective wave is a larger B wave with a larger C wave to eventually bottom out near $750.00.
______________________
Update March 7 Near the close 3:45 PM EST
This thing has been relentless, but here’s what I’m seeing on the 5 minute SPX chart. The triangle I identified earlier today is playing out. Anything to prolong the agony. The chart above is the update just before today’s session close.
A triangle forecasts the end of the sequence. There will be one more wave up and I suspect it will end in a double top, although it could go a bit higher. After that, it’s down in BIG wave 3.
_________________________
Original Post: Saturday, March 5, 2016
The Question Has Been Answered
For the past few weeks, the question has been: Is this corrective wave 2, or 4? For the past few days, it’s been obvious it’s wave 2 for the SPX related indices and wave 4 for the NDX related markets.
I also said that all the indices would have to meet their projected targets. On Friday afternoon, they did that and turned right on “Elliott Wave schedule.”
We’ve been in an ending diagonal (we’ve know that since March 1) and the fifth wave of that diagonal did the typical “throw-over” (went beyond the upper trendline). In the process, all the major indices formed a small fourth wave triangle, which is an indicator that there’s one more actionable wave up (in 3 waves) and a trend change at the top. That’s what ultimately took place.
The count says the next major move is DOWN.
However, the market didn’t immediately collapse as I’d expected. We dropped in a motive first wave down (on the 1-5 minute charts) and then held waiting for … ? Well, after looking around the market, the obvious culprit (to me) showed itself to be the EURUSD currency pair (in other words, the US dollar, which after all, is controlling everything). As the markets deleverage from the largest debt bubble in history, the current reserve currency is calling the shots.
I’ve been maintaining since last September that the entire market is moving as one (a theory Bob Prechter forecast years ago and it’s come to fruition). I’ve also been projecting a downturn for the US dollar and a rally to at least the 38% retrace level of the entire EURUSD wave down from June, 2014. That appears to be what’s taking place.
On Friday, the EURUSD finished 5 waves up of a first wave and now needs to correct that wave up with a 62% retrace for wave 2. I expect this to happen this Sunday, which will then allow it to turn up into a third wave, while US equities continue down in their third wave.
The market is again moving in a very logical manner, but the combination of everything moving at once complicates the major turns.
In terms of turns, the March 5 turn date was the major March turn date from Andy Pancholi (one of two major turns this month). If you want to find out more about his service (he’s in the 95% PLUS percentile for market turns), you can go here. I know Andy personally and he’s been doing this for his virtually his entire life. I highly recommend his work. You’ll find a chart that shows the accuracy of his forecasts over the past couple of years.
Here’s a video overview of the market for Monday, March 7:
Market Report for March 7  |
 |
Make sure you zoom the video to full size with frame expander (arrows) in the bottom right hand corner and also set the quality to as high as your web connection allows. This is an HD quality video so the best viewing is at that level. |
_______________________________
First Wave Down – What to Watch For
Above is the 5 min chart of the SP500. We turned over on Friday afternoon in a motive wave down. However, it’s not a complete first wave down. True, it was in 5 waves, but motive waves are fractal, so the much larger first wave will be in five waves. In this above chart, we haven’t quite retraced 62% (the upper horizontal line), but you can pretty much count on that to take place Monday morning. Then we should drop into the larger 3rd wave of the first.
I expect the first wave to at least drop to the previous fourth wave of the ending diagonal (and eventually much further) before a major retrace.
The first wave down will be in 5 waves and when complete will result in another 62% retrace (a larger degree second wave). Either now (at the top of this second wave currently forming) or at the top of the next second wave retrace is the preferred EW entry point. So don’t feel you have to rush in. There’ll be a much better opportunity at the second wave level than at the top and the risk is substantially reduced.
______________________________
The Road Ahead
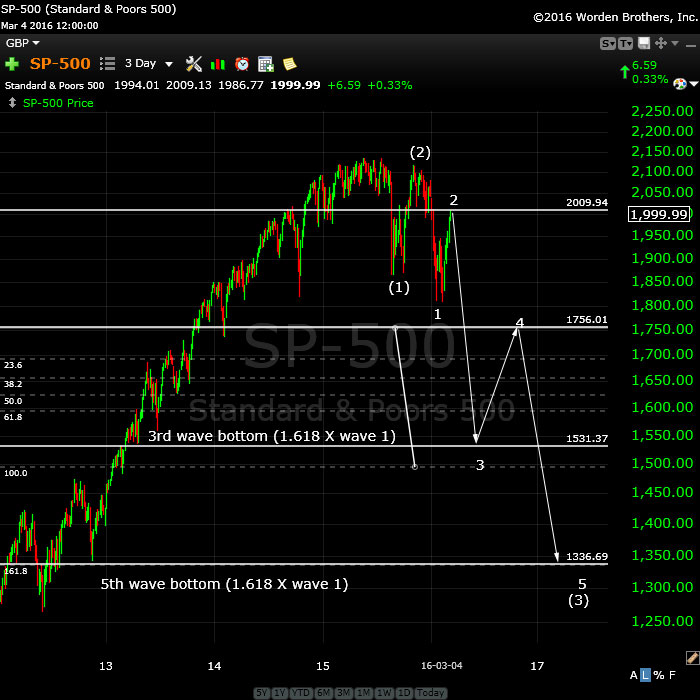
Above is a 3 day chart of the SP500 showing the road ahead. This would be the third wave of the first (of the third) down. You can can see the first and second wave marked. We’re beginning the third wave down.
___________________________________
Targets
Here are the targets for the major indices as I see them. These targets are for the bottom of the third wave in the SPX related indices and the bottom of a 5th wave for the NDX related group.
ES: 1507
SPX: 1535
DOW: 13,200
SPY: 163.5
IWM: 69.64
NYSE: 7,450
GDOW: 1750
____________________________
Updated Daily Chart for ES
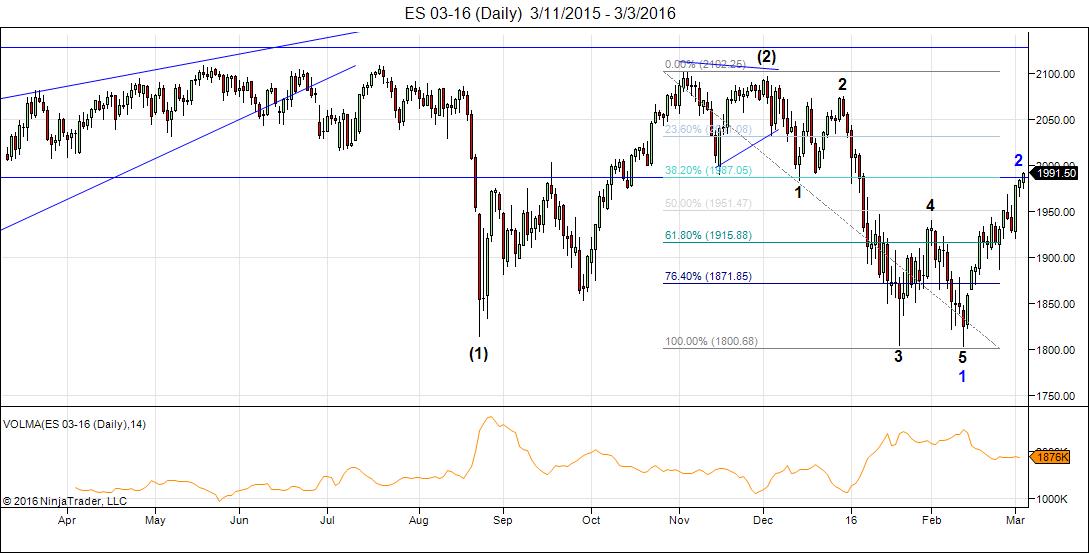
Here’s the daily chart of ES (SPX futures) This is one of the best daily chart of all of them because it has a really clear picture of where we are. We’ve completed a full motive wave down (again the 5th wave is short and overlapping—could be an ending diagonal, but in any case, suggests this is a fourth wave). The large retrace we’re at the top of has now retraced a bit more than 62% to 1984.
The next major move is to the downside. The third wave down should drop to about 1507 (at least), followed by a fourth wave retrace of 38% of the entire drop from 2100. From there we’ll head down in a 5th wave, which should be about the same length as the third wave. Much more on that later as the waves unfold.
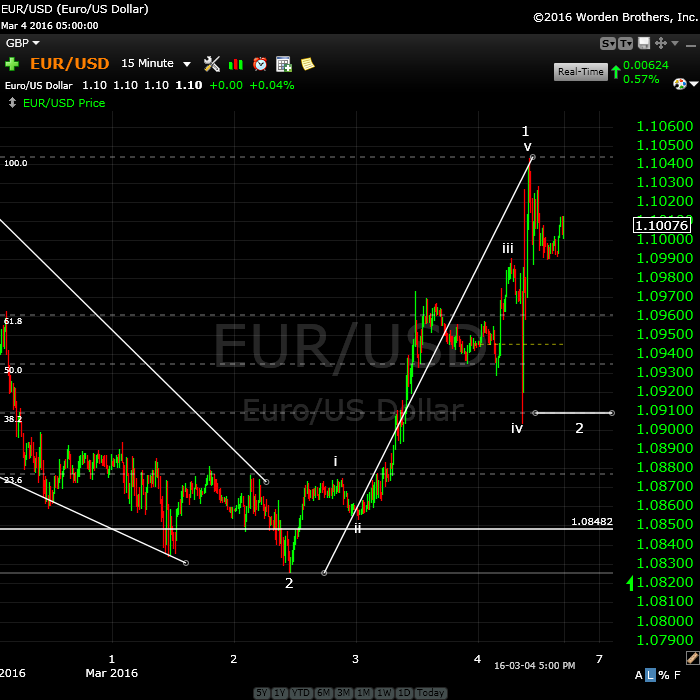
Above is the 15 minute chart of the eurusd. This shows the eurusd having completed the ending diagonal (2nd wave retrace as I’d forecast) and the turn into a motive sequence heading up. Measuring the waves shows that they conform to the traditional motive wave measurements, so I’m projecting a drop now in a second wave to about 1.091 and then a turn up into a very large third wave. The third wave up should be 1.618 X this entire first wave. Projected end: 1.112 minimum.
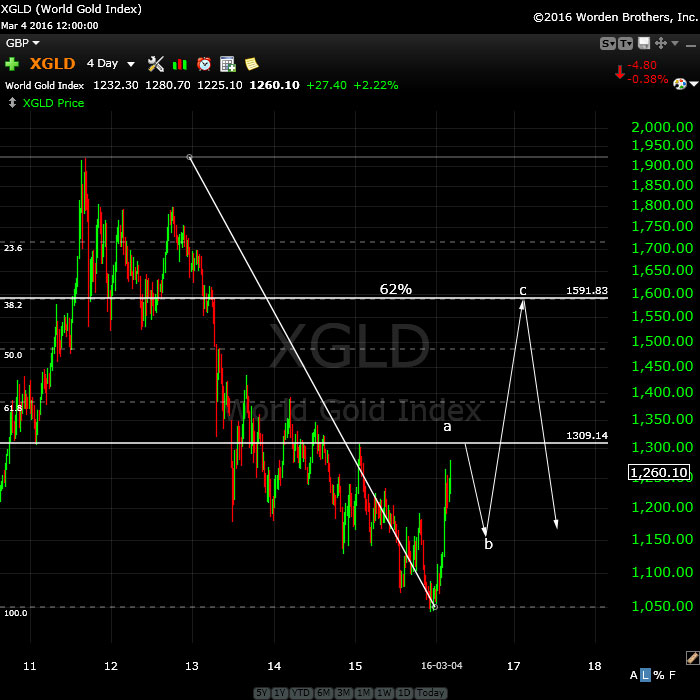
Above is the 4 day chart for XGLD (gold). We’re almost at the top of the a wave and expecting a large b wave retrace. We’re in a countertrend move and eventually, we’ll see lower levels for this key commodity.
_____________
Original Post (Saturday, Feb 27)
Governments and Our Money—A Really Terrible Cocktail
Well, the G20 concluded and absolutely nothing happened, not that I was expecting anything. You can read about it in zerohedge. The market was likely expecting a lot, but now cycles have taken over, the mood worldwide has turned decidedly sour, and central banks are simply out of ammunition.
It’s absolutely scary when governments get their hands on our money, as they’ve had outright since 1971. Inflation has been rampant right across the world and now, of course we have the largest debt bubble in history on our hands. It will unravel in its own time (over the next 5 years or so), but it will do it in a predictable manner in the major markets … and Elliott Wave manner, with motive waves down for the first leg, then a large B wave, and a final drop to the bottom.
Governments have now destroyed our currencies, are in the midst of currency wars, and have no idea of the damage they are doing to international relations, which will eventually lead to another world war, even though its happened over and over again in history … yawn.
Can we do anything to stop it? Likely not, but we can take steps to get out of the road and ensure that those around us stay safe and sound while our politicians act like “children let loose.” I think the opportunity is to use this new resource (the internet) to help educate all those who want to learn the truth and perhaps the truth will win out.
I would also like to have some long term affect on the banksters continually stealing from us.
If you want to know more, this past week I happened across the very best explanation of the international monetary system, its history with gold, and how governments inflating for their own ends have destroyed our future. The world is in one hell of a mess.
It’s free, only about 130 pages, an easy read and from the Mises Institute. It’s entitled “What Has Government Done to Our Money?” I’ll add the link to the appropriate spot in the forum.
Global Cooling
If you missed my interview on FXStreet with Dale Pinkert, it’s here (and in the forum). He ended up calling it “Global Cooling,” although I had no idea we were headed in that direction.


Every turn in the market has a price and a date. Gann said price is time and visa versa. But that doesn’t mean they are consistent for every turn. Usually there is a difference in angles. I am still trying to figure out what these differences can mean. This is unchartered territory as I think this is new in Gann timing. More on this later.
This research has given me some other insights so please allow me to make some modifications.
What I can see now is that 3/7 is a MAJOR date in PA (price angle) timing. But I can also see 2/26 should have been the high, So the market has been climbing a wall of worries. 2/26 was a shadow date on S&P and a square root high on 5/20/15, which was 90 degrees on the 1929 price. Trading day analysis on past highs and lows also gave a high 2/25-26.
S&P 2009 (significant!) gave 180 degrees (=top) 1/1/16, almost exacly Carolans 12/25 timing. The market advanced into 12/29; the midpoint between those dates.
The price angle on Nikkei 2015 high gave a high 3/7 and 180 degrees will 4/9 – a low. Td analysis gives a low 4/7. So my 3/23 will be a low, but not THE low. The 3/23 low wil bring a retrace into the strong 3/29-30 period before it turns down again into 4/7-9.
My 5/13 low will likely be a high with the may low comming later, around 5/23. This is confluence in td analysis and the Dax 2007 price angle (180 degrees 5/25).
This is all a bit experimental, so I bring this for entertainment purposes only. But in my head this all starts to make much more sense. Analazing the 1929 time angle, december 2020 should be a low.
Next week will be down. Merriman gives a critical reverse date 3/7, the solar eclipse, earth conjunct Jupiter, the anniversary of the 2009 low; every thing concentrated. And 2 shadow dates on S&P 3/7.
So, basically :
The Long term trend turned by the end of 2014. But 5/20 was a major 1929 timing. So the 5/20 top was weak. Europe made the highs in april, llustrating this weaking, Nikkei – always the last – set the high in june.
A very long term spiral (> 100 years) ran into 12/25.
30.000 E (Eulers constant) from 1792 and 10.000 PI from 1929 converged August/ september 2015, The earth-jupiter cycle pushed things ahead from 8/26/15 into 3/8/16,
So 12/25 – 1/1/16 were a major weakening of trend force. As was 1/31.
3/7 will be the third, last and weakest attempt of bulls to keep things afloat. Things should get nasty now. But the real panic may have to wait until later in 2016. Think 2017/18 will be the real disaster years.
We are down into the end of 2020 so this is the most significant high since 2007.
This is totally my own analysis. Put a lot of effort in this only to find Peter was right all along.
I have a lot to analyze so expect some new insights next week. In the mean time : enjoy the ride.
André
Thank you, cool stuff André! 🙂 And yes, Peter saw it correctly.
For myself, I have been shouting that a bearmarket started as of July 2015, however, nobody believed me… Well, if they are still not convinced by now…
Cheers,
W
ps. The NYSE 2007 PA gave the high 12/28 and gives a low 4/16,The Nasdaq 2009 PA gave a high 12/26 and a low 4/5,
With price angles everything is in sync. Gann must have known this but never put it in writing. He took most of his insights with him into the grave as he strongly believed everybody should do his own research- as he did.
Dear Andre,
2020 is also the next solar minimum that is due for this cycle 25.
2025 is the next target for solar max cycle 26.
So you may be spot on for both the 2020 and the natural Low at 2025 as lately these have been consecutive lower lows for the recent solar max which normally spells trouble.
Vincent
As it happens, 4/6 is a crashdate on 5/20. Nice.
Keep seeing funny things. The crash angle (122,143 degrees) on 19/6/1821 gives 12/16/2020. The Time angle on 1929 gives a low 12/14/2020.
What are the odds of this? 2 very different dates and 2 very different techniques. Just 2 dates apart. As I said all very experimental. But it wouldn’t hurt to take note of these dates.
Sorry for posting this much but I amso excited about what I found.
My tidal station gave the lowest high 3/3 and the highest low3/4. = High in the market. Next comes the highest high 3/11 and the lowest low 3/10. Then again the lowest high 3/18 and the highest low 3/19. Then the lowest low 3/21 and the highest high 3/25-26
This tells me we are down in the market from 3/3-4 into 3/11. Then a retrace into 3/18-19 and down again into 3/21-26.
The 5 difference between high and low tides suggests the market needs a few days to find a low. 3/23 is a magnet.
The consensus on this Board appears very convincing, but I gotta wonder……perhaps it is just the contrarian in me, but with this much consensus on one side of the trade, will the Market ‘beast’ go against us and go UP instead??? I just wonder……
Hi amb,
If it is up to me, we go up hard 1 more time on Monday (1-2%) and than… Kaboem down. 😉
W
I’m expecting a double top on SPX, as that would be natural, but not any more than that. The wave up appears to be in 5 waves, so it fits that scenario. We’re in the fourth wave now. The euro appears to have turned up and that was what I was expecting after the drop.
NDX may already have topped and in a second wave.
do the time stamps for the posts reflect ‘Mountain Time Zone”?
My comments would. For posts, if it’s time sensitive, I note the time and make it US market time (EST).
I added a 5 minute chart of SPX showing what I’m seeing.
The problem with putting up chart intraday is that the count changes as soon as you get them up. With this latest wave down, I’m seeing a triangle forming in SPX so I’ve replaced the previous chart at the top of the post.
And in my haste, I mislabeled the triangle, so it’s now replaced – if that’s what it is. If it is, we need to see a drop to the lower trendline and then a final wave up to a top.
The SPX triangle continues to take shape.
As I mentioned, NDX does not look well … and I can count 5 waves in the first wave down. This would put it in either the third wave or the fifth wave of the first. These are lower degree waves of the larger third.
Peter-
One of your note’s from last’s weeks blog about FB and AMZN is shaping up nicely today.
Ted,
Haha … I’ve been watching them for a while. NFLX as well looks to be starting the topping process, although I think this is a fourth wave and it may need one more. The underlying market is continuing to roll over. The big guys are starting to move down. AAPL continues to be in trouble. Looks to be in the fourth wave of the third. Down is next.
It all supports a top here in the indices.
I updated the triangle chart. That’s what it is.
One of my concerns has been IWM (Russell 2000). It seems to be the straggler, after all, and I now think its final target is my original one of 110.00, which is the 62% retrace level. I was trying to find other targets for it because I thought that was too far away, but it appears not to be.
We’ve been as close at about a buck away.
Euro turning down for this final wave up in the indices, but it will probably last until the morning.
One final update posted of the SPX chart. I’d look for an early morning turnover. I’ll do a a brief update of where futures and currencies are at before the open tomorrow.
Thanks for the updates, Peter.
You’re welcome. I was watching fairly intently today. I’m expecting the trend change at any time. I was surprised it wasn’t today.
I think they will struggle until ECB on Thursday
Dimitri.
I think you’re right. Since the dollar’s in control (and by extension, the euro), that looks like the timing to me.
Peter,
I still feel the TOP should be around 2033 ( ES )
We could get there any day this week , although I feel it will be closer to Thursday .
Regards
AZ
Mr. Fork,
I think you’re going to be right on that top. This has become a very complicated fifth wave, and we still have a 4th/5th combo to do after this third is complete. But that should be it.
Gravity gave the high 3/4 -as explained. But 3/7 was a shadow date. I must have mentioned that. The market had to test it. But with gravity up (= markets down) a new high was unlikely. We are down into Friday. We will keep consolidating into the end of March. Then the move down will pick up speed. I think.
Somehow the AEX seems to be in C.4 and still has to do a 5 wave up… Bigger picture, it retraced 61,8% from the top, but still… Somehow is odd about this crappy stockmarket…
I added some short thoughts to the top of the post (as we wait). The market destroyed our lovely triangle, unfortunately, so now we’re just waiting for a test of the top. This should be the fourth wave.
So C.4 it is, thanks for the confirmation Peet because that is what I am seeing in the AEX. 🙂 3.2.C.5 Still needs to come than. 😉
Cheers,
W
Currencies are correcting, too, so I might add to that note. There are some good setups.
I added a chart of the euro to the top of the post so you can see what it’s doing. It’s just started a second wave retrace after 5 waves up.
Hope my little explanation make sense. USDCAD has also finally turned up, but it’s in a second wave retrace.
The euro, as it retraces, should help the equities indices rally.
That’s 5 waves up in SPX, so we’re going to get a motive ending wave. This first wave up went to the previous fourth wave down in ES and NQ, so we’re right on track to test the high.
We should retrace a 2nd wave here and then turn up in the third wave of the 5th.
I think tomorrow is some kind of low volatility day
a low near the open or shortly after ( 1st 1 1/2 hours )
a sideways move which io prefer as a high .
4 1/2 hours from the open ill be looking for a decisive turn
which can be a high or a low yet it would look best
as a turn to the downside .
17050 on the cash dow would be the buy stop if im wrong
initial downside to below 16921
joe
Short update up top. Today is an equities cycle turn date, so let’s see what happens.
I see a lot of setups that suggest we may see a top.
This is an extremely volatile market. However, I don’t see any motive structure down in equities. It’s corrective still so far, so the resolution looks still to be up. I’ll let you know if I see anything that changes that situation.
Not expecting much out of today now. We’ve done a first and second wave and are in the third wave up. We have the ECB meeting tomorrow and decision (13:45 CET, which I think it 07:45 EST).
My next turn date for the dollar is March 14/15 and Equities a few days after that.
I’ve placed two new charts at the top of the post to give an idea of what I’m seeing and expecting from an EW perspective.
I posted a quick note at the top of the post this morning. We have a new high.
3/11 major inversion. This is the last leg.
André
Peter thank you for the updates. Today is perigree and AZ’s target high date. Peter, any chance ES hits Amb’s 2033 target which will close gap?
Not as far as I can see. I would look for a current double top.
There’s a chance, of course, but based on the euro and what it’s doing and the length of the current waves, etc, the chance is slim.
Thanks!
Actually, I just measured ES. If the fifth wave goes to full length, AZ could be correct.
Except the more we fall, the less likely it is. And it’s a lot less likely now.
At full length for wave 5, I put the top at 2020ES.
Peter,
the wave down in ES looks to be in 5 ?
3 to me. Wave 2 is much bigger than 4, so we should still do a double top, I think. The euro might be 5 up. It just shot into the stratosphere.
Incredible volatility
You ain’t seen nothing yet.
Eurusd seems to be in 3, as well.
I keep looking at the wave structure and wonder if it will stretch itself to Monday. We had a very large triangular wave 1 in SPX and wave 4 should be a similar size (and length of time) if the wave up is to be in 5 waves. The other idea is that this is an ending diagonal, so the ending wave could be in 3. We’ve lost all momentum and I see work to do still in IWM (shy of 62%), so it wouldn’t surprise me to see the turn take place at the cycle turn date, which is Monday/Tuesday.
Yesterday was also a turn date, but we missed it …
And everything’s changed again … Now it looks like we’re going to extend the third wave, as we seem to have just done a second of the third. So let’s see what happens … and AZ is back in the game, I think. This is the final fifth wave, but we’re down to the one minute chart and it’s more and more difficult to analyze subwaves.
There are options now that weren’t on the table earlier this morning. I’m leaning more and more to a turn early next week.
Peter,
the Europe market has done a huge reverse. Euro too.
Personally I would opt for the reverse today.
Well, you can always do your own thing. That’s allowed. 🙂
However, I’ll stick with EW.
My comments and an ES chart at the top of the post. Off to get some work done. I’m going to let this market shake off Draghi and finish what it was doing. I’m not excited by what I see.
Thanks Peter for all the efforts crazy markets Dax almost 10.000 and it ends down price swings more than 500 points..
Yesterdays market played out fairly close with the exception of the close.
Today’s reversal shows promise
the 10 day adv decline line has now turned down
the 5 day turn down several days ago .
the cycle low due march 23rd is my next date
a short term cycle high is due on monday .
My error was entering based on the solar eclipse yet even being a day
early on my entering short the market is working profitably .
Next week must be a dow week or im completely wrong and at the moment
im sticking to more downside .
adv dec is 2 to 1 negative at the moment.
another error on my part was sleeping in this morning holding a short
position . the whip saw worked out but i have to call it a draw down even
if its not one .
this is a larger bullish set up if it plays out ( march 23 low )
Joe
Thanks Joe,
So after March 23 we will be up into end of April you think?
Peter,
If SPX gets under 1976 today, wouldnt that be a five wave move?
Scott,
No, if SPX gets below 1975.55, it will be three waves. The first wave down has no second wave, so you’ll have a wave in 3. And you have all the baggage from the corrective stuff to the left of it. It actually should go lower, because it’s not low enough for a proper correction. This looks like a fourth wave continuing its correction. a 38% retrace of the entire structure up would be about 1963/4.
Thanks. BTW loved The Only Numbers that Matters piece. Teaching it to my three boys. Cool stuff! Three is a book by Scott Olsen called The Golden Section–Natures Greatest Secret that you would enjoy.
I have it and a few more. Thanks for the kind words.
I stick with Peet, haha. 🙂 I think the top will be somewhere at the end of March, maybe beginning of April and 2020 sounds reasonable! This market keeps going sideways with an up bias for ages… First screw over all traders and than finally gets trending. 🙂
@Peet, check the AEX, remember the target I told ya? 😉
Cheers,
W
We will see a low tomorrow. Europe wants up, So in the morning (european time) markets will be up. Around noon it will turn down again to set a low for wallstreet. Europe will make the low Monday. But after that it will be up into 3/17-18 before dipping into 3/23. Then up again into 3/30-31.
I mention earlier that we will be consolidating into the end of march. Then something changes and the trend down will resume with more force. The low will be around 5/23-25.
This week some long term natural cycle turned down. So the longer term trend is already down, but we will be bouncing in March before racing down into May.
André
Once upon a time “Trend fund” used a method of buying call options just before
fed meetings and selling those calls right at the news and walking away .
this same approach is used just before earnings announcements .
during the end of a qtr fund managers go through the pretty up the positions held
etc . the stocks that were rising tend to rise and the bearish stocks tend to drop further . once the qtr ends those fund managers go back to buying the junk back and selling the winners ( churn for paperwork only )
this bounce today has to be viewed as a 2nd wave bounce .
following march 23 if this works out im turning back to the bullish side
targeting the 18000-18140 range into late april
Joe
I added a chart of the SP500 at 3:30 market time. It’s sporting the expected motive set of waves up. Expect a new high, which may turn down. Measurements put wave 5 somewhere around the previous high.
the risk i see being bearish .
decennial pattern is calling for a sideways move into sept 8th 2016
very short term a cycle low due march 23 yet if i was to use the decennial
pattern calls for a high march 23rd ( my own version )
and a short term low the end of april
if i took the basic pattern of 1929 to 1930 inverted since last year was
for the most part the inverse of 1929 . the the late april cycle used with the puetz
window would produce a cycle low .
Bottom line : march 23rd is a pivot-able date from which the bull bear debate
will be defined for me .
a low on march 23rd -versus a high is preferred.
more sloppy movement into Tuesday is allowed yet really not preferred
if we actually saw a top .
the fed meeting should be viewed as theater and the wave count
the expected outcome .
march 23 to April 7-11th should be a powerful move , ( can be up or down )
now the market must prove itself
Joe
Joe,
If we continue to go up like I think we do maybe until March 16 or 23 after that if it is a stong move to the upside the Puetz window is still valid?
Puetz crash window.
Solar Eclipse 3/8
Lunar Eclipse 3/23
Crash window 6 days before til 3 days after a lunar eclipse that happens within 6 weeks of a solar eclipse.
Crash window between 3/17-3/25.
I just added a chart of ES tonight as it’s at an important inflection point.
3/15 is bayer’s rule 32 (Mercury imitates the sun) on the 11/3 high. This fits Peters analysis. 3/15 will also be first quarter.
The tides suggest an up wave into the major 3/17-18 date. But longer term cycle are down. so we will have to see if the tides are strong enough,
I also see tidal inversions on Tuesday and Thursday. This could indicate a high on Tuesday, then down into Thursday and a pull up into 3/21.
Cheers,
André
Peter,
I should admit that you was right as always.
The market is crazy but it is rigged.
When the rig becomes unsustainable it will provide maximum of pain.
It seems that ES is going to attack your target today.
Dimitri,
Yeah, been watching it at work. I’ll have to add a new chart in the morning … off to bed. This appears to be an extended third wave (or the entire thing). We could still need a fourth and fifth, although I’ll bet it’s a deep fourth. I think everything will stop at the previous high. I still think we’re looking at Monday, but we’ll see.
I just replaced the ES chart with the extended 3rd wave count. I see a fourth and fifth to come. I think we go down Monday, based on the little we still have to do, where all the other indices are at, what the euro and dollar are doing, and the cycle turn date. Let’s see what happens. I’ll post a video on the weekend.
+1 Peet! 🙂
Peter,
Tuesday is the strongest day. So I expect high-low Friday and Monday with last leg up into Tuesday. After that finally down into late May. I’ll elaborate on this in the weekend.
André
I agree with going down into April/May André. 180 Degrees different from Joe. 😉
Cheers,
W
I added a short update and chart this morning.
I added a blurb about EURUSD and what it’s doing that supports and 4th and 5th wave still to come. The current high may hold or we may go a little higher. We’ll have to let the market tell us that.
double top…No wave 4?…are we going higher?
thanks
whit
Robert,
the top of my ES chart isn’t quite labelled correctly. The larger 4/5 is still to come.
I replaced the chart.
Sorry, sometimes my page does not update.
Thanks for info. as always.
This website is for educational purposes relating to Elliott Wave, natural cycles, and the Quantum Revolution (Great Awakening). I welcome questions or comments about any of these subjects. Due to a heavy schedule, I may not have the time to answer questions that relate to my area of expertise.
I reserve the right to remove any comment that is deemed negative, is unhelpful, or off-topic. Such comments may be removed.
Want to comment? You need to be logged in to comment. You can register here.