
 The Waves Tell the Story
I get asked from time to time whether the actions of central bankers influence the way the market moves.
The answer is “yes and no.”
The “yes” part is that from 2009 to the present in the SP500 and related indices, we have a B wave, which is highly unusual; in fact, it’s remarkable . But, let’s look first at the bigger picture — using the DOW chart, because the data goes back the farthest.
Big Picture – the DOW 1920 to Today
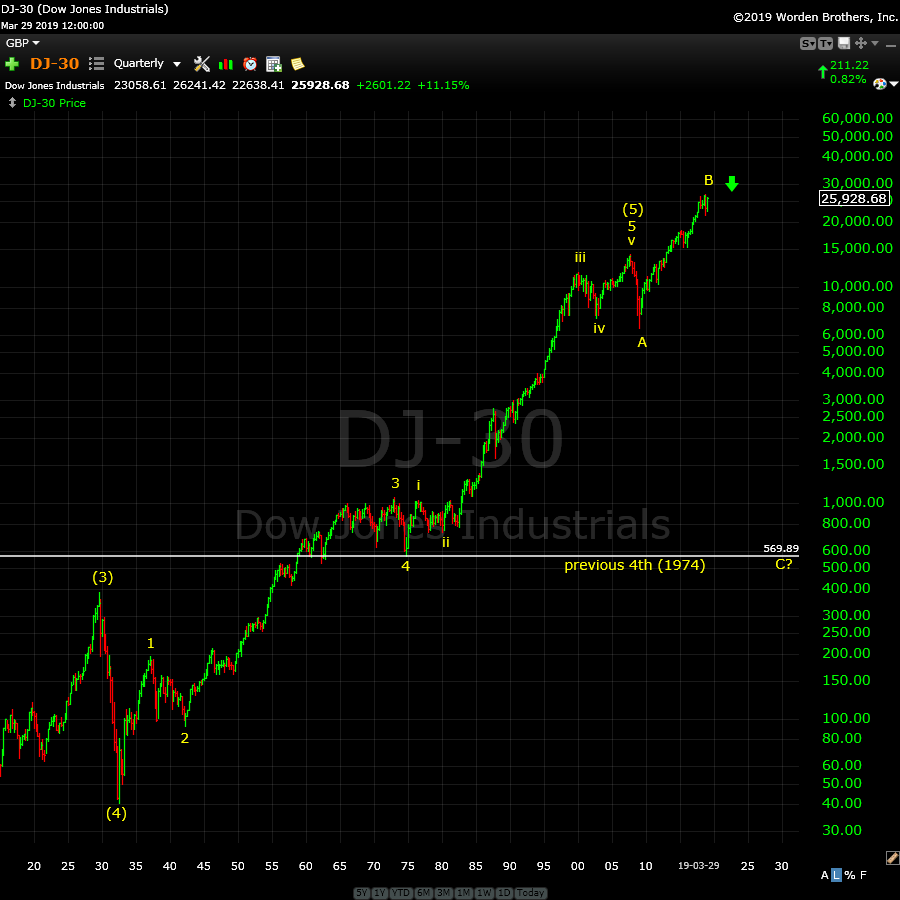 Above is the quarterly chart of the DOW going all the way back to 1920. (click to enlarge)
You can see that 1929 was the top of a (circle) third wave and that in 2007, we topped out at the top of the final (circle) fifth wave. 2007 was both a projected 172 year and a 516 year cycle top. We expected the market to crash then, with a downside target of the previous fourth wave of one lesser degree, at approximately $570 (shown as a white horizontal line). After the final fifth wave, the market always returns to the area of the previous fourth of one lesser degree (which means it will get close to that target, but might not reach it exactly).
So, what happened — why didn’t we keep on going down in 2009?
Central banks happened. Quantitative Easing, which was the injection of cash (with the Fed taking on the debt) into the commercial banking system “saved the day.” In terms of how it affected the market, you can see the B wave on the chart, which is a corrective (based upon its subwaves — what I refer to as “unnatural wave” because it was, in a way, “forced”).
B waves at the top of a market are not supposed to exist.
On page 58 of the Principle book, Prechter provides his opinion that this is impossible (“Erroneous Concepts and Patterns”). Ralph Elliott, on the other hand, believed they were possible. Elliott was obviously correct, as we have one across all NYSE related indices, obviously a result of the QE of central banks.
The Induced “B Wave”

Above is the 7 day chart of the SP500, showing just the “B Wave” up from 2009.
The “no” part is this: The subwaves all play out as they should. The “B wave” up from 2009 is a B wave because it’s clearly a corrective structure. Within that structure, Elliott wave principles hold true, as they always have and always will (until proven otherwise). The planets still revolve as they always have (and hopefully always will), influencing the emotions of humans on this tiny revolving rock called Earth, so the waves play out appropriately to the beat of the Universe.
I have seen no anomalies in the wave structure up from 2009 and I’m doing analysis daily at all degrees of trend across multiple assets classes (and following international indices).
Within the above chart, you can see when QE was announced (in purple):
- QE1: December, 2008
- QE2: November, 2010
- QE3: September, 2012
The market was affected in each instance — QE2 and 3 had the effect of pushing the market up. What’s interesting is that they happened at points of relative weakness, but didn’t really affect “the count.”QE1 was a different story, but still had a major influence, as the chart below shows.
The Great Recession – A corrective “A” wave

Above is the daily chart of the SP500 (click to enlarge) spanning the period of mid-2007 (the top of the bearish wave down) to mid-2009 (a few months after the wave bottom).
What’s important here are the purple letters. This is a zigzag. There’s a purple A wave down of five waves, then a purple B wave in three waves, and finally a purple C wave that is exactly 2.618 X the length of the A wave, a typical length for an extended C wave. There are no fourth and fifth waves.
In fact, you can see that the wave structure changes near the bottom as QE1 kicked in. The drop from the high in 2007 began as a set of impulsive waves, but didn’t complete near the bottom (that where the stimulus began — QE1 began in December, 2008).
As a result of QE1, the next set of waves down became a “three count” — an ABC ending wave. What had begun at the top as an impulsive set of wave down (wave 1 of the start of a larger downturn) changed at that point into a corrective wave. Almost everyone missed this event, but it’s a clear indication as to how Elliott Waves are predictive.
So the entire wave down must be classified as a corrective wave. Although I didn’t pay all that much attention at the time, it predicted another wave up to a new high. We’re getting closer to the top of that “induced” B wave now. Although, we have one more all time high to go, the fifth and final wave.
[addition – PT] These “stimulus events” by central banks usually (if not always) take place at wave lows (additions on the above chart are in red). So, you can see that at the Federal Reserve March, 2008 meeting, after a surprise announcement of a 3/4 of a point interest rate cut, the market turned from the bottom of the first wave (or A wave — after 5 waves down — which is the normal place for a rally). The market first dropped a bit and then rallied 184 points to complete the second wave (top at 1440).
At that time, the Fed also allowed brokerage firms (for the first time ever) to borrow money directly from the Fed at lower rates, Well, we know where that money went! They actually cut the discount rate for banks twice in a three day period!
Likewise, in November, 2008, QE 1 was announced at the bottom of the third wave of the C wave and immediately rallied again (at the appropriate spot in the wave structure). However, the rally was short-lived and resulted in another low to complete a C wave before a much larger rally up, which has become our large B wave (where today, we’re in a large 4th wave close to a top).
Following from this, if we’re going to get QE 4, I would expect to see it at the bottom of the fourth wave, when we’re under the 2100 level that I’m predicting.
In summary, central banks have affected the direction of the market overall (creating a B wave to new highs that we not expected at the time). But the waves reflected that financial injection and predicted another wave up.
But, the subwaves not affected; they still trace out their patterns as if nothing happened; they continue to follow the rules of the Elliott Wave Principle.
The market is influenced by the movement of the planets but nobody’s done anything to change their timing or orbits. The market will continue to play out as it always has, hitting fibonacci ratios on schedule and tracing out Elliott Waves that are as predictable as they’ve always been.
_____________________________
Elliott Wave Basics
Here is a page dedicated to a relatively basic description of the Elliott Wave Principle. You’ll also find a link to the book by Bob Prechter and A. J. Frost.
____________________________
Registration for Commenting
Want to comment? You need to be logged in to comment. You can register here.
If you register, it protects your information. It also allows you to comment without filling in your information each time. Once you’re registered, simply go to the home page and click on the login link top right in order to log yourself in. Usually, you’ll be logged in for several days before needing to be logged in again.
______________________________
Problem receiving blog comment emails? Try whitelisting the address. More info.
______________________________
Have not had a losing week RW 2
Have not had a losing week …I have been with Peter almost a year. The only thing that matters is have I made money with his service. I think I have finally turned the corner using Peter’s EW. I have not had a losing week in the last 5 months. Thanks Peter, for your amazing amount of hard work. —RW |
Couldn’t be happier … KK 2
Couldn’t be happier …The analysis and insight you provide is simply amazing! I’ve been trading the futures and equity markets for well over thirty years and usually average around 5% monthly. Since joining your Traders Gold Service two months ago, that number has better than doubled. I couldn’t be happier.—KK |
Get an upper hand … JC 2
Get an upper hand in trading …Seeing all the different currency pairs and the wave structures and hearing you explain why this has to do that on a nightly bases gives one a upper hand when trading. Elliott Wave applies to all stock and indices and can be applied to any candlestick chart. If someone ask what you want for Christmas – Tell them a membership to Peter’s “Traders Gold!”—JC |
Tops in your field DZ 2
Tops in your field …You are tops in your field. Tried to follow Elliot Wave international for years. They were always behind the market. After discovering you, I perceive that you are an expert in reading the waves, which puts you way ahead of the rest of your peers. And you can read the Waves like you are reading tomorrow’s financial section. I pray you stay healthy. —DZ |
Rise above the rest … SM 2
Rise above the rest …I have only ever met a few people who, in their chosen fields (astrology, medicine, music, martial arts, technical analysis), rise above all the rest and you are one of them…you have ‘the gift’…and that’s why I’m a Trader’s Gold member. —SM |
the real deal SM 2
The real deal …‘Educational, insightful and thorough market analysis for all levels of traders. It’s Elliott Wave at its best….Peter Temple is the real deal’ —SM |
A true expert in Elliott Wave FL 2
A true expert in Elliott Wave …You are a true expert in EW analysis. What you provide is not available anywhere and is priceless. Subscription on your services is the best thing I have ever done. Many thanks for your effort to make me a better investor. I now have more trust in my investment decisions. I hope you will continue the excellent work! —FL |
The best of them JL 2
The best of them …Last couple of years, I subscribed to several ‘market traders’. You are by far the best of them and the personal contact is awesome. Daily and daily updates are very well written! Besides your expertise in EW, I also like your cycles analysis. Best investment I ever made! —JL |
US Market Snapshot (based on end-of-week wave structure)
Here's the latest daily chart of ES (emini futures)
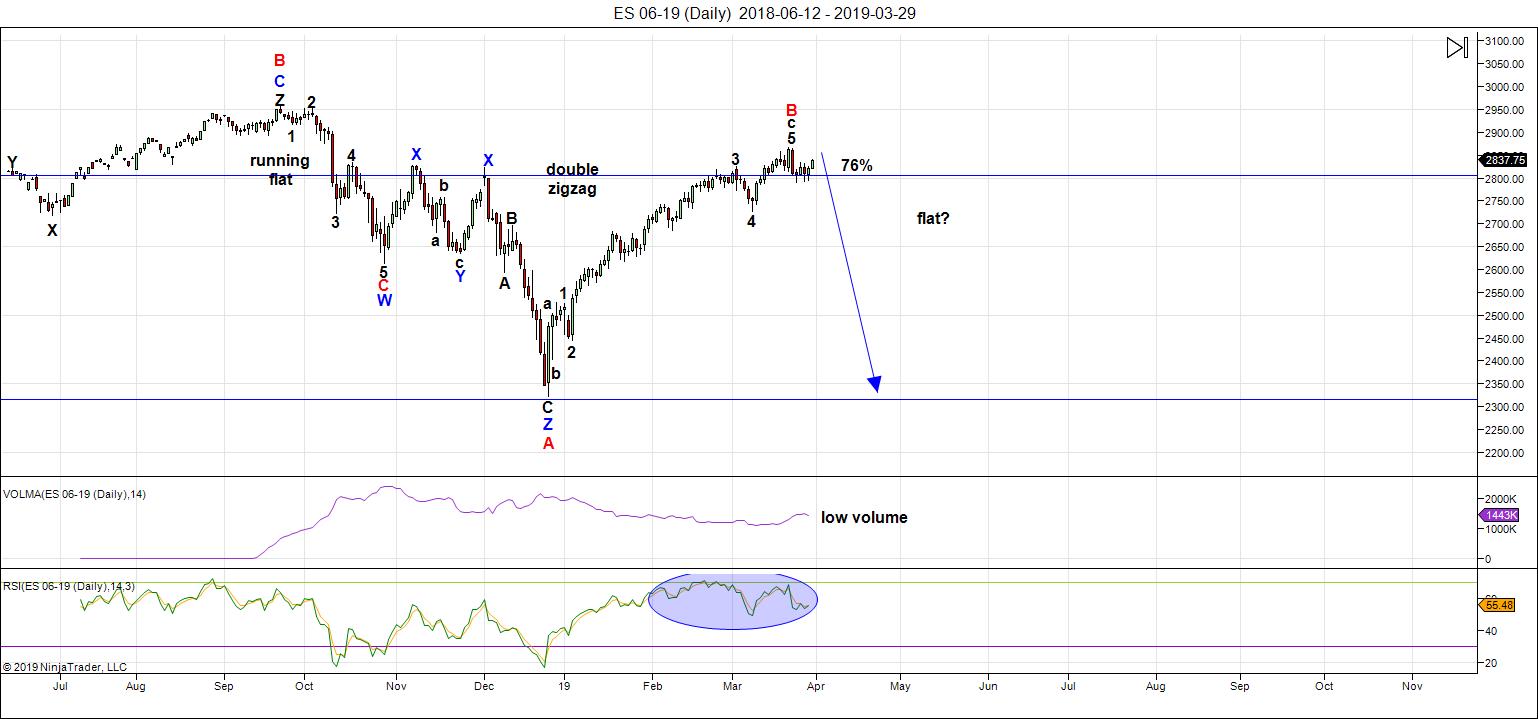
Above is the daily chart of ES (click to enlarge, as with any of my charts).
We're still sitting near the top of a B wave that's risen to about the 76% level of the height of the previous set of waves down from the all-time high at October 3, 2018. Almost all the other assets I cover on a daily basis are hovering near inflection points.
The US indices are are working getting all "the gang" to a new high, as predicted in past weeks; progress is slow. That's because all asset classes I cover have to top (all the same market) before we they can all head down in tandem.
As I've been saying, IWM (Russell 2000) and the DOW both need new interim highs before everything heads down in a dramatic capitulation. The US Dollar Index also has another leg down before it turns up in earnest.
We're in the final bullish 5th wave in ES - a minimal new high to finish what appears to be an ending expanding diagonal.
The next major move is to the downside.
As I've been saying, the wave up from Dec. 26 is clearly corrective and, as a result, must fully retrace. This is supported by the US Dollar Index, the major USD currency pairs, WTI Oil, along with DAX and other international exchanges.
Summary: My preference is for a dramatic drop in a C wave to a new low that should begin sometime this week. The culmination of this drop should mark the bottom of large fourth wave in progress since January 29, 2018 - over a full year of Hell. It may be a dramatic drop that lasts multiple months, and will target the previous fourth wave area somewhere under 2100.
Once we've completed the fourth wave down, we'll have a long climb to a final new high in a fifth wave.
___________________________
Trader's Gold Subscribers get a comprehensive view of the market, including hourly (and even smaller timeframes, when appropriate) on a daily basis. They also receive updates through the comments area. I provide only the daily timeframe for the free blog, as a "snapshot" of where the market currently trades and the next move on a weekly basis.
______________________________________
Sign up for: The Chart Show
Next Date: Wednesday, April 3 at 5:00 pm EST (US market time)

The Chart Show is a one hour webinar in which Peter Temple provides the Elliott Wave analysis in real time for the US market, gold, silver, oil, major USD currency pairs, and more. You won't find a more accurate or comprehensive market prediction anywhere for this price.
Get caught up on the market from an Elliott Wave perspective. There’ll be a Q&A session during and at the end of the webinar and the possibility (depending on time) of taking requests.
For more information and to sign up, click here.
| "I think you are the only Elliot Wave technician on the planet who knows what he's doing.” |
| m.d. (professional trader) |
All registrants will receive the video playback of the webinar, so even if you miss it, you’ll be sent the full video replay within about an hour of its conclusion.


Thanks Peter.
The contention by some EW “purists that CBs have NO EFFECT on wave structure is so bewildering in its idiocy that I think is has caused a lot of people ( like me) to have serious doubts the claims generally made about its ability to predict market movement. I have to say it is truly refreshing to see some sanity in the arena of EW analysis. I had just about given up!
The question in my view remains about how much influence they CONTINUE to have on how market price is unfolding, and just as we saw an “anamalous” wave from 2009 to the present, whether that might not be a reason for caution in our expectation of what we might see going forward. I predict next on the agenda will be an announcement of a resumption of Q.E. O.K. Back to my cave! 🙂
Thx..Mr Verne..the CBs..can only do so much manipulation b4..free mkt forces unravel any desired outcomes. For ex..CBs can buy time..& send things in 1 direction..BUT eventually it will reverse..& head where they should go..according to EW patterns..Ive done extensive research..on the impact of the whole petro $ system..& how CB influence..has done FAR worse..than if they had let jus let..free market forces take..natural course. Fed..is biggest scam goin!
I added a segment in blue on the blog post, with a couple of items in red on the Great Recession (2007-9) wave chart.
Thank you Peter T again. Excellent explanation for us beginners. Your sharing of the knowledge you have is greatly appreciated. I do have a question though. If the CB’s do initiate another set of QE, will that just prolong the current 4th wave? Might it even extend the 3rd wave of this 5 wave construct?
Thanks again for your hard work!
Hi Jeff,
This is a good point and so I’ve added two items (in Red) on the lower chart of the 2008 “Great Recession,” along with an explanation in blue further down. So, to your point, if we’re going to get QE4, we’re most likely to see it at the bottom of wave 4 (below 2100). Stimulus like this (on whatever level) has a weaker effect as we devolve into a deflationary environment, so I expect it will be a large stimulus (a “Hail Mary”, but only get us to a new 5th wave high, which is where we have to go anyway.
The larger point is that the influence of the planets (we already know it’s there) propels people to act definitively at highs and lows. They react to their emotions. It doesn’t negate the wave structure or make the waves do anything to break the Laws of Nature (ie – Elliott Wave rules), but they seem to work hand-in-hand. I happen to think this is fascinating and I’m sure over the next hundred years, or so, we’ll do the research to get to the bottom of how and why this happens. Major changes an inventions happen near cycle tops and into the subsequent downturn. There were lots of similar inventions that came out of the 1920s and ’30s.
Charles, I recently saw you had a target of 2950 on SPX. Think that still hits soon?
Last week I added a couple of S&P ETFs in my IRA and moved a lot of my 401k out of the stable value into stocks. Most of the analysts seem to think we’ve had a V recovery with last year’s bottom being the best buying moment for a while. Martin A also seems to be confident worst is behind us for a few years. I don’t want to miss any more upside.
Imma thinkin..we hit 2950 by..this Fall.
I have 2 paths..in play..
1..this is still 3rd of 5th..with new..all..time..highs by Fall
2..this is 4th of 5th..with new low needing..to get to 38% retrace..below 2200
My mind is open to either..or
Either way..imma expectin some kinda pullback..soon
Retrace levels imma watchin 2665..2700..& 2738..
SPX..needs to close below 2805 & break 2785 support for me..to get short.
Ideally..break below 50 & 200 sma b4 I get excited..
I still think we get 200..to..300 point pullback then..new all time highs.
If SIR PETERS call is right..& spx is goin 2 new lows..then drop below 2500..would be where that looks more likely IMHO.
Peter T
I’m adding info only
Very good and insightful post
Food for thought
I followed this pattern for 10 years .
I was initially made aware of it by Jerry favors who past away .
In 2003-2004 I altered the count and when the top came in 2007
I was very much aware of the downside target which was to below
The 2002 lows . Secondly the 2009 bottom was called for a couple years in advance
Based on the mars Uranus as well as the Saturn Uranus cycle .
So I’ll agree the Fed has some influence yet at the end of the day
They are trend following and nothing more .
I’ll agree on the A. B C decline and I’ll agree the money printing from all central
Banks had an influence but the pattern was dead on exact .
Prechter has written about the 3 peaks domed house pattern in his newsletter
He attempted to claim its an Elliott wave pattern but it is not an Elliott wave pattern .
The late George Lindsay was the originator or this pattern from what I understand
And while it is more typical for this to be a 2 year pattern it ended up taking 10
Years for this to play out .
Anyone remember the 3 amigo’s headline ( I think time magazine )
it was 1997 or 1998 ( the Asian crisis )
They claimed the Fed saved the day !
That was before the year 2000 top .
Social mood rules the day
https://i.imgur.com/cZtkCVV.jpg
10 plus years to play out is more accurate
It blew me away following it and it was
One of my favorite trading time periods
Because it was exact
Correction
” Three marketeers ”
http://content.time.com/time/world/article/0,8599,2054093,00.html
http://tse2.mm.bing.net/th?id=OIP.oJEWis3KLbe-VIRsgc-ZJwHaJw&w=202&h=266&c=7&o=5&dpr=2.5&pid=1.7
Yes and no 🙂
You put it perfectly Peter .
Thanks Peter for the update:
I have a top April 1-2 and the next turn is April 10.
Thank you.
3 peaks and domed model looks very much like what we have currently and possibly going forward..good pic
Thanks Marie
The 3 peaks domed house pattern if I was to get very technical
has very specific rules attached to it if I was to quote Lindsay .
Ill paraphrase though .
From point 3 to point 7 typically takes 8 to 10 months
how ever some say it can be from 6 to 8 months
Point 6 must go below point 4 and point 7 can go above both points
3 and 5 . Point 10 also must go below both points 4 and 6 .
Once you get to point 14 you look for a rally lasting 7 months and 10 days
yet some say you can count from point 10, 7 months and 10 days .
I, however have used this pattern on as small as 1 minute charts so while
the specifics based on George Lindsay’s explanation are very detailed
I have seen the pattern play out in many time frames .
Lindsay was an artist and he based a lot of his work and having the right look.
Elliott wave theory also uses ” the right look ”
You never want to call point 15 to early.
From what I’m looking at this morning the futures look destined to make a new high above the Feb. 2019 highs yet or the cash dow to do so it would take a 300 plus point move.
None of the Major dow stock groups i’m looking are even close to testing their respective march 2019 highs let alone the Feb. 2019 highs .
This run is being driven primarily by : MCD, CAT, TRV, DIS, NKE, WBA,INTC
That group is sitting pretty much at its feb 25 highs yet a long ways below its dec 2018 all time highs .
This has SUCKERS written all over it .
I always give the market at the very least 30 minutes before making any trades.
Strange day as far as im concerned
Nice to see the 30-35 minute mark from the open
working yet I waited to see if we would get a 5 waver on a 1 minute chart
and im not seeing it .
Last week I said if this week was not a down week I would abandon my short term bearish bias .
As much as this market looks like a suckers rally to me this morning I must accept
what the market price is doing .
No 5 waves to the downside which implies to me that late april- early may
might be the next time frame to look for a bearish trade.
Being long stocks my reason to be short is for hedging purposes only at this point in time.
PG showing a slight down open this morning
Everything looks like a B wave rally from the March 11 2019 and march 25 lows to me .
Weekly Dow chart Close only :
Week of Feb 18th close : 26031.81
Week of Feb 25 Close : 26026.32
Week of Jan 22 2018 Close: 26616.71
Week of Sept 17 2018 Close : 26743.50
Current price : ( not a closing number ) 26154.79
Of the 69 stocks I own 13 are down and 56 are up
56 / 69 = 81.15 % up
the downers being down minimal as im up 1.11 % on the day which I better
than both the dow , spx and ndx
Banking sector is strong today as is the semi’s and some materials .
Slight selling going on but I see nothing solid to make a short term bearish case
Peter T – Kudos on a great call and thank you for all your time and efforts
.
I agree..looks like we MUST face reality that the bottom was in..last dec..
That wuz the best buying opp in a long time..all signs imma seeing are pointin to new all time highs..VERY SOON!
Goin to be addin more long exposure if SPX..can break 2880..this looks like a new bull cycle that could last into 2021-2.
SPX..gettin closer..to my 2880 target..
Could there b anotha ext to 2900..is the next question?
Then 2940..&2950 could b magnets! New all time highs could b sooner than i was plannin!
I think we have met Peter T’s new highs so could start moving down now but waiting for now. I’m not jumping in long at this moment as the risk reward is not favourable.
SIR PETER been saying a drop for many months..that hasnt played out..personally not sure his count is correct..don’t rule it out but not seein a bearish case whatsoeva right now..
Thought maybe it was in a pattern similar..to 2015 & 2016 but with todays continued bullishness that looks VERY unlikely..plus we had a bullish golden cross today on SPX so imma back to 100% long.
Possible (1) complete in GLD..lets see what the bounce is…
Dollar..should head down..so thats setting up for a bullish..pattern in gold..also oil too..adding some long energy & materials..on expected lower $.
Charles
I tend to agree the dec lows were an important bottom .
CSX dec low 58.47
Today 76.70
31 % move off the lows and at All Time Highs
weekly chart showing some bearish divergence
Yearly chart becoming overbought .
I don’t want to over stay my position here yet for now im holding .
Long from just under 60 ( includes commission )
Target is 91.21 and an inverted head and shoulders target is 92.23
Regardless of targets I will be raising stop as time runs out .
Xom target is right around 100 yet anything above 95.55 satisfies me.
say a poke above 90 and ill cover 1/3 of my position .
long dec 26th on this one as well .
I have several stocks im looking to close that I have held fort a long time
some have been thinned over time , others not thinned yet
when targets are being hit I exit .
Im still thinking a mid August to early sept high at this point in time
and I cant rule out an early January 2020 high either .
2020 though I’m not seeing as bullish and I have many cycles
running in 2020-2021 as cycle lows .
I have no problem buying or selling or even just thinning over time to reduce
risk .
I will not be adding any long positions this year .
I did my buying in sept on the gold and silver stocks ( nothing great at this point yet no losses overall )
the rest of the buying Dec 26th because I missed the close on Dec 24th.
Its easy to hold with a fairly wide stop .
My worst buy in dec was BMY its my only loser and ill give it a bit of room
only because the others offset it in a huge way yet it should probably be brought out to the wood shed and shot . I happen to like Celgene and doubled my money on it several years ago . The buyout though was not part of my reasons for buying and it does change the picture .
Healthcare in general looks weak to me .
Yeh Mr Joe..imma thinkin this must still b 3rd wave as we are def goin to new all time highs based on all the info imma seein.
Was hopin SIR PETERS bearish predict would come into play BUT that’s looking far less likely..with all the bullish momo.
Ive seen some divergence..but nothing bearish..to take markets down to 2200..
so up this market will go! Imma think we get slight new all time highs..then maybe 4th wave in 2020..will need to be a much sharper drop then..but dont see the big drop soon..we are in 1 of the strongest seasonal times of year now..maybe crash in Fall?
Charles the interesting thing is in what you say. YOU don’t see what there is out there bearish enough to take stocks to 2200 and that’s the key point. 99% of us won’t see it and then it will happen suddenly and we will be scrambling to close longs and/or go short. The market’s trick is to convince the majority that the next move is almost certain and that’s when the reversal will happen. And I’m sure one day the reversal will be the start of the long awaited bear market and that will catch many out. The technicals look bullish but the economic data I’m looking at is rapidly worsening. I won’t be surprised to see an explosive VIX rally and plunge in stocks for he catch up trade. Following that the central banks will fire off their last remaining ammo to send risk assets soaring again and then the time to pray that things get better because…well I think peter T has explained well enough what is going to happen.
When a market discounts..bad news..its a bull market..
Economic data is strong nuff..to support..higher stock prices..for now..
Once..spx..gets past 3K..it becomes mildly overvalued..but forward PEs are in line with historical norms..
..on tech side..until we close below 2805..or take out 2785 support zone..the trend is up..up..& away.. golden cross of 50 ova 200 now..& unless SPX suddenly drops below 50 & 200 handle..i remain bullish.
I called 2800..2850..& 2880..just 9 points away. So i think i know whut imma talkin bout..
Yes..black swan..could come outta nowhere..but odds are low of that..now. In 2nd most bullish season with strong momo..good technicals..& solid fundamental..which all play into the bullish case..
Only fools..willing to part with their $ would be heavily short @ this time..yeh maybe a lottery pick..or two..if you wanna try & catch some surprise down move..but my $ is as long..as long can be..without using margin..of course..hardy har ha!
Also think..many analysts missed the clear a..b..c down from Sep..to..Oct.. looks like a perfect..V..recovery now..reminds me of 2011..worst is behind us now IMHO
Charles
I bought the dec lows because of my own research and oscillators
it was a rare oversold reading .
Time wise I was looking at jan 4 as well as jan 20 .
I jumped in early because of the oscillators and figured I could ride
out a few % decline or a sideways move by using stocks vs futures or
options.
Id say I was educationally Lucky buying the bottom.
Todays move leaves me mixed on a few things wave count wise
The bearish divergences I mentioned near the open are gaping wide
divergences and honestly I cannot explain away my original wave count
using a daily chart unless I move backwards to the Jan 25th high as well as the Feb. 5th 6th highs .
The weekly chart is a different story .
I have a problem being wrong yet I’m smart enough to except being wrong.
All I can say is in my opinion it is to early to label the weekly chart .
Nothing I’m looking at is confirming this move .
Back to my end of April thinking for the next swing high to go short. In the mean time ill move up my stops to protect myself in the event of a steep decline yet honestly ill gladly let this market run higher and figure out the wave count later .
Peter T has done an excellent job Navigating this market
Added note :
I might be seeing gaping divergences yet just as I mentioned near the open the futures implied a possible 300 point cash dow move today . What im looking at
is implying new all time highs fairly soon .
I am Bullish I’m just not leveraged .
The market is following the weekly chart I posted in the prior thread yet at this point ill believe it when I see it . No adding positions for me for the entire year.
I made my bed in December and I will sell portions along the way .
Still think we get a down month of MAY .
Ill see what I think 29 calendar days from now .
May 25-27 and June 3rd ( the entire time frame ) Matter A LOT to me .
My Preference is that it is a swing low .
That is all I have to add .
Enjoy the week everyone
Thank you Peter T for This Blog
Thank u Mr Joe..imma see the same thing..lots of bullish signs pointing to new highs..spx..should hit 2880 this week then..up to 2895..then we should flirt with 2900..2940..and 2950!
I do..see a few divergences..but minor..until bottom trend lines are breached..imma staying long..
Da bull is in charge..for the next couple months IMHO!
I think..many of the bearish analysts..bout to get egg on thy face..once new ATHs are here again.
Do you have to criticize everyone all the time?
I believe the criticizing of others is what created my previous outbursts rather than his projections. I realise that now but I assume it’s just something we have to live with. Maybe when the market turns down the criticizing will stop as we will be on the same side.
In the meantime, moderation is back on. I get really tired of it and it has no place here.
Well we now need to give Charles his due. Despite my disagreement with his bullish calls, we must admit he was right. His new nickname should be big kahunas. Many of us here have been very bearish but it’s been foolish. I personally missed a 500 point run on S&P 500 and thousands of Dow and Nasdaq points. As a bear I’m throwing in the towel! Closing my short positions taking my losses like a man. Will start easing back into stocks.
“forensic psychologists would have a field day with trolls…their need for ‘negative’ attention speaks volumes about their character (or lack thereof)…obvious cowards who can only thrive because of the anonymity afforded to them on social media…”
~ rotrot | 6:18 AM – 17 Jun 2018
https://twitter.com/allerotrot/status/1008292833239977984
“synonyms for coward: weakling, namby-pamby, scaredy-cat, yellow-belly, sissy, candy-ass”
~ rotrot | 6:02 AM – 18 Jun 2018
https://twitter.com/allerotrot/status/1008651089900703744
I’m not sure what your post is referring to. Maybe you posted on wrong blog?
Exiting long calls today as we are scant points from upside target of 2875.00
Awesome run!
Hope traders were able to take advantage of the thrust from the coiling sideways consolidation. Best of luck to all when the wedge decisively breaks to the downside!
Thx Mr Verne..u rock! Whatta awesome trade..u r!
Yeh, low VOL diagonal very uninviting. I posted this elsewhere this morning…
20 of the DOW30 stocks have RSI2 >90; 19 of the ETF30 tactical have RSI >90. When these numbers get in the 20s, market often stalls or corrects (even if just a little). FOMO and BTFD be damned, I’m not buying… best trading to all!
I’ve seen many analysts now saying new highs are inevitable for the US markets. ES is about 50 points away from that. Very bizarre.
Looks like crypto has blasted off again. BTC has made a very nice break out.
Luri – are we away to a new high
Oh my heavens, it looks like Charles was right. 2880 was hit overnight. Peter do you think your count may be wrong? S&P 500, Dow, and Nasdaq all getting close to all time highs now.
Thanks,
Bern
Who would’ve thunk it? Charles called it! 2,880 is here. I thought he was crazy. Good job Charles! Hope you made a lot of money.
Hi all. I’m new to Elliott Wave. I keep wondering how the markets can keep catapulting yet the count is calling for a big drop. I’ve been waiting months and months on a drop following this blog. Now there’s been a 500-point move up that I’ve missed waiting and waiting. Something seems amiss! Not to be mean, but what’s the point of using counts if we can’t make profit? My short positions are deep in the red!
Sorry I’m just frustrated and needed to vent.
– Milo
Charles you were right on with 2,880, but I’m personally not convinced that ES will get to new highs. I still think Peter’s result will play out. We must be patient! He spends many, many hours of analysis and he says it’s going to drop, I believe him…..
Folks, this particular blog happens to be a “free” blog. You get one chart of ES (a daily), along with other ones, when appropriate. You get a small subset of my analysis … a very small one. I have said time and again, that if you don’t look at other assets in this market, you’ll be lost (particularly the US Dollar).
You don’t get the hourly charts I do up every night across about ten assets, with targets and other information to more accurately define the road ahead. And yet some people continually think I’m going to provide all this information and the many hours I put into analysis for free.
There are no surprises at to where we are right now (as far as I’m concerned). I’ve provided lots of info on the dollar and saying that everything will turn based upon it. I’ve provided a lot more info for free. If you want understand Elliott Wave better, there’s a book in the books list on my site.
If you want to know more details about what’s going on, there’s a Chart Show every week for just $19 in which I take you right through the market, right down to 5 minute charts, if necessary. All that information is accessible, just not for free.
You can lead a horse to water …
Leading horses to water is what the Professor does for young impressionable minds 😉 Tomorrow’s future. Lol
Any who, I’ve been watching from a distance and agree with Peter. This puppy will come back down soon. Yes, Charles was right on a few targets (kudos) but does he spend the countless hours of analysis that Mr. Temple does? I think not!
I concur that there are more “markets” than just the S&P, which after all is just 500 companies out of thousands in the world. To get a complete picture, one must examine the underlying evidence: does this look like a healthy bull market? Or is it a trap for the bulls? FWIW, my money is on the trap!
Wow! I leave da room..for 10 min & evrybody talkin bout me!
Thx peeps! I appreciate u recognizing me targets..but they are jus good ole fashion chartin & forecastin that ive been doin 4 ova 25 yrs.
This FREE blog..is bout EW..not me!
& yes i wuz right..i dont claim to have the magic sauce..jus sumtin that works 4 me..
U must b free thinkers..dont b a lemming..think 4 ur self & as SIR PETER says trade whut u see..not whut you think..
I tend 2 follow price action..& thats why ive been long!
Nice one Charles! It made to your target. I would also like to congratulate Peter T as he clearly stated at the weekend we will see a new high. Funny how a lot here are only congratulating Charles but our own host Peter T gets nothing. Hmmmm…..
haha … thanks, Q. We get used to it.
Several of us have pointed out that, though Charles may be right short term, we are banking on Peter’s analysis being more accurate long-term. Thank you Peter!
Well Charles did give his 2,850 and 2,880 targets months ago so I think that’s why I was surprised. No harm with Peter Temple, I just personally haven’t been able to make any money shorting the market based on his bearish analysis. I take the blame, but it looked like we had topped many, many times and Charles kept telling us it would go higher.
Even if the waves are “labeled” corrective: How could most of us miss the 500-points to the upside. I don’t care what you call the waves, that’s a huge run that many of us missed out on waiting for a low that was below December lows. It still may come to fruition but missing that huge run doesn’t give me a lot of faith on ways to trade EW. At least Charles’ technical approach got him long in low 2600s so he could ride wave up to wherever it may go. That’s why I applauded him.
Thank you,
Bern
I’m convinced nobody reads what I take a lot of time to write: https://worldcyclesinstitute.com/bear-market-rallies-a-taste-of-whats-to-come/
Bern, I think you are going to be O.K!
Hang in there. APPLY, what you are learning! 🙂
Milo:
If you want to be a successful trader, you MUST develop you own disciplined system for entering and exiting trades.
If you depend ONLY on the opinions of others, that is a guranteed path to losses and frustration. It sounds to me like you are trading without stop losses, which violates the most fundamental rule of trading. As Steve Nison often told his students, there should ALWAYS be a number that tells you you are WRONG!
Sad to hear about your losses. Hopefully it will be part of your maturation as a trader.
We have all been there, so don’t give up. Learn and adapt!
Wisha ..coulda.. shoulda..easy to look back and say those things..but when a correction is unfolding..each time a new set of corrections tags on was a point that the market could also drop..so easy to look back and say..wisha coulda shoulda
During corrections..best thing to do is day trade or short term trade..until the trend is clear…but happy for those who got in one the ride up!
Peter T
You are correct that people don’t always read what you take a lot
of time to write .
I’ll expand on this by saying back in 2003 to 2007 I did a bit of research on this subject. What I discovered was : The people who are bearish will cheer a bearish
report and the traffic to the site will rise , The bullish people will fade away .
Then you can write a Bullish report and those who are bullish will flock to the site and those who are bearish will fade .
Basically people read what they want to hear . Its a bit sad because there is so much they could learn by reading every word .
I Read every word you write and at times I read your posts several times .
I also go to your main page : https://worldcyclesinstitute.com/
and I watch your video’s .
There is a lot of info on this site .
I will add, that I have been using this site for around 4 years now and have found peter to be very good at navigating this market .
He has kept me in check on several occasions.
There is a huge difference between a blog post that takes at the least 4 hours to think out and write each week ( imagine all the time deciphering all the currencies along with the various index’s before writing ) .
The huge difference between 1 post each week which is detailed yet also somewhat broad vs a continuous update though out the week is that you get
current info that was not available prior to the original post .
Back in the day of monthly newsletters, imagine the time and effort by those writers who were trying to navigate the market for a month and take in the time it took for it to go out in the mail and then get delivered before even being read.
the time lag was huge . If something went wrong the emergency mkt update would go out and again a big delay .
Today having a free blog we do get a weekly free report from peter and I would ask all of us to try to write up our own thoughts looking out for just 1 week and write it up for yourself and try to base it on anything you wish .
then at weeks end see how much of what you write was correct or not .
Peter T has chosen the Elliott wave theory for his chosen method and he does so
in a very detailed manner . After 4 years of reading his posts I can say I only look at 2 Elliott wave sites . Peter T has done an excellent job .
In a Bull Market those who are bullish claim to be genius ( not to offend Charles who says he trades every single day )
When the Bear Markets come those bulls disappear .
It takes more guts to short the market then it does to buy and go long for obvious reasons .
In a bull market or even a bullish trend its easy to call for a higher price target as it will eventually get hit .
Bear Markets are a different vehicle ( Not everything goes to Zero )
Bernie Manson :
Your point is well taken but id like to remind you of one thing before you abandon or discredit Elliott wave theory .
Go back to lasts years posts that peter T has posted and re read even the latest posts on this thread . What he was calling for was and is a 4th wave with an eventual 5th wave to new all time highs . Last year there was even some targets into March of 2019 . Additionally on this thread he notes that the DOW needed another new high which has now been achieved .
I’m not going to get into a Charles debate . I will say I have no issue with anyone’s personal thoughts on the market . My only wish is that they can state the reasons for those thoughts .
Verne states his reasons , as do many others as does Peter T .
I will be the first to admit I get it wrong all the time . we ( I ) do not post what I think every week as Peter T does . we can all go quiet nd then claim after the fact we were right ( or someone else was wrong )
Verne many months ago said people should post their actual trades as they make them ( to keep them honest I suppose ) and he has posted many trades he has made somewhat real time .
There are others who posts trades as well but Verne has posted the most in my opinion .
The 24,000 area on the cash dow is the lower support level for me long term .
Shorter term this looks like a B wave and I don’t trust it .
Should I I say dow 30,000 before this year ends and then claim see I told you ?
I have only touted Price targets a few times on this site . NVDA 180 was a price target when it was rising . I explained my reasoning . when it hit 180 I sold some
and left a small portion on the table . it continued to run much higher than I expected and then completely crashed back in 2018 . Its now at 189.90
and I still hold that small portion . was I an idiot to hold though all of that craziness ? Maybe, but it is up to all of us to decide what our own risk reward is and how much pain we can handle .
There is a difference between holding a stock at huge gains that is essentially free because you thinned it out and left some of your profits in it vs buying the stock and watching your money disappear.
Peter T ill stand up for any day of the week .
If you want to get in on all of his insights you will need to sign up to his Chart Show.
A single trade can pay for a complete year of the cost .
Please Please Please , Lets keep this chat room educational .
I have gained some very good info from many of the posts on this site .
Peter T
Thank you for allowing me to post .
Joe ( not anonymous by the way )
Thank u Mr Joe..ive posted many of my trades in real time..in reality..im really neither a bull or a bear..BUT rather a trend follower..right now imma bullish because thats the direction..to trade..i swim with the stream..NOT against it..til major support levels & my indicators tip the opposite way..
dont always get the exact top or bottom..but catch enuff points in right direction..to make some good booty!
then..every day i follow the trends too..either long or short..i dont frankly care nor do i allow emotion or news to sway my daily direction..simply follow price action..place my targets & stops & let good ole Mr Market do his thing!
Long term..i make directional trades..based on support & resistance zones.. bollinger bands..rsi..macd..abletrend..fib ratios..& ew waves counts.. Ive nailed some major highs & lows..so i knows what im doin.. dont discount SIR PETER..his analysis..helps keep us outta trouble..but timing is always tough & dats where my process allows me to make the moola!
and agreed..the chart show is excellent…def helps with direction..
Last post for me
Part of why I bought stocks back at the Dec lows
I myself had a downside target of 21,560 on the cash Dow
And Peter T for the most part had a similar target with the ES
I had to go with my own work in the end to pull the trigger but
I’d say his broad view was dead on .
https://worldcyclesinstitute.com/the-market-it-aint-over-til-its-over/
I will miss you Joe.
Some have called me a “jerk” and “arrogant” for suggesting that posters trade their talk. On the contrary, if you DON’T trade your opinion, in my opinion you have absolutely no credibility and are just blowing hot air. I have never learned more about trading than when I have been WRONG! I have lost count of how many times that has been true!
Best of success to all!
I agree..Mr Verne..SO many criticize me on here..YET they nvr post their trades..most r a buncha skullywags..so i dont mind BUT like me teachers useta say..show ur work!
I like SIR PETERS blog cuz we can share ideas..EW is a great science that brings many dif points a view 2gether.
Worth reading
I’m only just begining to follow currencies more closely .
I have begun this process because of Peter T
https://www.armstrongeconomics.com/international-news/europes-current-economy/pm-may-to-join-left-against-her-own-party/
Verne and Charles
I’m not going away
I agree with both of you on many aspects .
I have become a longer term swing trader so I rarely post
My actual trades real time .
That will change when this market turns to the downside .
Bear markets are fast and keeping on track is very important .
Options trading is even faster and trading the futures brings instant
Success or failure .
I have traded just about everything at one point in time and I have traded
Very very short term . Over time though and in regard to my work which
Takes me on the ocean . It’s difficult to do my job and trade short term at the same time.
Loss of internet reception as well as cell phone reception plays into this .
My own style has changed and at the moment it works for me .
Not saying it will work for others though .
My basic strategy is buying fundementally undervalued stocks that are at the least
40% under priced and I only buy them when the cycles are near or at a cycle bottom .
I ride the uptrend cycle and at a cycle peak I either close the position or thin it depending on
Where the market sits based on the wave count .
In a bear market this method will fail badly . Fundementals only work in a bull market .
I have found by doing this I only select specific stocks that meet a defined set of rules
And in doing so there are times when I can not find anything that fits the parameters
Regardless of a cycle low .
I found 16 back in December and bought them all . BMY is the only stock that failed to work .
In a bear market cycle fundementals do not matter . All stocks will decline regardless .
They throw the baby out with the bath water so to speak .
I use a specific software and pay 50 bucks a month to access values on stocks .
I do not base my purchases on what I read online .
Almost every so called ” undervalued ” stock I have read about and checked out
After reading about it online has been grossly over vvalued .
Timing and my own custom made occilators which I created myself and back tested
Going back to 1928 using the Dow , daily, weekly , monthly and a 36 trade day chart
Has served me well . I use the Dow only because I have the hisoey and because it’s much
Easier to break down the 30 stocks vs trying to programm the 500 stocks in the spx.
The problem that arrises is that charting systems will not let you use the data you need .
My computer can handle the load but my data provider won’t allow me to put that many
Symbols into my software with out paying through the nose .
That was not an issue back in the early 1990’s when I was limited to 850 symbols where as
Now I’m limited to 50. As it stands today I have closer to 150 sysmbols I’m following and
Every time I open the software I’m told I’m over my limit .
Next : they have reduced the amount of sysmbols I can use to make a spread .
I used to be able to use 50 now though it’s closer to 30 .
When I look around at the various brokerages so I can go automated and actually
Put all my formulas together I keep running into this same issue .
I have the software I want to use lined up . My total cost for the software
Will run close to $ 3800- 5600 once I’m complete but with out the needed data
I’m stuck using excell which means manual data input and that’s not going to work
For day trading .
My system works, it’s access to data that stalls me from moving forward .
Add in the constant technology changes and you can end up in tech hell.
Basic technical analysis works but with everyone looking at the same thing I feel most
Are at a disadvantage . Most basic indicators are useless in my opinion which is why
I created my own. What I used I created by modifying other indicators because the as is
Indicators based on history were not consistant .
Timing is another issue I have run into . I have tested and back tested many timing methods
And I have come to a few conclusions which I’m not going to comment on only because
I don’t want to write 14 pages on it .
The US dollar Peter T has mentioned many many times and I posted the link above
To create a bit of thought as to what is going on presently .
I should have said my last post for the day .
🙂
Enjoy the week everyone
Charles
I think your using tradestation
Not sure if you use tradestation brokerage
I think you mentioned altering your algorithm ( fine tuned I’ll assume )
You mentioned this several months ago.
I only mention this because it tells me you have done a few studies of your own.
Are you limited to a specific number of symbols ?
I’m just curious .
I use..trade station & stockcharts for alotta my chartin.. yeh my algorithm is fined tuned now..testin wuz why i disappeared 4 a while..not cuz the mkt went down like many suspected..hardy har ha!
i trade mostly futures & options on SPX & NQ..but track about 150-200 stocks..using mostly RS..its good in a rising mkt..not so much in a declining 1 as momo stocks get sold 1st & have the deepest pullbacks..
Ive done a TON of studies..numbers r my specialty 🙂
Tech stocks are my fav..also have lots of reits too..& health care..
Outstanding points Joe and I am so glad you pointed those things out.
The kind of analysis you use will very much depend on your trading personality.
Investing, is different from swing trading, is different from day trading. So right about futures. I will often use them to hedge against temporary draw-down on a conviction trade that temporarily moves against me and it works wonders when used for that purpose since you can trade ’em virtually around the clock. From reading some of the frustrated posts, I get the impression that active traders are trying to use EW to day or swing trade the market. I have not met too many EW analysts that offer the kind of precision you need to successfully day-trade their counts. Most of what I see is total crap. Period! Frankly, even attempting to swing trade most of the counts I see without some other complimentary methodology to guide entry and exits is going to be a loosing proposition, unless you are an expert with EW, which most of are clearly are not. It is kind of stunning to me that some folk will read a general treatment of EW posted on a free blog like Peter’s, and somehow assume they can just blindly apply that information and risk their hard earned capital in executing trades without doing their own due diligence. I in no way intend this to be critical of those who made that sad mistake. My hope is that those who have will have learned from the experience!
I don’t want to blab interminably but I posted my RIOT trade a few months ago when I picked up the 1.00 strike calls for 1.60, sold half, and took delivery on half with the intention of selling covered calls against my long position in the shares.
That was clearly a swing trade and for weeks went absolutely nowhere but I did not loose any sleep. You can see what price has done of late so I need not elaborate.
I cite that as example to point out another important aspect of trading, and that is having the proper time horizon to allow the trade to pay off. O.K. I’m done!
The problem is not very complicated folks. If you trade against the trend, you WILL loose! (unless you employ a method designed to sucessfully execute counter-trend trades). Since the December 26 low, the trend has been UP…and that is undeniably still the case thus far. Get the immediate trend wrong, then nothing else really matters. The TREND, is your friend!
I def trade different than some of you..but want to example of how I use EW..
during the last year…in times like this like the last year people were edgy..so I used EW counting..on the 1min and 5 min charts to recognize impulsive or corrective on the DOW or SPX..then when my oscillators..told me.I bought or sold volatility up or down…. I never held ..just in and out on the leg…so I know EW it can get very frustrating and I can tell you when I was learning it I wanted to quit sooooo many times and lost money learning it..I do the same for tbt, tlt..etc..but if you take the time to learn it and let Peter guide you through because it is verrrrry hard to count corrections especially long ones in the big picture…you will find it very useful …in the short counts it does help if you try to learn it..but nothing is perfect.
I know in previous posts we were discussing the Wilshire…
It did pass the first upper trend line that was suppose to be the hard line from FEB 2018 and MACD crossed up for now
and mixed on Oscillators..rsi..slight divergence..but Ultimate..no divergence yet
Great info Marie. Thanks for sharing that. It is true that EW is supposed to work in all time frames and at all degrees since the waves are fractally iterative. I can see how with practice one could use it to execute day trades.
I don’t think of EW so much in terms of predictability as I do probability, and so my thinking in this regard is different from Peter’s.
When I think of scientific predictability, that implies certitude and that one could enter a trade with reckless abandon. On the other hand, thinking in terms of probability necessarily requires caution, and an understanding that it is possible one might be incorrect, even if only in the application of one’s method and interpretation of its signals. It seems to me the key thing once one has established the immediate trend is to gauge the most probably outcome of three possibilities.
1. The trend continuing.
2.The trend pausing, with sideways action.
3. The trend reversing.
Effective analysis, in my humble opinion, should allow a trader to determine the highest PROBABLE outcome of the three. I have never seen any analytical method that accomplishes this with 100% accuracy, hence my preference of thinking in terms of probability as opposed to predictability. Just my two pence.
exactly
For even the most bullish count, this market is more than overdue for a real correction.
Its failure to really do so after the Dec lows in my view argues in favor of Peter’s contention that the wave is corrective. Strangely enough the higher it has gone the more bullish folk have become with some actually changing their outlook from corrective to impulse. My reaction has been the exact opposite, with the continuing failure to retrace making me progressively more bearish. This current move up is classic C (of a likely larger B) wave behaviour. I have a healthy respect for the ability of the bankster cabal to drive market price, and consider their actions to be the dominant driving force in global markets today. The relentless series of three wave market moves is their foot-print. Their Achilles Heel is volatility. They can suppress it for only so long. Making great trades is also often a matter of recognizing pricing anomalies in the market. We are now looking at a glaring case.
Buying a truckload of TVIX.
I agree Verne. My EW knowledge limited (that’s why I like Peter T’s work), but this (never) ending diagonal leaves me moving in TVIX direction too. But indicators look overbought, then market just quiets down until indicators back off. Major markets broke below trend line support as VIX got to 14, then it came back in. I just know I am NOT going long in a big way right now.
Im going to say Elliott wave theory does work in all time frames
and ill also say that unless your staring at the screen all day every day
you will lose track of the wave count.
I look at larger time frame mostly because its simpler for me .
Peter T looks at larger time frames as well as minute time frames and he has
done an excellent job .
The SOX index made new all time highs yesterday .
Looking at a Yearly chart 1776-1792 looks possible to me yet
im looking at a Quarterly chart so it may take a long time to get there .
INTC : up near 60 ?? or new all time highs coming ( long term )
Semi’s I see as a 5th wave of a 3rd wave ( Yearly Chart )
Verne, Charles , Marie
Thanks for the input .
INTC – I’d be looking for a first wave down. SOX looks really scary, as well.
Thanks for the kind words … in an incredibly difficult market overall.
BPCOMPQ…clearly a series of lower highs that are diverging negatively with NASDAQ and NDX price action…not shown is a proprietary BPCOMPQ chart with indicators that signaled a short term change-in-trend today…
https://twitter.com/allerotrot/status/1113897453080727552
What I have done in the past ( and still today )
when I trade on a short term time frames
is I use Monthly charts and weekly charts and daily charts .
I also used close only charts and bar charts .
I watch for the wave counts to complete in all time frames .
I favor closing prices in a big way .
Not saying im right or wrong but to me the close is more important
than anything .
Verne
I have been watching Riot ever since you mentioned it .
I have also been following NIO
I view them both as spec type trades and you did explain your reasons for the trade
Glad to hear you took some money off the table and let the rest run .
as far as a deep correction : I still favor a late may early june low .
Specifically may 25-27 and June 3rd .
Its part of a Reversal setup so for me that will be an important time frame .
At some point probably Late April early May will be forced to Hedge if not outright short the market .
We will see how the month of MAY goes soon enough yet from my view
it must be bearish or im off on a few things time wise .
Selling covered calls against the long RIOT shares has worked well.
Believe it or not, the deep in the money calls have already more than paid me for the long shares I am holding. I am looking to buy back short calls if we get close to the 4.00 level and then rinse and repeat. I think that puppy still has some more frisky! Lol!
Look at $NDX Yearly Bar Chart or Candle .
It might give a different view .
wave 1 2 and 3 into the year 2000 top
wave 4 the 2002 lows
wave I into the 2007 high
Wave II into the 2009 Lows
We can debate this but , Wave III ( yearly chart mind you ) Since 2008
So A DEEP WAVE 4 is still due .
Peter T is on track as far as im concerned
but …. Where would a yearly wave III end if this was true based on the yearly chart on NDX ? 8414-9131 NDX This year ?
It May sound crazy but its possible ( Not a forecast by any means )
Wave II On NDX was 2008 lows ( not 2009 )
So far as how much higher this market can climb, I think it is interesting that we are now at just over 90% of the A wave down to the December lows thus fulfilling the requirement for a “B” wave of a flat correction. I don’t think we are quite done, but as one who also pays close attention to volatility, note that the VIX low of 3/19 has not been taken out on these new S&P500 highs. This has huge implications for the risk/parity trade and I find it fascinating that so few giddy bulls are paying any attention to this bearish (among many others) divergence. In my opinion a tag of the round number magnet of 2900 is definitely not out of the question. From one trader’s point of view, such an event would be one of the most auspicious triggers for a foray into the dark side that I have seen in quite some time. If we do indeed get a C wave down, and NOT a second wave as so many bullish folk are expecting, it is going to be a Hell-raiser!
These kinds of trading set-ups do not come around very often.
You really only see them two or three times a year.
Whether you have to beg, borrow, or steal good guidance in order to ensure taking advantage of the coming opportunity, don’t miss it folk! Mr. Market is going to give those of you who got slammed on earlier trades an early Christmas present.
Best of luck! Later! 🙂
And, unfortunately, it will decimate the Canadian Oil industry, which I’ve been warning about for years, but not a soul will listen to me. I’m projecting US oil to drop to about $25 or lower still to maybe even $20. Canadian oil is going for about 13-17 dollars now and everyone up here is yelling about building more pipelines … when there’s simply no demand.
Joe…I think I mentioned this before..there is a Long crab going back to 2000 in the NDX
the X to D leg is a almost perfect 1.618..to the 2018..
so who knows..you could be right…
This website is for educational purposes relating to Elliott Wave, natural cycles, and the Quantum Revolution (Great Awakening). I welcome questions or comments about any of these subjects. Due to a heavy schedule, I may not have the time to answer questions that relate to my area of expertise.
I reserve the right to remove any comment that is deemed negative, is unhelpful, or off-topic. Such comments may be removed.
Want to comment? You need to be logged in to comment. You can register here.