
If you know anything about Elliott waves, it’s probably that there are two types of waves: “motive” and “corrective.” Motive waves are in 5 waves (trending waves) and corrective waves are in three waves (moving counter to the trend, or “countertrend”). Motive waves advance the trend through having a larger number of waves than corrective waves. Within those five waves are two “corrective waves” (waves 2 and 4). These two subwaves have three subwaves themselves.
The term “motive waves” is a “catch-all” for waves with five subwaves, and include diagonals. Ending diagonals can be found in both corrective waves and motive waves (ending diagonals only appear in the fifth and final wave in either). However, diagonal waves contain five waves that overlap (they could really be considered as corrective waves, even though they’re included within the motive wave definition).
On the left (click to expand) is a diagram of an “impulsive” wave. Impulsive waves are motive waves (contain 5 subwaves) that do not overlap. They must adhere to the following rules:
- Wave 4 cannot enter the price area of wave 1 (they do not overlap)
- Waves 1, 3, and 5 must contain 5 impulsive subwaves themselves.
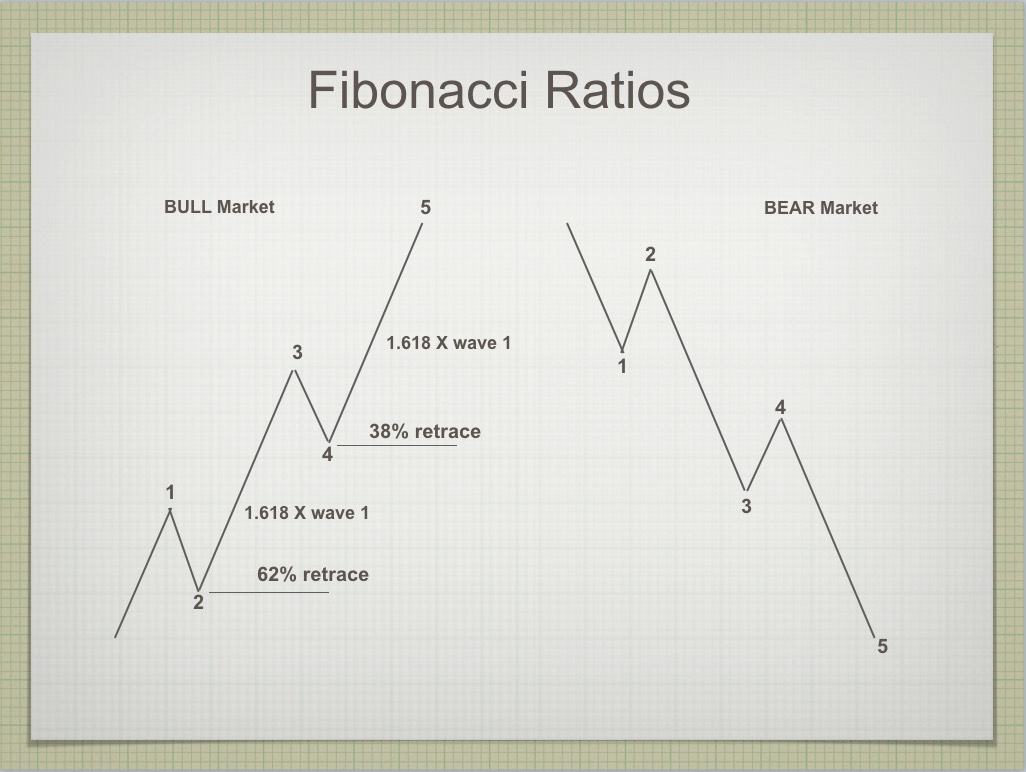
Let me add that the second wave of an impulsive sequence must retrace 62% of the first wave. Wave 4 must retrace 38% of the length of the first three waves combined. (These two rules are not found in The Elliott Wave Principle, by Prechter and Frost, but are based upon my extensive time spent in observing Elliott wave structure in the market itself).
If you’re been with me for any length of time, you might remember waiting for a large turndown by all the major indices, but having to wait for the NYSE index to retrace exactly 62% in a second wave before all the other indices could complete their turn.
In terms of wavelengths of impulsive waves go, wave 3 is almost always 1.618 or 2.618 times the length of the first wave (we call the latter measurement an extension). Wave 5 is almost always 1.1618 times the length of the first wave. Wave 5 can also extend on occasion.
Summary: So the word “impulsive” and “motive” are often interchangeable, other than the fact that “motive” can include an ending diagonal, because even though the structure of an ending diagonal appears corrective, it is often found at the end of an otherwise motive sequence. Odd, but true.
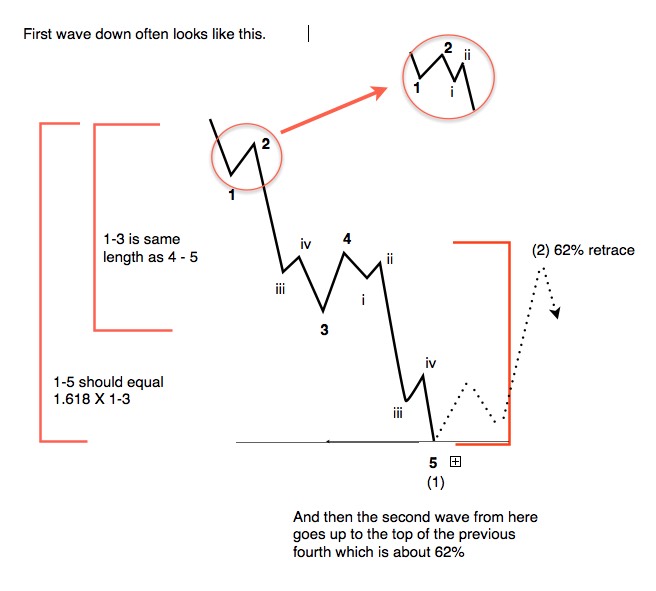 There is one exception to the structure of an impulsive sequence. This is found in a first wave (diagram on the left). Wave 1 of a motive sequence often has a slightly different structure, where there is a large fourth wave that retraces 38% to “test” the previous 4th wave of one lesser degree and leads to a large fifth wave that will trace out the same length again as the length of the first three waves combined.
If wave sequences break the above rules, they’re not impulsive waves, but corrective. Corrective waves have their own rules and structures, but we’ll save that for another article. In fact, corrective waves can themselves be made up of waves that have 5 subwaves within them, but these waves are not impulsive and do not conform to the rules of an impulsive wave. This is a subtle difference that has been made very confusing to most because it is never explained in The Elliott Wave Principle book.
The Right Look
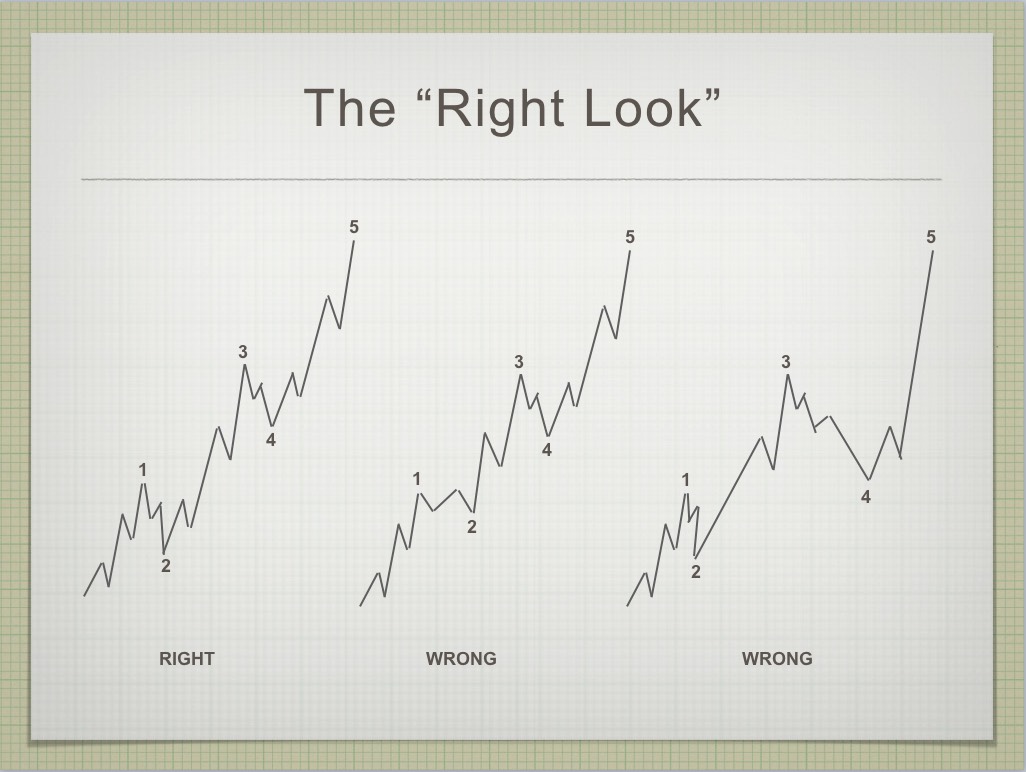
But, let’s get back to those impulsive waves. While waves that do look at first glance like an impulsive wave often are not. This is where the “right look” comes in. As you get familiar with these trending waves, being able to discern the difference is the key to being successful in trading (and analysis).
Left-most in the adjacent diagram is a bullish, impulsive wave with the correct structure and “look.” You can see the five subwaves within each of the motive waves and the three subwaves within each of the correct waves (waves 2 and 4).
The “wrong view” in the center of the diagram shows a second wave that does not retrace 62%, but otherwise the wave look impulsive. However, this discrepancy makes it a corrective wave and it’s likely to trace out another wave at the tail end or end in a double top.
The “wrong view” on the right shows a wave with a very large fourth subwave. The “right look” again is key to proper analysis. If wave 2 or wave 4 is out of proportion to the other elements of the wave structure, then the wave is likely corrective. I would refer this wave as a “3,” because when you squint your eyes, all you really see is 3 waves. Waves 1, 2 and 3 together would count as the A wave, wave 4 and the B wave, and wave 5 as the C wave. You have an ABC 3 wave sequence and it should completely retrace.
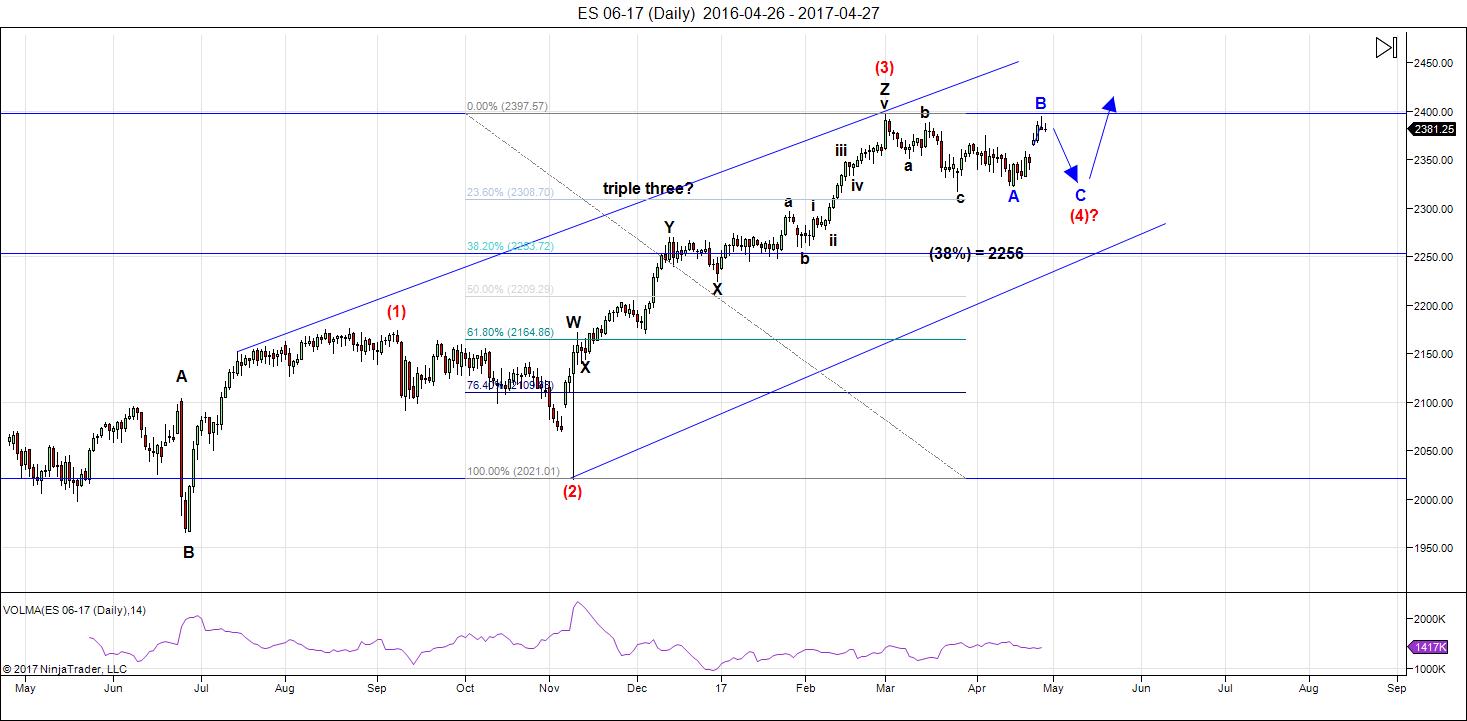
Application of Motive Wave Rules to the Chart of ES
You can apply the principle above to the daily chart of ES (to waves 1 – 4) and you’ll see that it doesn’t fit the criteria for an impulsive set of waves. Therefore, it is corrective. The waves form a zigzag. A zigzag is comprised of an A wave in 5 waves (not an impulsive one), a following B wave in 3 waves, and a C wave in 5 waves. The A wave is not shown on the ES chart below (the very top of it is), but the B and C waves are visible. We’re in the fourth wave of the C wave, with only the fifth wave to complete.
In the daily chart below, we actually have to complete the fourth wave first, but the after that, the final fifth wave will be “up a bat.” The fifth wave will be the final wave of the entire bullish, corrective sequence.
A Note About the Coming Top of the Market
A major wave sequence must start and end in a motive wave sequence (in other words, in five waves). Until you see a five wave sequence down, we will not have seen the top of the market.
Have not had a losing week RW 2
Have not had a losing week …I have been with Peter almost a year. The only thing that matters is have I made money with his service. I think I have finally turned the corner using Peter’s EW. I have not had a losing week in the last 5 months. Thanks Peter, for your amazing amount of hard work. —RW |
A true expert in Elliott Wave FL 2
A true expert in Elliott Wave …You are a true expert in EW analysis. What you provide is not available anywhere and is priceless. Subscription on your services is the best thing I have ever done. Many thanks for your effort to make me a better investor. I now have more trust in my investment decisions. I hope you will continue the excellent work! —FL |
Rise above the rest … SM 2
Rise above the rest …I have only ever met a few people who, in their chosen fields (astrology, medicine, music, martial arts, technical analysis), rise above all the rest and you are one of them…you have ‘the gift’…and that’s why I’m a Trader’s Gold member. —SM |
the real deal SM 2
The real deal …‘Educational, insightful and thorough market analysis for all levels of traders. It’s Elliott Wave at its best….Peter Temple is the real deal’ —SM |
Couldn’t be happier … KK 2
Couldn’t be happier …The analysis and insight you provide is simply amazing! I’ve been trading the futures and equity markets for well over thirty years and usually average around 5% monthly. Since joining your Traders Gold Service two months ago, that number has better than doubled. I couldn’t be happier.—KK |
Tops in your field DZ 2
Tops in your field …You are tops in your field. Tried to follow Elliot Wave international for years. They were always behind the market. After discovering you, I perceive that you are an expert in reading the waves, which puts you way ahead of the rest of your peers. And you can read the Waves like you are reading tomorrow’s financial section. I pray you stay healthy. —DZ |
Get an upper hand … JC 2
Get an upper hand in trading …Seeing all the different currency pairs and the wave structures and hearing you explain why this has to do that on a nightly bases gives one a upper hand when trading. Elliott Wave applies to all stock and indices and can be applied to any candlestick chart. If someone ask what you want for Christmas – Tell them a membership to Peter’s “Traders Gold!”—JC |
The best of them JL 2
The best of them …Last couple of years, I subscribed to several ‘market traders’. You are by far the best of them and the personal contact is awesome. Daily and daily updates are very well written! Besides your expertise in EW, I also like your cycles analysis. Best investment I ever made! —JL |
The Market This Week
Above is the daily chart of ES (click to enlarge, as with any of my charts). Last week, as soon as I posted a daily chart of ES (on Sunday), the market opened and morphed from triangle to a flat.
We appear to be at the top of a flat. Flats are 3-3-5 configurations. We may take a day to complete this turn, as NQ is finishing a third wave up, but once we do turn, we should head down in 5 waves.
Let's look why a new high is out of the question, imho.
- This fourth wave cannot be the fourth of the third wave, because we don't have a second of the third, and that does not fit any kind of known EW structure. So that leaves us in the larger fourth wave, which is how the chart is labelled.
- If this larger fourth wave was to top, we'd have an ABC wave up, which cannot be an ending wave. In fact, the structure it would leave below it wouldn't make any sense, unless this is the first wave up of an ending diagonal (the first leg of the fifth wave). However, currencies still have a long way up to go, and in fact several of them haven't turned into their final waves yet.
- The only pattern that makes any sense is a final flat of the fourth wave and the most sense going forward would be a new low (as the fourth wave is very shallow for a major fourth wave). We still need to allow, though, for the possibility of a running flat (and C wave that does not seek a new low).
That said (as I explain above), we have two flavours of flat that could materialize. As a result, I don't have a clear target for a bottom. A running flat is very rare, but this is a rather bullish market, so I consider it a possibility A running flat will not drop to a new fourth wave low. An expanding flat, on the other hand, will drop to a new low. This is the higher probability, imho.
After completing the larger fourth wave, we'll have one more wave to go, which could be an ending diagonal as a fifth wave. The long awaited bear market is getting closer.
_____________________________
Sign up for: The Chart Show
Thursday, May 4 at 2:00 pm EST (US market time)

The Chart Show is a one hour webinar in which Peter Temple provides the Elliott Wave analysis in real time for the US market, gold, silver, oil, major USD currency pairs, and more. You won't find a more accurate or comprehensive market prediction anywhere for this price.
Get caught up on the market from an Elliott Wave perspective. You’ll also get Andy Pancholi cycle turn dates for the balance of the current month. There’ll be a Q&A session during and at the end of the webinar and the possibility (depending on time) of taking requests.
All registrants will receive the video playback of the webinar, so even if you miss it, you’ll be sent the full video replay within about an hour of its conclusion. For more information and to sign up, click here.


– Market Cap on GVA (Corporate Gross Value Added): 1.70x (only ever higher in 2000)
– Market Cap on GNP (Buffett indicator): 1.70x (only ever higher in 2000)
– Market Cap on GDP: 1.10x vs 0.58x historical average
– Market Cap on Gold: 1.90x vs 1.55x historical average
– Market Cap on Oil: 44x vs 23x historical average
– CAPE Shiller Adj P/E multiples: > 30x (only ever higher in 1929 and 2000)
– CAPE Shiller Adj P/E multiples relative to 10yr GDP growth: 35% above historical levels
– Price on Book Value: > 3x (only ever higher in 2000)
– S&P 500 Price / EBITDA: higher than in 2000 and 2007
– EV / EBITDA small caps in Russell 2000: almost 30x (from average 15x in last 30 yrs)
– Net Debt / EBITDA: > 2x (from 1x in 2007)
– Median Price / Revenue Ratio for S&P components: > 2.5x
– S&P relative to Velocity of M2 Money Supply: double the levels in 2007 and 2000
– NYSE Margin Debt at a 85 years high
I’m tired. This is criminally engineered to stay up.
That has always been the challenge has it not? To outlast the banksters and their criminality. Many a bear has perished along the way by underestimating their ability keep the bubble inflated. The plunge in oil is in my view a big tell. The economy runs on oil. How long do you think it is going to take for Joe six-pack to figure out that it may be telling us the true state of the economy. What you are seeing with equities at this level under the circumstances is a world in which market participants have gone stark raving mad. While I am starting to suspect it is getting close, I don’t know exactly when it will end….I do know how….
CHINA’S FOREIGN EXCHANGE (“FX”) RESERVES ARE DANGEROUSLY CLOSE TO LOW LEVELS THAT WILL LIKELY CAUSE AN INFLECTION LOWER IN THE CURRENCY. Based on a fine-tuning of its formula to calculate “reserve-adequacy” over the years, the International Monetary Funds’ (“IMF”) approach can be best summed up as follows: Minimum FX Reserves = 10% of Exports + 30% of Short-term FX Debt + 10% of M2 + 15% of Other Liabilities. Thus, for China, the equation is as follows: 10% * $2.2tn + 30% * $680bn + 10% * (RMB 139.3tn ÷ 6.6) + 15% * $1.0tn = $2.7tn of required minimum reserves. Furthermore, when considering China’s FX reserve balance was roughly $4tn just 2 years ago, we find it concerning that experts now peg China’s unofficial FX reserve balance somewhere in the $1.6-$1.7tn range. Why does this differ from China’s $3.0tn in reported FX reserves as of Feb. 2017? Well, according to our contacts, when adjusting for China’s investment in its own sovereign wealth fund (i.e., the CIC) of roughly $600bn, as well as bank injections from: (a) China Development Bank (“CDB”) of roughly $975bn, (b) The Export-Import Bank of China (“EXIM”) of roughly $30bn, (c) the Agricultural Development Bank of China (“ADBC”) of roughly $10bn, as well as capital commitments from, (d) the BRICs Bank of roughly $50bn, (e) the Asian Infrastructure Investment Bank (“AIIB”) of $50bn, (f) open short RMB forwards by agent banks of $300bn, (g) the China Africa Fund of roughly $50bn, and (h) Oil-Currency Swaps with Russia of roughly $50bn, the actual FX reserve balance in China is closer to $1.69tn (Exhibit 3).
Stated differently, based on the IMFs formula, sharply contrasting the Consensus view that China has years of reserves to burn through, China is already below the critical level of minimum reserve adequacy. However, using expert estimates that $1.0tn-$1.5tn in reserves is the “critical level”, and also considering that China is burning $25bn-$75bn in reserves each month, the point at which the country will no longer be able to support the renminbi via FX reserves appears to be a 2017 event. At that point, there would be considerable devaluation in China’s currency, sending a deflationary shock through the world’s commodity markets; in short, we feel this would be bad for the steel/iron ore stocks we cover, yet is being completely un-discounted in stocks today (no one ever expects this event to occur).
Submitted by Gordon Johnson of Axiom Capital
Energy streams tracking very nicely this week with 2 inversion days so far
https://s4.postimg.org/3mm26wxa5/May_1_to_5_energy_stream.gif
Thanks Tom
Thanks Tom,
I wonder what next week will bring.
The Friday energy steam I posted last night is also inverted today
very rare to see 3 inversions in one week
and 2 inversions back to back
The Sunday election in France is turning everything on it’s head!
ok, almost there, this final 5th leg of the final broadening top is “corrective”!
https://invst.ly/3w0e4
https://invst.ly/3w0fs
so close you can smell the napalm
https://invst.ly/3w12a
jody – you be ready for the “break”?
https://invst.ly/3w179
I be ready!
Quite a few ending ending diagonals in charts completing b waves up….
Smell that? You smell that? ……
I love the smell of napalm in the morning… 😀
Kilgore
of course it is!
https://invst.ly/3w1s7
update – https://invst.ly/3whpd
the saturn death cult psychopaths have their AI machines in charge of the final timing.
Looks to me like the market is waiting for the outcome of the French elections. It seems to be the smart trade going into the week-end is a neutral straddle to take advantage of the knee-jerk reaction to the outcome. Looking at SPY option chains a bearish May 17 240/241 call spread and a May 17 237/238 bullish put spread look good options, pun intended! 🙂
This trading sight will open your eyes and make you laugh @ the same time
http://ponziworld.blogspot.ca/
yeah, this guy is absolutely ‘AWESOME’!
Glad you enjoyed it!
Great article! Thanks for the share.
But it does leave me scratching my head with the question…..
When is this market going to get real….
Verne
The Fed is trapped , there will be no one to unwind their portfolio to yet
they can slowly sell over time . in the end though they don’t have to sell
to unwind the bonds . The bonds can simply mature and they simply
not roll that money over . In doing this simple strategy interest rates will
rise and the risk will be put to those who purchase .
In order to follow this we just need to follow how well these new bond
offerings are received.
As for do i think the market would be trading at these levels today without
any central bank or gov intervention ???
We can argue that point from several angles so im going to leave it be
and ill ask a different question .
Does Elliot wave theory have any predictive value ??
If your looking at a low of a 4th wave or even a low in a larger A wave
back in 2009 and you saw the extreme oversold market what would you
expect to see ???
Back in the 2009 lows i was not looking for new all time highs in any of
the major stock indexes yet i was expecting a large rally . Over time
the market gave signals that new all time highs would come .
Regardless of whether you consider this a 5th wave up from the 2009
lows as i do or a huge B wave rally as others do we must consider
that in order for the Wave count to complete there will be some form
of intervention in order for the pattern to unfold .
Intervention can be money from around the world simply flowing into
the united states as people from other countries seek a safe haven for there money ( a place to park their money until the clouds blow over ) right now
the united states is that safe haven . This is not a fundamental stock market rally
Many stocks are indeed valued at prices below where they are trading .
Trumps tax plan is one reason people will change their valuation models
yet that in itself is a forecast of sorts where they assume based on X that
value will be Y and in doing so they justify buying . Individual companies buying
back their own stock also puts a bid under the stock and keeps the price up
yet when they do that it also reduces the number of shares being traded .
this creates a set up for more volatility because there is less shares available
to trade as well as less shares available to be borrowed which can be sold short.
if Trump gets his tax plan passed ( there is a trump plan as well as a republican plan and they aren’t both the same plan which i find odd yet that is what we are dealing with ) there is some 2 trillion dollars ( i don’t know the exact number )
that sits overseas which could end up back in the united states and that money
may end up in the economy or be used to do more buy back etc….
My point to all of this is blaming it on the bankers is a mistake and really
what is going on is that money is flowing into the united states which is helping to drive stock prices as well as real estate prices higher . At some point the trend will reverse and that same money will flow out .
The reason i don’t subscribe to the PPT as well as blaming the Banksters as some call them is that for a very simple reason , technical analysis still works ,
Elliott wave theory still works . Many on this site see Andres Turn dates work
and i see my own cyclical work still working ( nothing is perfect mind you )
Tom posts his energy models and id say he to has shown some pretty incredible
correlations to what is going on . Peters updates also have been pretty reliable .
Are all of these different approaches being used by the bankers ?? i doubt it
are all of us getting the inside scoop from the bankers ?? definitely not
and lastly why is it that just about every market nose dive end up with some major financial institution being blown up ???
In order to believe its the bankers we would need to accept technical analysis as meaningless, we would need to accept Elliott wave theory is simply wrong we would need to accept that the powers that be , the central banks the fed
are all completely in control which for me i in no way can accept .
Elliot wave theory is best used by look at what has already happened so you know where you are today. IF ( big IF ) you have the wave count correct in both the larger and smaller structure correct then you will most likely be correct about what will happen next. IF your wrong then you will know it because the market wont go as you expect. Back in feb – march this year , peter as well
as most likely several other Elliot wave technicians were expecting a wave 4
so far this market has been trending sideways , peter has not called this
the top and in fact he has stated he is waiting until Sept i think ( sept oct ? )
He didn’t make that forecast based on what he felt the bankers were doing.
My personal feelings are the wave count will predict the news as well as
the policies and not the other way around.
I do think socioeconomic s plays a role where first the tide turns in social mood
and then later you see the stock market turn . I also have learned to take a more
delayed view and not worry about being exactly right . Selling the exact high for example has its merits on a short term basis only.
the bigger picture you need 1 2 3 4 5 down then a b c up , you can sell the exact high and just get whipped around , now on the other hand waiting for the 1 2 3 4 5 down and watching for the a b c up and then getting in on that next trend
is much simpler and much easier to hold onto . you have a defined risk you have
a confident wave count and you have a price structure which allows you to define your risk yet also to define your profit target.
Elliott wave theory tells you when you wrong .
so to answer your question , Yes i do think that the stock market is trading today
where it should be trading .
The market is always right and it is up to us to get the trend correct .
Joe
If i was to use the above as an example
Id say a macron win in the french election is a short term
bullish expectation for the euro yet a longer term bearish
view of the euro . why ??? a macron win will imply those in power
wont reform and will continue to do the same things and that will bring
the demise of the European union . Peters wave count on the euro
is expecting a bounce so a macron win could be expected yet the euro
wont hold up for very long as its trend is down .
on the other hand a huge rally in the euro is already taking place
and a a short term cycle high i am looking for in the usa stock indexes
coincidentally my date of importance is may 11th ( also the 13th with is the weekend )
to sum it up i think the french elections are going to be screwed up .
Maybe some sort of fraud claim in the voting . i really don’t know
and yet i can see how it could unfold .
I still view the spx dow nya oex etc… as heading higher in a B wave
on a short term basis and i still see the may 18-19th time frame as a low .
i don’t like trading option expiry weeks because it is full of position squaring
and tends to be rallies more times then not yet my timing model calls
for a low may 18th .
This again leaves me with a mixed picture relating to the french elections .
To sum it up .
Im leaving the outcome of the elections in France out of my thinking yet
i feel as if the timing leaves the door open for some kind of screwed up
results or claims of voter fraud, rigged elections etc…
i m more interested in how the vote is received by the public then who the actual winner is . the recent rally in the euro is in my opinion and assumption that macron will win and therefor politics in the EU will not need to change .
in not changing the politicians will destroy the EU.
Im rambling so im going to stop .
lets see how the election results are received and what the people do
afterwards .
Joe & Verne,
I would be interested in both your thoughts on money “fleeing” Europe and Japan.
I feel certain that some of the “lift” in our markets is coming from abroad but some say that trillions more will come.
Someone must “buy” what those leaving are “selling”…and maybe the central bankers are buying but that money that is coming to the U.S. Must be converted to dollars, right? Is there something that would tip either of you off. Maybe it already has. Any thoughts would be appreciated!
I told you they had it planned to the second!! this weekend – ” Pray ! ”
https://invst.ly/3wiz9 close up
https://invst.ly/3wizr pull back
https://invst.ly/3wi-r pull back 2
https://invst.ly/3wj08 pull back 3
Boy was that spooky…right at the close no less. I was in the process of rolling some DIA upside hedges just before the close when all of a sudden the bid on the 210 strike calls suddenly went through the roof and I thought to myself “What the…!!!!”
What a pit of snakes!!! 🙂
You sure did call it!
Ed that is an interesting thesis and I had not thought much about it but it does make sense. I suspect the smartest money is going to “flee” East and not West.
Europe has been destroyed by radical Islam and things are going to get worse. What they are doing there is akin to what Mugabe did to Zimbabwe and the results will ultimately be the same. It is frightening to watch an entire culture engage in mass suicide. Japan is also destined to become a nuclear wasteland, with the death of the Pacific Ocean being the most under-reported story of the century in my humble opinion. I suspect some money will seek safe haven in the US and in fact may already have in places like Miami and the West Coast. There has also been a phenomenal amount of interest in places like Vancouver and Australia. The US is also headed for difficult times. The petro-dollar is dying, the disgusting corrupt alliance with Saudi Arabia along with it. The Treasury bond bubble is ripe for a prick, and countries tired of our bullying ways have quietly made arrangements to by-pass the dollar in global transactions. They cannot murder other world leaders leading this effort as they did Ghadaffi. I am making plans to leave the US in the next two years God willing. We have a horrific amount of blood on our hands as a nation. We have certainly sown the wind, and are destined in my opinion to reap the whirlwind. This is the last place that I would be fleeing to.
This weekend will bring a change in trend and we’ll be down into 5/18. 5/7 very strong date. Experts will say it’s the French elections but it is all vibrational. It is always amazing how earthly events are scheduled just when the vibrations bring a change in trend. So the elections are not the cause of the turn; it’s an expression of the vibration.
5/9 is a strong date (berg, light day, etc) and this will bring a low. 5/11 will bring capitulation. So, 5/8 high, 5/9 low, 5/11 high and then abc down into 5/18.
Cheers,
André
Thanks/cheers André!
Peter if we break the new high will you have to abandon the idea that 4th wave is not done and we are on to 5th wave. Everybody is expecting a rally so most probably we get a downswing but not before reaching new highs.. This are the problem with Eliot waves we have to constantly redo/redraw them to make profit.
Thanks
Bill
Bill,
First you’d have to tell me what asset you’re talking about. I suspect it’s one of the US indices, but they’re all in different places (different wave structures) and my answer will likely be different, depending on which one it is. However, your last statement is misplaced. What matters is a set-up. In the case of a bullish market, for a short, that would be 5 waves down and 3 waves up. It depends very much on the subwave structure.
You’re making assumptions (something I won’t comment on). My mantra: “Trade what you see, not what you think.” What matters is what’s actually happening; you need to look across the market as a whole.
Right now in the US indices, we have non-confirmation (ES, for example, went to a new high, so did NQ). However, NQ and ES both traced out what look like ending diagonals (NQ is in the fifth of the fifth of the third and a C wave).
NYSE, SPX, DOW, NDX, IWM, IWV (RUT) are all in different places (with a variety of underlying wave structures). And then there’s the DOW vs. the DOW transports to keep in mind this weekend. I will mention non-confirmation in my post. Taken as a whole, the outlook is really bearish shorter term.
Since the Nasdaq and related indices are right at the top of the third wave, the highest-probability answer to a question about what SPX is doing is “trying to finish a third wave.” Even if it does find a new top, we still need a proper fourth. So your concern about a new high doesn’t change the outcome, from an EW perspective, imho.
I learned the hard way that a new high is not always bullish. I used to subscribe to Elliott Wave Incompetent and in hindsight I realized one of their biggest problems is how they consistently failed to recognize developing expanded flats and cost their subscribers a lot of money with erroneous counts. It is this gross incompetence in so many self-styled Elliotticians that has given the methodology a bad name. Fortunately for us, the analyst on this site know what he talking about…
Thanks Peter.
Bill,
Hope it helps. The challenge right now for all of us is the larger-picture pattern, which is corrective. We’ve never (to my knowledge) experienced this in an “ending wave” at high degree. Since corrective waves have few rules, it makes predictions exceptionally difficult, as I’ve alluded to in this weekend’s post.
Everyone expecting blow off top 2435 this week. Wainting to see what peter has to say
Lot of people think this is third. 4th correction than fifth.
Peter,
As usual I am late with the non-EW videos you share. You shared one regarding the death of a former President’s son two weeks ago. I bookmarked it hoping to view it at some point. Unfortunately, the video is gone. Is there another link?
Yesterday I bought a few weekly SPY calls expiring yesterday for 7 cents thinking it would go up to 25 cents toward the end of the day but I sold for 13 cents near close. It traded up to 47 cents after hours lol.
Another trade yesterday was selling short IBM from 155. I covered quickly when it dipped below 154.50 because there was a huge OI for 155P. I figured it would pin at 155.
LizH,
Interesting. Try this one: https://www.youtube.com/watch?v=Vehk03v23y4
“The Assassination of JFK Jr” (just in case it disappears again)
It was very interesting how they ramped the indices into the close and futures continued skywards. I am expecting that either the futures will stay elevated into the open and Monday and we will get an outside reversal day to trap everyone that chases the move up, or we will see futures take a nose dive before the open. We are very close to ATH. I rolled a few hedging calls just at the close and will be exiting them at the open, and aggressively shorting any initial move higher with remaining ammo. I expect the market to disgorge the entire “Trump Rally” ahead of the final wave up.
Andre
you couldn’t have said it better , i always find it strange how the events
somehow line up with the timing . my overall view short term is the same
as yours . next week will be interesting to say the least !
i don’t like trading option expiry weeks yet i still favor may 18th as a low
which implies some sort of mess coming out of the french elections .
Verne
i work on the west coast moving oil and lumber and there was a time
when some of the people on other boats dodged houses from japan
following the tsunami in japan . No doubt there was some radiation
that has traveled to the west coast . It is something i worry about for my own
health yet so far i have not noticed and health issues .
I don’t intend to leave the united states but i don’t blame you for doing so.
I live in a very small down on the west coast and while i do expect things to get bad economically i m not expecting a huge surge in crime in this area.
The major cities are ripe for civil war, higher crime as well as bad economics.
I am though still waiting until next year to decide on selling my house and if i do
ill leave this state because of tax policies ( assuming they get worse )
ED
i tend to subscribe to the thought of buy the rumor sell the fact .
Its not a long term trading methodology but things tend to be priced
in in advance based on a rumor , then reality hits and the markets reverse.
This present stock market rally has been based on what trump has intended to do . The idea that money will come back because of his tax plan etc…
once that money is back ??? There wont be any other stash outside the united states.
What am i looking for though to tip me off that we are topped or very close ???
PENSIONS !!!!!!!!!!! That is what i see as the next trigger .
I don’t follow Japan close enough to add anything valid to the discussion
how ever i do listen to what goes on over there but not enough to comment .
Ill say this though, I was a commercial fisherman out of dutch harbor Alaska for 23 years . a strong yen is great for Just about anything being shipped out of the united states . Crab, cod fish and black cod are probably at decent to high prices .
we Caught and processed those products and it went to japan for the most part.
The Japanese are very quality based. They want a perfect product and they want
a profit margin built in so to speak. we would have Japanese techs on the boat who would serve as quality control and if we had one on board the entire
production was considered sold before it was even caught . One time i had our weights dialed in exact. Meaning a 28 pound net wt was exactly 28 pounds .
The Japanese tech went ballistic and through a 350 dollar box of crab across the room which made it a number 2. What we did was to add a 4 ounce cluster to each box on the next run and we kept that up for the following years in order to keep them happy, we held 12000 boxes when loaded which gave them about an extra 3000 pounds on a 336,000 load of finished product ( around 650,000-700,000 live wt ) The Japanese are very detailed and also very disciplined.
There country is very small and not large enough to handle and great amount of money flow . The us dollar is everywhere and can absorb a huge amount of money flow .
I guess id watch the EU as well as Germany, Britain ( because it is exiting ) Mexico and Canada .
My trigger though is the pensions because i think that is where the next crisis lays .
If money needs to be converted to dollars then it makes sense that the usa stocks market can rise with a dollar rise at least in the short term yet at some point a strong dollar will make USA exports to expensive and we will see it come out in quarterly earnings reports .
Fridays close on the overall markets i find interesting .
The spx did not make a new all time high in the cash index .
the oex had now satisfied its objective by poking above its march 15-16th high .
I have not looked through all of the indexes yet Next week is full of Fibonacci
time lines and the mars Uranus cycle calls for a high may 11th and a low may 18th .
From May 18th to June 30th though is extremely bullish based on the mars Uranus cycle .
Bottom line: The bigger picture to me is bullish despite the short term negatives.
Joe:
How far away are you from the Oroville dam? You may want check out that story as it has some very ominous implications for the West Coast.
Radiation is a silent killer. Although the Fukushima story is being ignored by the lame stream media, you can still find stories about sick and dying sea animals along the CA coast. There are places where tide pools are completely devoid of any life whatsoever. There are also starting to be some reports of unusual clusters of cancer cases and some deaths have actually already been reported. We would be making a fatal mistake to think this is not going to have a substantial impact on the West Coast and far beyond…
Peter
i see bearish divergences everywhere .
short term i view as bearish
I look forward to your weekend update
Joe
If a person owned an equal weight of
the Dow,Transports,NYA,SPX,OEX,NDX,SOX
despite all of these swings March 1st was the high
April 26th was the secondary high and fridays close
is lower than april 26th .
I still consider this a B wave of a larger bearish trend
yet longer term its bullish .
Ill dig into the indicators over the weekend more in depth
a quick scan though says.
10 day trin: 1.08
this is approaching an overbought reading yet in order to get a sell
signal i need to see this indicator close below 1.00 and then close
back above 1.00 ( no sell signal based on this just yet )
5 day trin sum :4.94
i look for a close at 4.00 to give a very short term overbought reading yet
i have seen 4.25 work enough times that im cautious when i see it .
again no extreme readings which gives a little upside potential
on Monday i doubt we will see a 4.00 level hit .
it looks like Tuesday or wednesday it could be though .
i add up the 5 day closes on the trin so each day i remove 1 day
and add the next . the previous 5 day closes are 1.31,1.03,1.00,.93,.67
Maybe a flat couple days close to close . Buying the close creates
a low trin reading so its the close that matters.
advance decline line :
The 5 day and 30 day peaked with the dows high close on april 25th
the 10 day peaked april 28th
The 5 day and 10 day bottomed may 4th yet neither of them
hit any extreme oversold levels .
I see nothing solid to go by using the advance decline line
at best its simply a mixed picture .
ill punch in the number and check out the oscillators over
the weekend .
My timing model says may 11th for a high , mercury retrograde 10 day lag
gives Saturday may 13th . initial look at the trin leaves a little room
for higher prices ( or at the least buying pressure to support a flat market )
5 day and 10 day advance decline lines are what id call neutral and not giving me
anything to go by at this juncture .
My oscillators will tell me more and from that ill be able to decide yet
from my initial scan id say giving the market a few days would be prudent
before taking any bearish trades .
price though has been satisfied and therefor expect surprises to the downside .
Cash oex hourly chart ( 24 hour scale )
there is a low to high to high count into the 3rd hour of Mondays trading .
using a regular hourly chart its runs into the 2nd hour of the trading session
on Monday .
What this means is give the market the 1st hourly bar on Monday before
making a bearish trading decision .
also ill note something i have not completely dug into in regards to program trading .
Some people recommend when your creating an automated trading system you should set it up so that the program does not trade the first 40-45 minutes of the trading session . it gives the program a little time to gather data that way .
i feel that in understanding what people use in there automated systems
whether they work or not is worth understanding since 70 % of the trading is automated.
That said the Fibonacci time sequences of late have been beneficial
The very simple low to low to high count . ill pay attention to Monday yet
i wont be position trading until i see how the above indicators look as we enter
the may 11th time frame .
that’s it for my initial thought process .
the data and oscillators i dig into will provide me more information to base
my trading next week .
enjoy your weekend
today is to nice to be sitting in doors
all for now
Joe
Peter, thank you very much for the link. If you believe what he said it’s all very painfully sad.
Joe, lots of missed opportunity if the program skips the first 40—45 minutes. I guess it depends on the stock’s price action the previous day, news pre-market and most likely if it’s Friday. A good example is TSLA. Huge down day Thursday. There was a “positive” spin pre-market last Friday. I can’t remember what it was. Maybe an analyst raised price target and maybe Musk tweeted we’re all going to teleport with tesla cars. Who cares? The tesla bulls bite on any gobbledygook. Then you scan the calls and puts. You see lots of OI at a particular put strike and you know you had to grab some calls at open. Albeit, I sold too early during the day, it was still breathtaking to see the bulls piling on any dip and how cheap the calls were the first two minutes.
I’m very curious how they’ll spin Macron win (I’m sadly pretty sure he’ll win) as bearish for the market, since it looks like we’re heading down on Monday…
Liz
I think there is a difference between human trading and program trading.
as an example say a market gaps up at the open and i am personally expecting
a gap up and a high then i would be looking to sell the open , yet a program
trading system may just buy that gap up open and then be stopped out at a loss.
also with program trading your trying to take your piece out of the middle more so then catch the absolute high or low . It is a different type of approach where your late to enter and early to exit . From what i have read you get a more consistent system by not allowing it to trade the first 40-45 minutes as well as avoiding the last hour of the day .
personally i have seen opportunity the last hour of the day several times yet
program trading is not the same. we humans trade by what we think see and feel
a program trading system trades strictly by the numbers. i am very early
at getting into this and i plan to learn more as i actually begin programming as well as back testing yet from what i am reading that was what was recommended.
My intent to to dig into this much much further once i begin programming
at the moment i m just reading and gathering information from those who have written many program systems.
Its going to take me a while to really grasp all of it
Its not the same though and its harder then it seems yet not impossible.
liz
also option trading a completely different animal .
one reason i hardly use options anymore is i miss being able
to chart the option prices.
that said i have no intend of program trading options or individual stocks
its primarily a stock index trading system and trying to correlate it all
using everything i already use.
for me its really about back testing everything i use on different time scales .
i use several different methods for a daily chart or a weekly chart or a monthly chart or a quarterly ( 36 day chart actually ) .
i don’t have the time to input 390 1 minute bars into an excell spread sheet
to see how well my 20 day oscillator works using a 1 minute bar ( 20 minute oscillator in that case or making it a 3 minute bar or a 60 minute bar etc…
but i am very confidant in my 20 day oscillator.
or say a 1000 day oscillator or 500 day etc yet instead using 1 minute bars
3 minute or 60 minute etc…. ( 1000 minutes , 500 minute , 60,000 minutes 30,000 minutes )
for me its if then then that so to speak .
if this indicator peaks at Y or bottoms at w and then price does x take
take a position ( buy or sell )
its going to take me a year before i have any solid evidence
so im a very long long ways away before actually letting a computer trade for me
60,000 trading minutes is only about 153-154 trading days
Mahendra’s latest:
http://www.mahendraprophecy.com/latest-news.php?id=1128
John, thanks for sharing
http://timeandcycles.blogspot.com/2017/04/the-active-cycle-has-428-51-high.html … comments: Raj Time and Cycles said…
“Last night I spent many hours researching and reviewing all the various timing points and cycles unfolding in the next few months.
I have no doubt, we will see a sharp fortune making 10-15%+ decline into June-July FC Lows and the cycles are alligning perfectly the next few weeks for that to unfold.”
May 4, 2017 at 7:50 AM
Rotrot, thanks too
A new post is live at: https://worldcyclesinstitute.com/elliott-waves-pure-gold/
Verne
i thought id finish our talk on this thread then being it into the next
i was not familiar with the Orville dam , its a 400 mile drive for me which
is probably fairly close as the crow flies from me .
From my limited understanding that is a hydroelectric plant isn’t it ?
Also in regards to Fukushima , no doubt a lot of debris ended up off the Oregon
coast from ocean currents yet we have a predominant North west wind on the west coast Down as far as the Santa Barbara channel ( south of San Francisco )
So id expect higher readings were found off California vs Oregon yet people do eat Tuna fish which has a very wide migration pattern , i don’t see how the Orville dam would effect me yet ill comment on another thought .
back in nov 2015 we had had rain until april 2016 . back then it rained and rained and rained . i have a 27 ft retaining wall ( total of around 40 ft ) that fell down
because of the rain. It stopped me dead in my tracks on my house project.
i did some research on how to fix it and from what i read the idea of building a retaining wall was to build it to last 50 years ( i think i exceeded that with my repairs ) The Orville dam began production in 1967 and if i add 50 years
i get the year 2017. The walls i repaired were probably at least 50 years old if not older. I noticed very little to no re-bar in the pieces i removed . I have no idea how they constructed the Orville dam yet concrete becomes harder over time
which to me implies more brittle. Look around at old concrete structures
and you can see the deterioration. I always find myself looking at old concrete
and i look at where the re bar is sticking out . it does last a very long time
yet i have no idea what the standards were back then . thicker re bar takes longer to rust away and concrete absorbs moisture . The very few pieces of steel i found in my wall was in very good shape . I went with 7/8″ though on my repairs vs 1/2 or 3/8. i don’t ever want to deal with that again .
Im curious though . If the Orville dam is hydro electric how will it effect the west coast ???
Joe
This website is for educational purposes relating to Elliott Wave, natural cycles, and the Quantum Revolution (Great Awakening). I welcome questions or comments about any of these subjects. Due to a heavy schedule, I may not have the time to answer questions that relate to my area of expertise.
I reserve the right to remove any comment that is deemed negative, is unhelpful, or off-topic. Such comments may be removed.
Want to comment? You need to be logged in to comment. You can register here.