 They’re Everywhere!
LIke lemmings, which multiply every three and a half years and end up eating themselves out of “house and home,” ending up drowing in the ocean as they search for more food, ending patterns are terminal. They end and the trend reverses.
In the case of ending diagonals, it’s a dramatic reversal. That’s just like what happens to the lemmings. The population dies en masse, but a few remain so that they can start the process all over again.
Lemmings are just like other herders — humans, who will no doubt be super-bullish as we reach new highs, something I believe will happen this week. Until then, the direction continues to be up.
Last week, I named the current topping process “The Last Waltz,” because I expected a protracted period of ups and downs to this current “B wave” in the NYSE-related indices. That’s given the fact that we’re in complex ending patterns in all the US indices.
If you were in the Chart Show this past week, you know exactly how things are going to play out, as some of these patterns were identified then. Now, they’ve spread throughout the other sub-indices.
Some of the indices have traced out almost all of an ending expanding diagonal and have one more wave left to go. Some have traced out a run-of-the-mill ending diagonal. There are subtle differences in these patterns, but the bottom line is that they will end with a dramatic turn down.
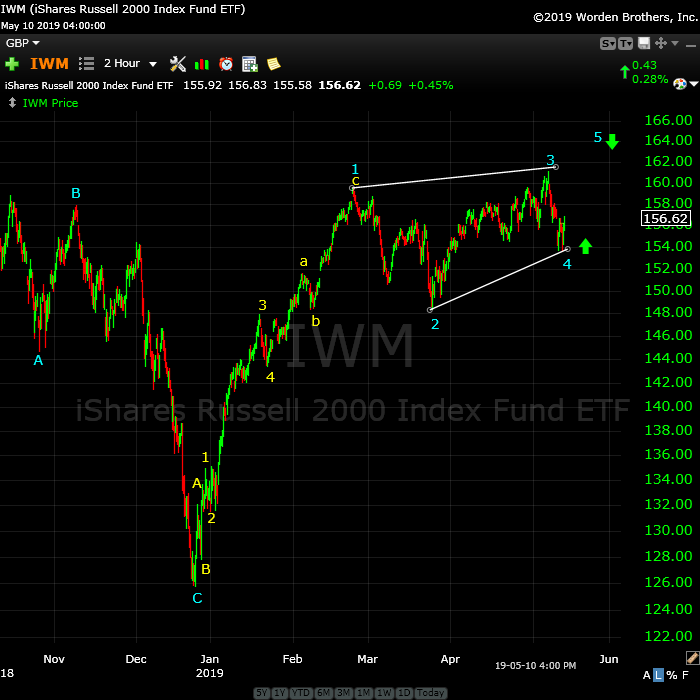
The Russell 2000 is the one that is sporting the regular ending diagonal. Here’s the chart:

Above is the two hour chart of IWM (the Russell 2000 small cap stocks).
The pattern is now a regular ending diagonal (an ending pattern). I’ve re-labelled the pattern to reflect this pattern, which will result in a final wave up to the trendline (slightly above in what we call a “throw-over”).
We’ll be looking for all the sub-indices of the NYSE to approach that high and turn down together …. sometime this week, hopefully.
What’s interesting to me is that we’re seeing ending patterns in all these NYSE sub-indices. Most are sporting ending diagonals of one type or another, which you can even see at the top of the third wave of the SP500 above (more of a megaphone, but still and ending pattern). The SP500 appears to have an ending expanding diagonal in progress. All of these patterns end with a final wave that approaches the upper trendline.
As I often say,
“Trade what you see, not what you think.”
_______________________________
Elliott Wave Basics
Here is a page dedicated to a relatively basic description of the Elliott Wave Principle. You’ll also find a link to the book by Bob Prechter and A. J. Frost.
____________________________
Registration for Commenting
Want to comment? You need to be logged in to comment. You can register here.
If you register, it protects your information. It also allows you to comment without filling in your information each time. Once you’re registered, simply go to the home page and click on the login link top right in order to log yourself in. Usually, you’ll be logged in for several days before needing to be logged in again.
______________________________
Problem receiving blog comment emails? Try whitelisting the address. More info.
______________________________
US Market Snapshot (based on end-of-week wave structure)
This chart is posted to provide a prediction of future market direction. DO NOT trade based upon the information presented here (certainly NOT from a daily chart).

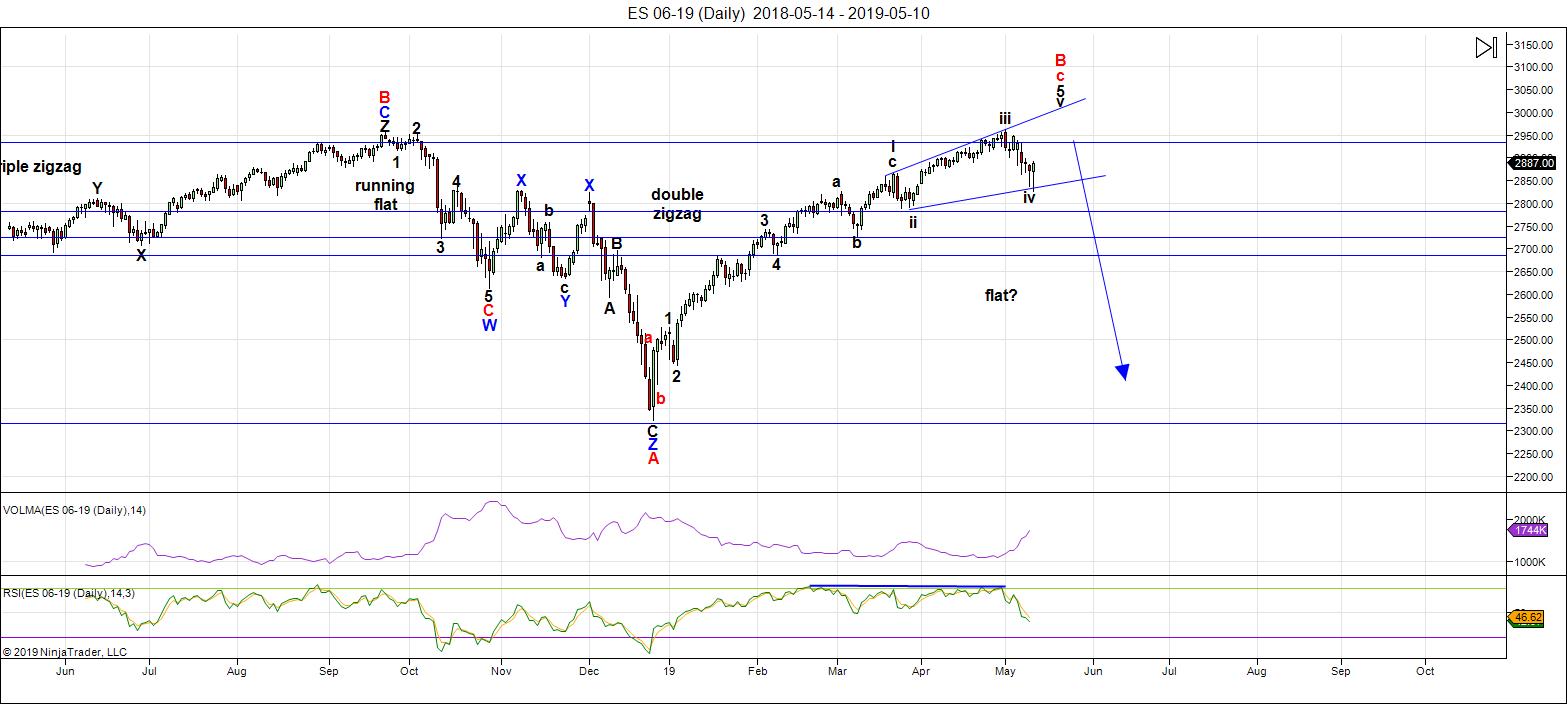
Above is the daily chart of ES (click to enlarge, as with any of my charts).
We've been sitting at the top now for well over a month. This weekend, we're in the final leg of an ending expanding diagonal (this is an ending pattern).
All US indices require a new high. The market will not come down until they reach it. Until this happens, the direction is still up.
The next major move is to the downside.
I expect to be reviewing possible entries in the Chart Show this Wednesday.
While the NYSE is in a large 4th wave, ES and SPX are still topping out in a third wave. This non-confirmation between major indices near a top is very bearish.
The wave up from Dec. 26 in ES is clearly corrective and, as a result, must fully retrace to the downside. This is supported by the US Dollar Index, the major USD currency pairs, WTI Oil, along with DAX, TSX, and other international exchanges.
Summary: My preference is for a dramatic drop in a 4th wave to a new low. The culmination of this drop should mark the bottom of a large fourth wave in progress in the NYSE since January 29, 2018 - over a full year of Hell. It may be a dramatic drop that is quite fast; in any case, it will target the previous fourth wave area somewhere under 2100.
Once we've completed the fourth wave down, we'll have a long climb to a final new high in a fifth wave.
___________________________
Trader's Gold Subscribers get a comprehensive view of the market, including hourly (and even smaller timeframes, when appropriate) on a daily basis. They also receive updates through the comments area. I provide only the daily timeframe for the free blog, as a "snapshot" of where the market currently trades and the next move on a weekly basis.
______________________________________
Sign up for: The Chart Show
Next Date: Wednesday, May 22 at 5:00 pm EST (US market time)

The Chart Show is a one hour webinar in which Peter Temple provides the Elliott Wave analysis in real time for the US market, gold, silver, oil, major USD currency pairs, and more. You won't find a more accurate or comprehensive market prediction anywhere for this price.
Get caught up on the market from an Elliott Wave perspective. There’ll be a Q&A session during and at the end of the webinar and the possibility (depending on time) of taking requests.
For more information and to sign up, click here.
| "I think you are the only Elliot Wave technician on the planet who knows what he's doing.” |
| m.d. (professional trader) |
All registrants will receive the video playback of the webinar, so even if you miss it, you’ll be sent the full video replay within about an hour of its conclusion.


:))))
energy chart update
https://ibb.co/QpbL7g8
Thanks much Tom. Have good night!
Thanks Tom, The market has to go up one more time after that Kaboemmmm…
The energy chart is absolutely fascinating!
Initially I thought is merely interesting.
Now I have a very healthy respect for what it might portend.
I have been trying to correlate the amplitude with possible wave counts and the partial decline indicated today meshes quite well with what I think is a fourth wave correction ahead of one final high.
Overnight the algos were trying to defend 25,800.00 and 2870 in YM and ES but they both fell eventually. The rally is definitely tiring and I could be wrong about another wave up. On the other hand, it would be just like the perverse banksters to ambush traders attempting to go short when the case session commences based on the action in futures, and send the lemmings into the week-end beside themselves with bullish glee, by ramping prices to a new high today, and then….well, you know…! It’s in the chart! 🙂
0
Hi Vern
are you Canadian like Peter and myself?
Not exactly, Tom. I originally hail from the British Virgin Islands, a close cousin perhaps? ☺
nice
no trading here in Canada on Monday
Victoria Day
An ES decisive break of 2860 invalidates my fourth wave count…..
morning..thanx Tom..
Your becoming quite the Elliott Waver Verne ;)),,,,,
Difficult not to hanging around Peter…! 🙂
http://schrts.co/JdnyTXNH my Dow minute chart if helps anyone..good luck in getting trades set up for next week to all..
ED perhaps?
possible QQQ hitting resist at that 185..
I m short AEX now, let’s see wich astro-date has more impact May 19 or May 21.
yes john that is the question..to soon be answered
looks more like a 4 with a 5 to go..
Its becoming very clear that next week will be an important one. Very impressed with astro guys pointing this particular week out so far ahead of time. The fact that we retraced exactly 61.8% of the first decline in SPX is something that has caught my attention. I am not taking a big position into next week, but I have bought some wing puts just in case we gap lower into Monday open.
I feel like it is baiting right now…still going to wait ..emas i watch still haven’t crossed…so won’t buy til see it happen
and yes I would like to gain a better knowledge of the astro work ..and with what everyone has shared..I have been getting a better understanding of it…so a thank you
A new weekend post is live at: https://worldcyclesinstitute.com/top-close-at-hand/
This website is for educational purposes relating to Elliott Wave, natural cycles, and the Quantum Revolution (Great Awakening). I welcome questions or comments about any of these subjects. Due to a heavy schedule, I may not have the time to answer questions that relate to my area of expertise.
I reserve the right to remove any comment that is deemed negative, is unhelpful, or off-topic. Such comments may be removed.
Want to comment? You need to be logged in to comment. You can register here.