
 They’re Everywhere!

LIke lemmings, which multiply every three and a half years and end up eating themselves out of “house and home,” ending up drowing in the ocean as they search for more food, ending patterns are terminal. They end and the trend reverses.
In the case of ending diagonals, it’s a dramatic reversal. That’s just like what happens to the lemmings. The population dies en masse, but a few remain so that they can start the process all over again.
Lemmings are just like other herders — humans, who will no doubt be super-bullish as we reach new highs, something I believe will happen this week. Until then, the direction continues to be up.
Last week, I named the current topping process “The Last Waltz,” because I expected a protracted period of ups and downs to this current “B wave” in the NYSE-related indices. That’s given the fact that we’re in complex ending patterns in all the US indices.
If you were in the Chart Show this past week, you know exactly how things are going to play out, as some of these patterns were identified then. Now, they’ve spread throughout the other sub-indices.
Some of the indices have traced out almost all of an ending expanding diagonal and have one more wave left to go. Some have traced out a run-of-the-mill ending diagonal. There are subtle differences in these patterns, but the bottom line is that they will end with a dramatic turn down.
The Russell 2000 is the one that is sporting the regular ending diagonal. Here’s the chart:
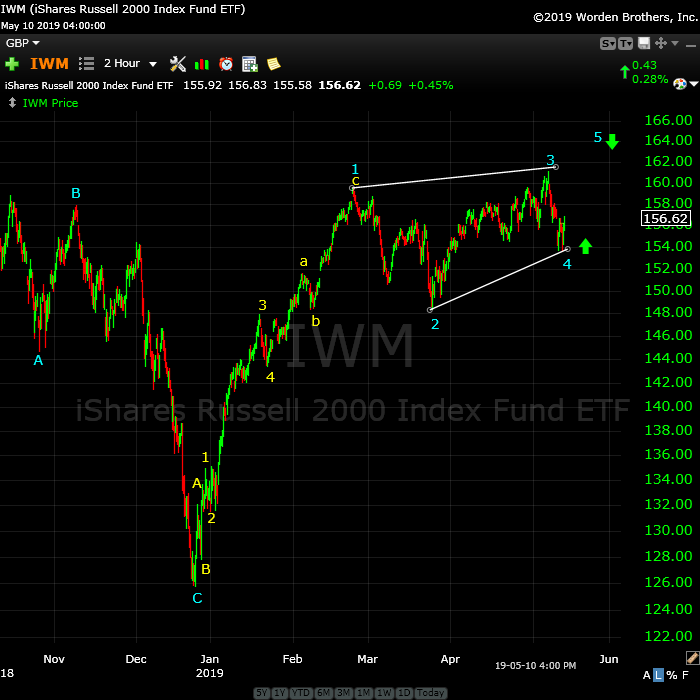
Above is the two hour chart of IWM (the Russell 2000 small cap stocks).
The pattern is now a regular ending diagonal (an ending pattern). I’ve re-labelled the pattern to reflect this pattern, which will result in a final wave up to the trendline (slightly above in what we call a “throw-over”).
We’ll be looking for all the sub-indices of the NYSE to approach that high and turn down together …. sometime this week, hopefully.
What’s interesting to me is that we’re seeing ending patterns in all these NYSE sub-indices. Most are sporting ending diagonals of one type or another, which you can even see at the top of the third wave of the SP500 above (more of a megaphone, but still and ending pattern). The SP500 appears to have an ending expanding diagonal in progress. All of these patterns end with a final wave that approaches the upper trendline.
As I often say,
“Trade what you see, not what you think.”
_______________________________
Elliott Wave Basics
Here is a page dedicated to a relatively basic description of the Elliott Wave Principle. You’ll also find a link to the book by Bob Prechter and A. J. Frost.
____________________________
Registration for Commenting
Want to comment? You need to be logged in to comment. You can register here.
If you register, it protects your information. It also allows you to comment without filling in your information each time. Once you’re registered, simply go to the home page and click on the login link top right in order to log yourself in. Usually, you’ll be logged in for several days before needing to be logged in again.
______________________________
Problem receiving blog comment emails? Try whitelisting the address. More info.
______________________________
Tops in your field DZ 2
Tops in your field …You are tops in your field. Tried to follow Elliot Wave international for years. They were always behind the market. After discovering you, I perceive that you are an expert in reading the waves, which puts you way ahead of the rest of your peers. And you can read the Waves like you are reading tomorrow’s financial section. I pray you stay healthy. —DZ |
the real deal SM 2
The real deal …‘Educational, insightful and thorough market analysis for all levels of traders. It’s Elliott Wave at its best….Peter Temple is the real deal’ —SM |
Have not had a losing week RW 2
Have not had a losing week …I have been with Peter almost a year. The only thing that matters is have I made money with his service. I think I have finally turned the corner using Peter’s EW. I have not had a losing week in the last 5 months. Thanks Peter, for your amazing amount of hard work. —RW |
Rise above the rest … SM 2
Rise above the rest …I have only ever met a few people who, in their chosen fields (astrology, medicine, music, martial arts, technical analysis), rise above all the rest and you are one of them…you have ‘the gift’…and that’s why I’m a Trader’s Gold member. —SM |
A true expert in Elliott Wave FL 2
A true expert in Elliott Wave …You are a true expert in EW analysis. What you provide is not available anywhere and is priceless. Subscription on your services is the best thing I have ever done. Many thanks for your effort to make me a better investor. I now have more trust in my investment decisions. I hope you will continue the excellent work! —FL |
Couldn’t be happier … KK 2
Couldn’t be happier …The analysis and insight you provide is simply amazing! I’ve been trading the futures and equity markets for well over thirty years and usually average around 5% monthly. Since joining your Traders Gold Service two months ago, that number has better than doubled. I couldn’t be happier.—KK |
The best of them JL 2
The best of them …Last couple of years, I subscribed to several ‘market traders’. You are by far the best of them and the personal contact is awesome. Daily and daily updates are very well written! Besides your expertise in EW, I also like your cycles analysis. Best investment I ever made! —JL |
Get an upper hand … JC 2
Get an upper hand in trading …Seeing all the different currency pairs and the wave structures and hearing you explain why this has to do that on a nightly bases gives one a upper hand when trading. Elliott Wave applies to all stock and indices and can be applied to any candlestick chart. If someone ask what you want for Christmas – Tell them a membership to Peter’s “Traders Gold!”—JC |
US Market Snapshot (based on end-of-week wave structure)
This chart is posted to provide a prediction of future market direction. DO NOT trade based upon the information presented here (certainly NOT from a daily chart).
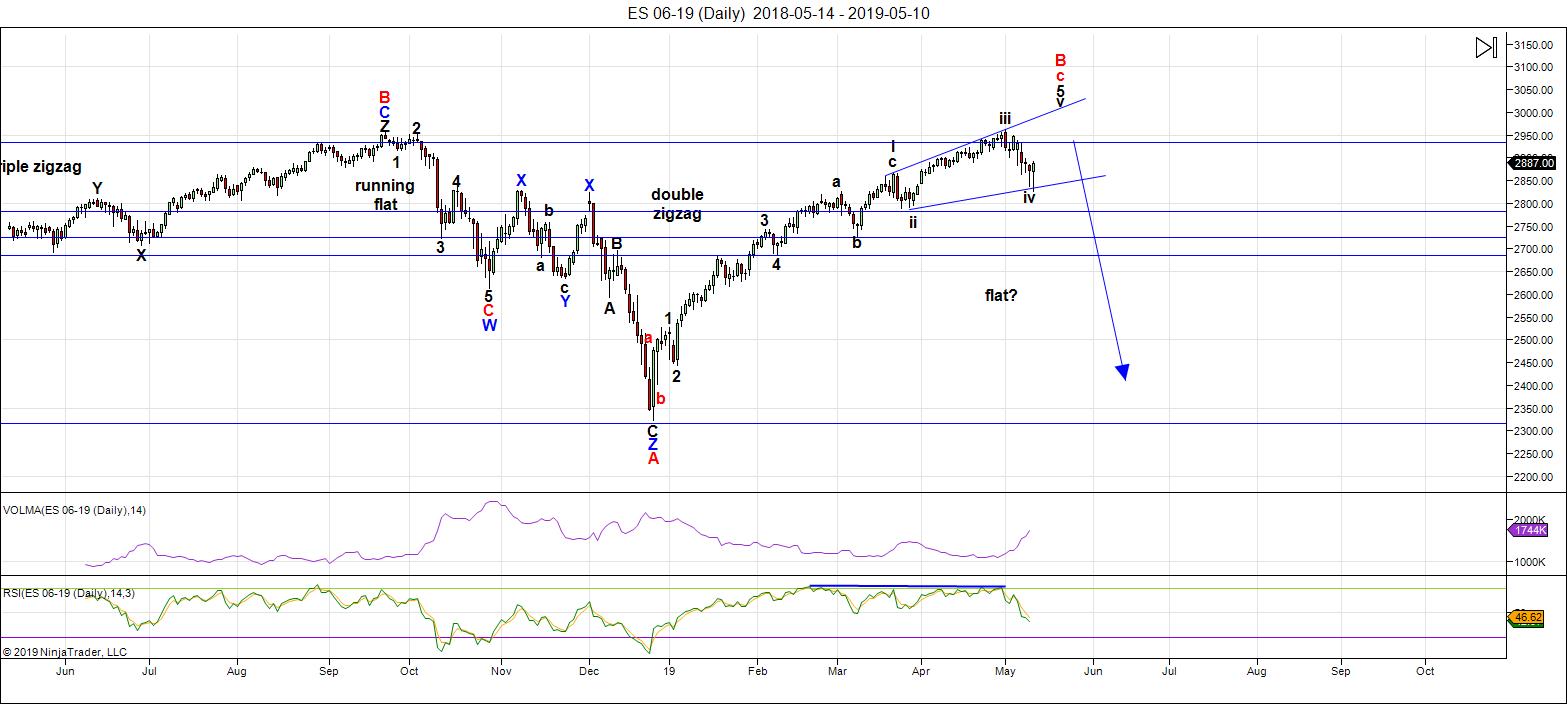
Above is the daily chart of ES (click to enlarge, as with any of my charts).
We've been sitting at the top now for well over a month. This weekend, we're in the final leg of an ending expanding diagonal (this is an ending pattern).
All US indices require a new high. The market will not come down until they reach it. Until this happens, the direction is still up.
The next major move is to the downside.
I expect to be reviewing possible entries in the Chart Show this Wednesday.
While the NYSE is in a large 4th wave, ES and SPX are still topping out in a third wave. This non-confirmation between major indices near a top is very bearish.
The wave up from Dec. 26 in ES is clearly corrective and, as a result, must fully retrace to the downside. This is supported by the US Dollar Index, the major USD currency pairs, WTI Oil, along with DAX, TSX, and other international exchanges.
Summary: My preference is for a dramatic drop in a 4th wave to a new low. The culmination of this drop should mark the bottom of a large fourth wave in progress in the NYSE since January 29, 2018 - over a full year of Hell. It may be a dramatic drop that is quite fast; in any case, it will target the previous fourth wave area somewhere under 2100.
Once we've completed the fourth wave down, we'll have a long climb to a final new high in a fifth wave.
___________________________
Trader's Gold Subscribers get a comprehensive view of the market, including hourly (and even smaller timeframes, when appropriate) on a daily basis. They also receive updates through the comments area. I provide only the daily timeframe for the free blog, as a "snapshot" of where the market currently trades and the next move on a weekly basis.
______________________________________
Sign up for: The Chart Show
Next Date: Wednesday, May 22 at 5:00 pm EST (US market time)

The Chart Show is a one hour webinar in which Peter Temple provides the Elliott Wave analysis in real time for the US market, gold, silver, oil, major USD currency pairs, and more. You won't find a more accurate or comprehensive market prediction anywhere for this price.
Get caught up on the market from an Elliott Wave perspective. There’ll be a Q&A session during and at the end of the webinar and the possibility (depending on time) of taking requests.
For more information and to sign up, click here.
| "I think you are the only Elliot Wave technician on the planet who knows what he's doing.” |
| m.d. (professional trader) |
All registrants will receive the video playback of the webinar, so even if you miss it, you’ll be sent the full video replay within about an hour of its conclusion.


I have seen enough. I think I know what is going on and how to trade it. I will ‘fess up if it turned out I was wrong. ☺
Tom,
May be a good buy point shows up on 15th or on 17th. Do you think as per energy chart we ramp higher from here till tomorrow or Wednesday.
this is the energy chart for May 14th
https://imgshare.io/image/may-14th-tuesday-2019-supplemental2.pAarp
Its 1pm EST. the market is at the lows. If we close around here, I will buy puts (even at this level). The 2:30 to 4:00 is very important
I had a premonition last week of a 1000 pt drop
but I did not mention it because the number was so big
and scary it scared me
but folks today looks like the day of fulfillment
hard to believe
Congrats Tom! Really happy for you and those who profited from today’s big drop.
You shared on 5/3, “feast your eyes on the 13th of May.” I did not forget this and planned to go short in the morning as the Friday ramp was so convincing that I thought better wait till Monday. My poor timing cost me significant gains on 5/6 and today.
Cut left over hedges in half
Leaving the rest alone .
2 words
Expanded flat .
Just a thought
Do you think there is enough time for that given your bullish June outlook ?
Did we break ED trend-lines?
QQQ most oversold (RSI5) since 12/24 and 10/11 (bottom of 1st leg down from late Sept top…
Think party just getting started?
A down
B up to the new
C down now
Expanded flat
The March lows must be broken ( to consider an expanded flat on cash Dow ) and I can’t rule out
Even lower prices basis the cash Dow yet 24906 is my key .
Plenty of time to break further to the downside all the way
To the Jan 22 lows . But right now 24906 is my extreme to keep my eyes on
And this entire week I’m not going to dare attempt to call it .
I have zero opinion on where this market is going at this moment .
Not even going to try and call it for this week .
Untill we enter may 22 June 3 all I know is that is the cycle low period .
Enjoy the week
Looks like it doesn’t it? If so, an interim top is in and we have a ways down to go Joe. ☺
Mr trump
Your making China more competitive against the United states
Lol
Can’t call this China manipulating their currency .
https://www.marketwatch.com/story/chinas-yuan-on-track-for-worst-day-in-nearly-4-years-as-trade-war-escalates-2019-05-13?siteid=yhoof2&yptr=yahoo
Yep! Pressure on Chinese currency and equities is going to get intense…
Looks like we are consolidating losses. More downside I surmise….
New lows confirm Friday’s bounce as corrective folk…wow!
Waiting for a break of 2800…that event removes all doubt imho….
This is a very scary market close. Last 30 min to go at the lows. Not good. I have reset some shorts through puts.
Some very strange counts out there. Insanity reigns!
The move down today a second wave correction in an impulse UP???!!!
You’ve got to be freaking kidding me!!!!!
These people are $@*&%%## NUTS!!! 😬
Moment of truth…2800 falls and this thing is done…!
Another stealth futures unwind below 2800….?!
Don’t know whether it will be stealth, but the set up is very dicey. We can get a 50 point move in SPX in either direction and VIX is at 20. Insane. We can be up 50 and then break 2800 tomorrow. The door is wide open
Well folk, to my eyes we clearly have five down on the daily chart. Am I missing somethin’?! 😉
https://www.youtube.com/watch?v=8vDO-S9TtBM
Randy’s update.
Randy is a trader’s trader! 😉
Congrats Tom! Really happy for you and those who profited from today’s big drop.
You shared on 5/3, “feast your eyes on the 13th of May.” I did not forget this and planned to go short in the morning as the Friday ramp was so convincing that I thought better wait till Monday. My poor timing cost me significant gains on 5/6 and today.
You are not the only one P. Many of us missed it looking for a new high!
There wilk be other oppotunities. ☺
May 21 will be another day to watch for
keep that date in your note book
Thank you Tom, thank you Verne. Won’t miss 5/21!
I was playing with Fibonacci numbers
I won’t changes my cycles work because it’s fixed
Yet I found this interesting enough to post
Jan 26 2018 plus 34 weeks is Sept 21 2018 ( very close to the Sept 20 2018 high )
Adding 34 weeks to Sept 20 2018 i gat May 16 2019 .
A top to top to bottom count perhaps ?
On another note Dec 26 2018 plus a fib 144 calendar days = May 19 2019
I’ll bet there are more Fibonacci relationships using trading days .
I must stick to my may 22 June 3 time frame but I find this a bit fascinating
This top-to-top count is called 40 week Hurst cycle:) runs shorter for the US indexes 32-36 weeks….
I was seeing the same patterns like above to fit all indexes, but now I am in your camp:) looking DJ from late February this is some flat probably b/B .
On 23.Feb I have posted comment on my blog – something like this:
“One of the best market breadth indicators is the McClellan Summation Index.
In Dec.2018 it moved to extremes seen only in 2002 and 2008 so multimonth rally was easy call.
After that it moved for 9 weeks from extremely oversold levels to extremely overbought. Extremely overbought like the rallys in 2003/2009/2016…. how this rallys played out:
2003 – 13 weeks up(but 3 correction in the beginning) 9 weeks flat https://imgur.com/a/jspvoQz
2009 – 9 weeks up 9 weeks expanded flat correction https://imgur.com/a/LyiSarI
2016 – 10 weeks up 9 weeks expanded flat correction https://imgur.com/a/0SPvZ2H
Currently week 9 now we should see 9-10 weeks sideway move probably expanded flat for 20 week cycle low.”
11 weeks later we have the expected pattern on schedule and namely exactly like in 2003/2009/2016.
I do not say new bull market has begun, what I am saying is it is unlikely that we have reversal.
With the McClellan Summation Index showing such strength it is very unlikely to see a crash more likely just a correction.
The patern fits with DJ,NYSE,RUT,DJT… probably EEM too. SPX/NDX not so much that is why I was watching the patterns from this post… until yesterday.
Now I think we are seeing expanded flat for b/B and 20 week cycle low.
Something like this – https://imgur.com/a/8csXAUr
The vertical lines are the 18 month cycle lows(grey) and 4 year cycle lows(purple)
this is the energy chart for May 14th
https://imgshare.io/image/may-14th-tuesday-2019-supplemental2.pAarp
Thanks Tom, today we could see a big up and this will fade again..
VIX flying a bull flag so I think we have more downside.
I missed the initial move down because I got sloppy and ignored one of the most poweful market signals there is- bteak and back-test of a bearish rising wedge. I feel like a complete schmuck as I actually posted the breaks in real time but was too much of s WUS to get positioned for what was clearly coming!
Live and learn.
A green VIX print will signal the start of the next move down.
Trade safe everyone!
WAY too hard on yourself Dude! My 2 best days by far were May 7 and 9 because I planned and stacked VOL (and booked it). Friday and Monday chopped me up (thankfully I held TQQQ 55.07 overnight for decent gain), but wanted to cuss like a sailor most of yesterday. It is tough to read whether we are ready for a breakout (ex. bull flag) or reverse, either long or short. I got a lot wrong on Fri but will get back to my game plan… I know you will too! (don’t want to sound like cheerleader, just want to get back on the right and best wave) Cheers!
Out TQQQ @56… NOW WHAT 🙂
🙂
I see your bull flag, my concern is stacked resistance from 18.95 to 21.50. I want (and will wait for) more OB or OS indication on at least 60min..
Thanks Tom! Adding oil shorts..looks like this could be minor 2 up with a 3 coming
when I post if anyone sees different feel free to counter..not always right lol
be careful.
Second that remark.
thanx i will watch
Hasn’t changed since the last Chart Show.
Just a snapshot
I’ll be out of range so no phone for a few days .
So far the cash Dow has taken back the 25459 and the 25555 pivots
The 25711 level was not a pivot yet getting back above there I’d view as constructive .
They say trade what you see ( not what you think )
So no thinking today 🙂
https://imgur.com/gallery/AIa54TU
May 15th energy chart
https://ibb.co/8gZHJCZ
Hi Tom,
Looks like we dip tomorrow and then ramp end of week. Is my understanding correct?
see update below
Thanks Tom, I was looking at my astro work and I have a turn date on May the 19th and 21, so I m curious if we will see a big up also on monday?My next date is May 31, this should be a low also.
yes
This energy chart I posted on the 14th played out very nicely for the 15th
the long term blue line chart was inverted today
Tom is the weekly energy chart still the same ?..I think it showed a large ramp up on the 20th..
Looks like a 5,3,5 up corrective retrace underway. If so, we should see one more five up after a three wave move down tomorrow and a lower low to complete this move down.
VIX suggesting move down not quite done. Let Mr. Market be your guide, and trade safe!
yes
Energy chart update for may 15 thru 17
heads up folks
next week is going to be mucho loco
https://imgshare.io/image/may-13th-17th-energy-chart-blue-line-and-red-line.p98nd
Thanks Tom,
watch Friday expiration day and that is mostly UP and expecting a HIGH on 21th
succes it looks good
yes 21st is the high
attached is the energy chart for next week
it’s a wild one!
https://ibb.co/G0zbH9w
Thanks Tom, I agree with May 21, but for now we should also make higher lows en higher tops..
So do you think todays ramp is done and we will go down from here. I am trying to position for 21st ramp, But I was expecting a lower low test first. Doesn’t look like we get and test below 2800 now.
Indeed!
I have over the years developed a few trading strategies after going through the school of hard knocks and learning one has to take personal responsibility for one’s trading success or failure.
It is not enough to have just good analysis. One also has to have a systematic and consistent approach for disciplined entry and exit of trades. It seems although I am well aware of this, every few months I get to re-learn it after trying to get cute!
I have previously shared regarding the way I use credit spreads to get positioned during counter-trend market moves.
Anothet pattern I noticed over the years is a pattern I call “The Coil”. I would see price explode from this kind of formation but would often miss the opportunity because someone would dismiss my observation because perhaps it did not meet the “technical” definition of the designation I assigned it! That was one of the things that stamped clearly in my mind that analysis and trading are two different things. Related, But DIFFERENT!
Why am I saying all this?
I will tell you.
VIX is now forming one of the biggest coils I have seen in some time.
Do I have a proper technical descriptor for the pattern?
No I don’t.
Who gives a rat’s petootie, as long as you can profitably TRADE it!!!?
Trade safe! 😇
Agree with you there. I was able to re-short on yesterday’s bounce (not the full size though as my last offers were up at 2860 and 2870). Still better than being flat. Price action is atrocious. As a trader, this chart looks way too dicey to be not short. Of course things may turn around on a dime with some headline. But gut to my head, I would rather be short than long.
Absolutely. In my trading time-frame, I view the move up as countter-trend and traded it accordingly. Speaking again of a TRADER’S time frame, it is difficult, imho, to consider a 700 point DJIA move as being counter-trend. We could today STILL be in only a smaller b of a B up with a small c up yet to come. My expectation of a re-test of the broken 2910-2920 shelf may have been a bit early.
Of course, the other possibility is that the last low was the b of an expanded flat, in which case we just completed a c up with resumption of the down-trend and new lows ahead. A green print today negates this alternate scenario imho…
Morning, thank you Tom..you work and sharing is appreciated ..hope next week plays out that will be a profitable one..
Verne..thanx for all your additions..everything always helps.happy trading today
QQQ trying to rally as VIX & TVIX move up. “Usually VIX wins the battle. In meetings for 3 days, best to you trading.
Yep! We are heading higher as NDX leade the way. Glad I rung the register at the morning’s low.
Now THAT’s more like it! 😉
Another interesting way of looking at recent price action is as a down-trend channel on the 5 hour chart. You can see that price has fairly consistenly ping-ponged in alternate tags of the upper and lower trend channels. Question today is whether, looking at that channel, we tag the upper or lower boundary next ( or of course break above, or below )…. ☺
Beautiful! Isn’t it? 🙂
BTW, look out for “truncations” and don’t over-stay your welcome!
These banksters are VERY tricksy! 😁
I wouldn’t worry about truncations. There’s never been one.
I knew you would say that, ergo the quotation marks ☺☺☺
Am I getting too predictable ????
🙂
Hehe! 😁
NDX 100 in similar channel ( 1 hour chart) formed by series gaps down and price movement up to test open gaps. Now price has moved slightly above top line of down-trend channel into resistance area at last gap down. Let’s see how price reacts here…
VIX gap filled. Support here spells trouble for the bulls…
Bulls need to retake SPX gap at 2879.02 to keep the bullish case alive…
Gaps proving resistance. Time for a bit ‘ good ole’ bankster leverage to push past…hehe! 🙂
Quickly got out of DWT with gap down this am..so I was careful 😉
Gonna save my duckets for next week..and let this week settle out
Gold ducats??!! 🙂 🙂 🙂
Thar’ she blows! 🙂
Dojis at the top of the ramp…
2848.34 the bull’s line in the sand…they have to hold it…or else…! 🙂
My, they are predictable!
A leveraged move to overcome near term resistance.
They cannot hide when they unwind it and savvy traders will know exactly what to do! ☺
Finally got time to see the Chart show. Great work Peter T. Should have taken some time out yesterday to see it. I was itching to reset all my shorts – thanks for providing much needed patience.
Patience is a virtue!
I was starting to get concerned about the failure to re-test the 2900 broken former support/resistance shelf. 🙂
Thanks for the kind words, Vivek.
Tom,
Did your chart got translated by few days are we getting the monday ramp today.
just go to the very first chart I posted this week
the mirrored chart
and you will clearly see what’s happening
Thanks Tom.
Going my the mirrored chart we can expect a severe downturn swing next monday/Tuesday.
correct, that’s the way I see it also
https://ibb.co/QpbL7g8
reading May 20 turning point ..seems to be a date I read over and over..M.A. has 22 as possible Turning point..
Nenner calling for an important cycle low next week.
Joe has also mentioned May 22 as am important date – but he is very bullish for
June
Bingo!
Right back up to support/resistance shelf!
Sweet! 🙂
I think this is just going to be a ramp up until it turns..I see dow 2600-26,400 area but could go for more..then turn..
Move below 2857.89 before the close says we’re done! 🙂
They CANNOT hide when they unwind…He!he! 🙂
Looks like one more wave up to actually tag the 2910-2920 region.
They after all really would like to draw in a few more giddy bulls before…well, you know… 🙂
This website is for educational purposes relating to Elliott Wave, natural cycles, and the Quantum Revolution (Great Awakening). I welcome questions or comments about any of these subjects. Due to a heavy schedule, I may not have the time to answer questions that relate to my area of expertise.
I reserve the right to remove any comment that is deemed negative, is unhelpful, or off-topic. Such comments may be removed.
Want to comment? You need to be logged in to comment. You can register here.