
The Elliott Wave Principle Book (the errors)
 In the process of building on the work of Ralph Nelson Elliott and the interpretation of his work provided by Robert Prechter and A.J. Frost, my research has uncovered a lot of errors and omissions in “The Elliott Wave Principle” book. I would assume that any good EW analyst has done much of the same work. Or do they believe everything they read?
I’ve decided to provide my findings as a lead-in to a comprehensive course I’m developing. I’m providing it here as an example of the erroneous information that’s out there, to support my comments that the tools many EW analysts are rather “dull” and this is the reason for all the EW misinformation and counts that are simply incorrect.
I came to Elliott Wave Theory through Robert Prechter and his EWI site. After over a year as a subscriber, I became so dismayed with the continual errors of his analysts, that I determined to take a few years, devote myself to the market and the EW principle, with a goal of eventually excelling in its use. I discovered so much more in the process than has been written by either Prechter or Elliott (and several gross errors in the Prechter/Frost publication).
But I’m only expanding on their work; I’m not doing anything extraordinarily ground-breaking. My belief it that the work I’m done solidifies the principle and maybe, just maybe, it will help others in their analysis.
I’m convinced that Elliott’s description of the movement of the market should be considered a science. The reason the Elliotticians waver in their analysis is because of the errors in the Elliott Wave Principle, most of them due to the additions, or changes to Elliott’s original work, done without proper research.
Here are a few examples (all the charts expand when you click on them):
Ending Diagonals
There are two examples of ending diagonals in the book, one totally invalid.
The first example (p.39, fig 1-18) isn’t even an ending diagonal, and it’s glaringly obvious as to why. One of the key determinants of ending diagonals is that the fourth wave must intersect the area of the first wave; they must overlap.
In this example, they don’t. End of story.
The second example (p. 38, fig. 1-17) is a valid example of an ending diagonal. However, one of the defining tests is that it must be in a fifth wave, in this case above the fourth wave. However, the trendlines drawn suggest that the fourth wave is part of the ending diagonal. It cannot be, based upon very definition of an ending diagonal.
A fourth wave triangle has the fourth wave as part of the triangle (it forms the A wave, in fact)—an ending diagonal does not.
An ending diagonal starts with the first wave of the diagonal. The lower trendline should begin on wave ii and contain wave iv.
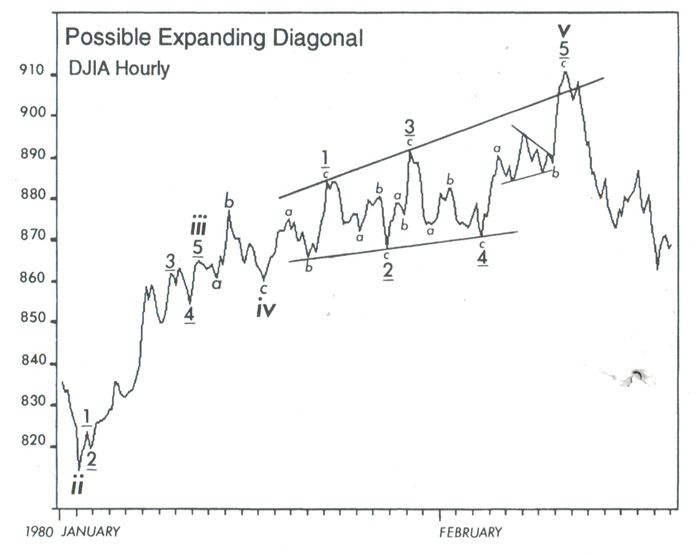 An expanding ending diagonal is a Robert Prechter invention (added to Elliott’s work). However, nobody has ever seen one. All we have is a line drawing in the book and it’s shown to the left (p. 39, fig. 39)
When I went to the original source, which is a DJIA hourly chart from early 1980, I found that the position of this pattern within the larger structure didn’t support the supposition that this existence of this pattern is remarkable, important in any way, or even repeatable.
It’s at the top of a B wave in a continuing corrective pattern. Ending diagonals are supposed to be in C waves, or most importantly, fifth waves of an otherwise impulsive pattern. This one is not.
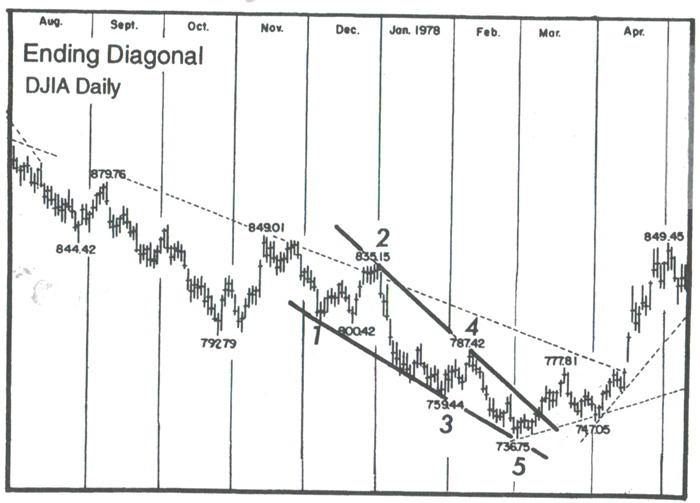
Below is a chart pulled from the DJIA showing the above example in its original habitat.
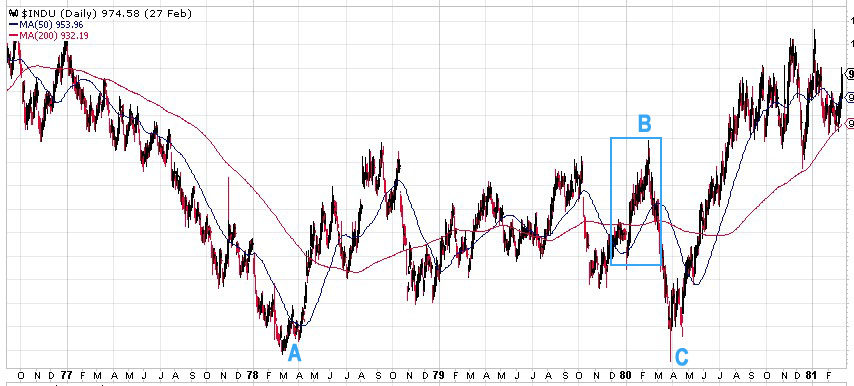
Above is a daily chart of DJIA showing the position of the supposed ending expanding diagonal. It’s at the top of a B wave in a large bearish correction. What value this has is completely beyond me. It’s not even interesting.
_______________________
Leading diagonals
Here’s another “ghost of charts past.” There has not been a valid chart presented to support this pattern anywhere that I can find. It was a Prechter addition to Elliott’s work.
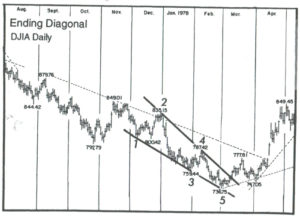
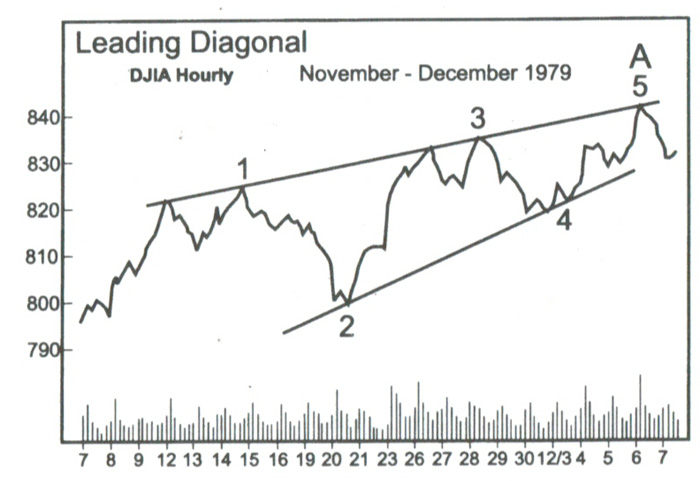
The only example we have is in the book and it comes from the DJIA hourly chart in 1979 (p. 40, fig. 40)
Let’s look at where this leading diagonal originally existed, by taking a look at the original chart, but over a longer period of time.
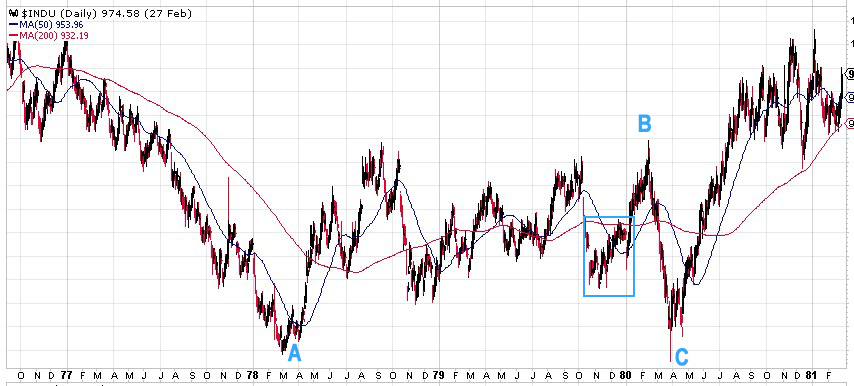
Above is a daily chart of DJIA. It’s actually the same chart from the ending expanding diagonal idea described above. So, what we have is an example of a leading diagonal and an ending expanding diagonal in the same corrective B wave. That’s quite a wave, just chocked full of diagonals! And it’s a B wave, a place where diagonals are very unlikely to appear.
Even if this was a repeatable pattern, providing an example in a corrective B wave is hardly an example that is likely to have any effect on the count. It certainly doesn’t here. It’s at most an odd pattern that’s not particularly interesting, and is of little practical value, imho.
Outside of this questionable example, nobody else has ever seen one.
__________________________
Truncations
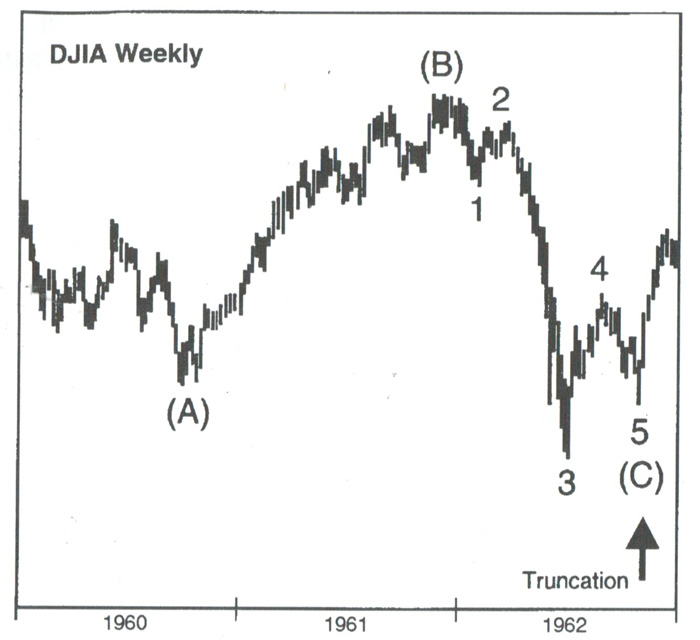
Nobody has ever seen one. The example charts in the book on this subject are invalid. The example on the left is a three-wave, fourth wave of a sequence, mislabelled in the chart to the left (p. 36, fig. 1-13).
It looks good here, but if you look at the bigger picture, it makes no sense. The chart below tells the real story.
It’s really an odd example, because it’s an ABC structure, which is a corrective wave. The C wave down already has a small fifth wave within it, and the overall look is consistent with a normal C wave.
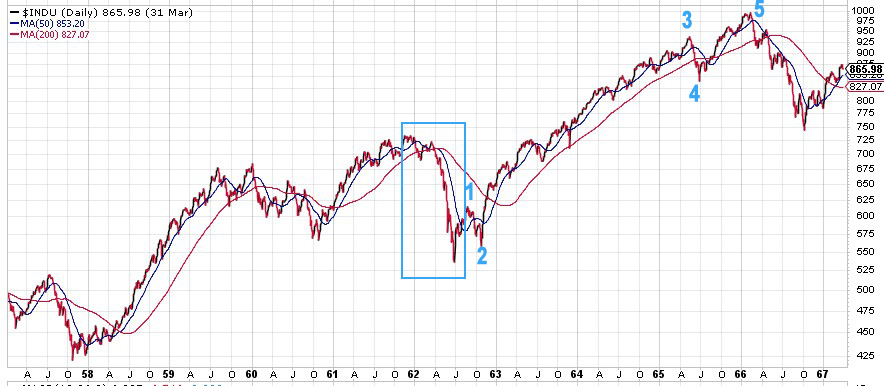
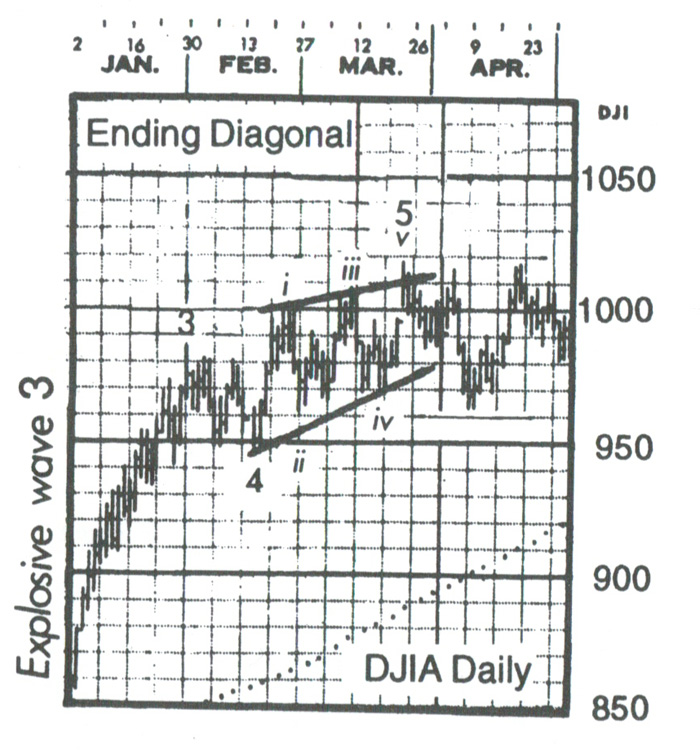
Above is a daily chart of the DJIA showing the “truncation” example above in its natural habitat—in a bullish third wave sequence, surrounded by impulsive waves, it’s simply a small fourth wave correction, not a truncation of anything. As such, it’s supposed to be in three waves!
Truncation Example #2
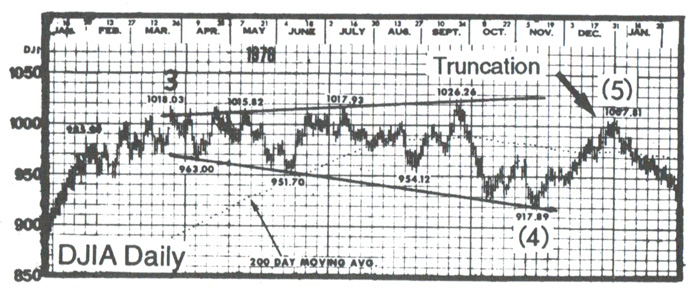
Above is the second example of a truncation from the book (p.36, fig 1-14).
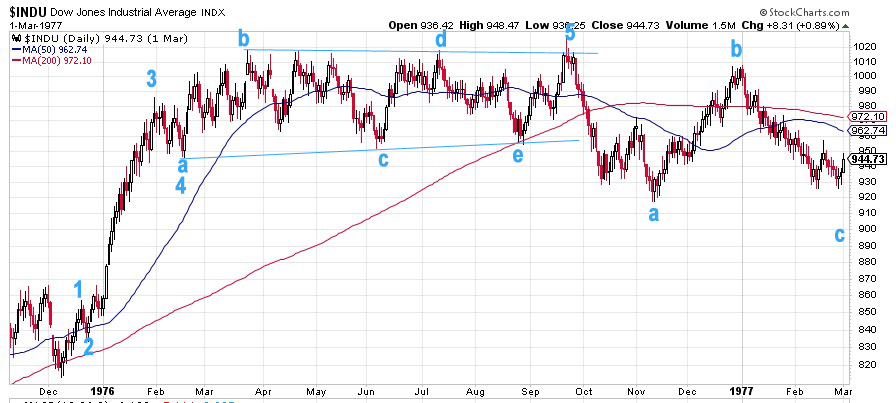
Here’s the same chart labelled properly – another daily chart of DJIA. This wave up from December, 1975 is an impulsive wave with a simple contracting triangle as a fourth wave (abcde), with a small 5th wave up to a final high. I have no idea what they were thinking when they labelled it the first time. If it’s a truncation you’re suggesting as a result of your analysis, it seems to me (as Mr. Prechter states in the book) that all other options should be exhausted. He apparently didn’t heed his own advice.
Bob Prechter, in his writings, has expressed a desire that EW Theory be classified as a science. However, his adoption of this truncation “anomaly” certainly doesn’t support this desire. You can’t have a valid scientific theory that fails periodically. After going back a hundred years in the DOW, I can’t find a single occurrence of a truncation either at market highs or lows.
As far as I’m concerned, truncations don’t exist; nobody has ever seen one.
_______________________
Inadequacies in the book
Here are some areas in which the information in the book is not complete, imho:
Second Waves. Second waves in an impulsive pattern must retrace 62%, based upon my experience. I’ve cited this several times over the past two years and it has yet to fail. This fact is often the difference as to whether analysts are correct in their calls, imho. In Prechter’s book, the requirement is that they only have to retrace 38%, which has caused analysts to be wrong over and over again.
Fibonacci Ratios. The role of fibonacci ratios in both corrective and impulsive markets is woefully incomplete in the book and, in my work, has time and again proven the most important factor in determining both wave end-targets and whether a structure is corrective, or not.
Third waves of an impulsive sequence are almost always (I haven’t found an exception yet) 1.618 or 2.618 (in an extension) times the length of the first wave. Fifth waves are typically 1.618 X the length of the first wave. They can extend to 2.618 times the length of the first wave, but this is rare.
First Waves
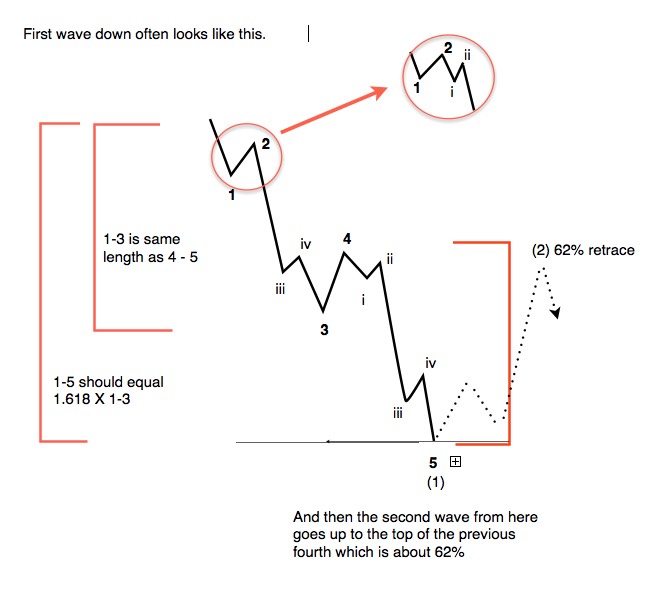 First waves of an impulsive pattern have a different structure than all other impulsive waves. This fact simply isn’t addressed in the book. This is why first waves often have the appearance of a three wave sequence. The different is subtle.
In a true impulsive first wave, wave 4 must retrace to the level of wave iv in the diagram and also must reach a retrace level of 38% of the distance to the beginning of the first wave.
If it does not meet this requirement, the wave is to be considered a zigzag, which is a 5-3-5 combination (in this case, it’s corrective).
Waves in Five. The difference between a corrective five wave pattern and an impulsive five wave pattern has not been addressed at all in the book. This perhaps the most important distinction in determining corrective vs. impulsive wave structures.
B Waves as Irregular Tops. I’ve tackled this interesting phenomenon at the top of this EW expose with a chart showing the SP500 from 2009 to today. Irregular tops appear (if at all) at the top of an impulsive trend. This is referred to as an “irregular top,” which Elliott identified as a feature of his theory, for different reasons that don’t apply to the current situation I describe above.
But, here we are with a B wave. It should not be ignored, or “papered over” by breaking the rules. That’s not the proper way to advance a science. Recently, I’ve seen a chart from Mr. Prechter that ignores a fifth wave in order to skirt the issue of this irregular top.
In summary, what we have a technical publication riddled with errors. It’s no wonder that elliottwave practitioners come up with different counts. However, there is seldom more than one correct count. The issue is the rudimentary condition of the tools they’re using.
I’ve been attempting to research these tools with the goal of clearing up the misconceptions. That’s been my goal.
I’m not disparaging the work of Robert Prechter. He did a great service by publishing this book, which in my view, is the most comprehensive interpretation of Mr. Elliott’s work. However, like any science, it often undergoes intense scrutiny, with the ultimate goal of proving its viability without doubt. In my small way, this is what I’ve been attempting to do, and all the research I’ve done doubles down on the integrity of Ralph Elliott’s work and the Elliott Wave Principle itself.
________________________
I get asked often why EW analysts come up with different counts. Erroneous information is a great foundation on which to construct a building that will eventually collapse. If science is rock solid, then the building will stand forever.
However, if your tools are blunt, you’re going to do a less than adequate job as an analyst, through no fault of your own (other than laziness, I suppose).
Some have offered statements to the effect that the Elliott Wave Principle is a subjective method of analyzing the market. That’s an attitude that suggests a minimal understanding of the process.
Prechter himself spent a few pages on this very topic:
“Despite the fact that many analysts do not treat it as such, the Wave Principle is by all means an objective study, or as Collins* put it, ‘a disciplined form of technical analysis.’” — page 94
• Charles Collins wrote the foreword to the Elliott Wave Principle.
As a result, I don’t generally look at anybody else’s work. I don’t let news or events play any part in my analysis. My job is to remain completely objective. I only look at indicators after I have done my initial analysis to see if they support (or not) my prognosis.
So, as an EW analyst, are you an “artist?” Perhaps, because you’re given a set of tools that are roughly hewn and have to use them to bring clarity to a market that moves in a predictable manner, churning out the same patterns over and over again, with Fibonacci relationships to each other most often provide multiple target options.
I suppose the real art is weeding out those options through experience. So, there is art in analysis, but I believe how the market moves to be a science that was uncovered by Ralph Elliott, with rules and guidelines that were refined, clarified, and communicated by Prechter and Frost.
In my work, my interest has been in refining the tools, finding the errors in the communication of Elliott’s work. However, the free blog is obviously not the correct platform through which to undertake this task.
It looks like it’s time to move on, by spending my time where I can have more of an impact.
Difference in 5 wavers
Omar,
Let me start by saying that there are a lot of errors in “The Elliott Wave Principle.” I’ve written about many of them before, but I haven’t spent a lot of time on the issue of “5-wavers,” and the difference between the two types. It isn’t addressed at all in the book. In fact, even though impulsive waves are addressed, the book doesn’t give the wave measurements the import it deserves. I’m not going to address all of this here, but I will do a brief overview of the difference between 5-wavers.
There are two types of 5 wavers – “simple” and “impulsive.” Impulsive waves are actually very rare and are only found in trending markets, not corrective ones. The rules for an impulsive wave are very strict: Waves 1, 2, and 3 must have 5 subwaves, the wave must have “the right look” (the correct proportions) and the lengths of all the waves must measure to the correct fibonacci lengths.
Since 2009, we have had no impulsive waves in the NYSE indices. However, we have in the Nasdaq-related indices, but only on the way up from the low in 2009.
Simple 5-wavers are found in corrective waves, are not impulsive by any means, but often their fibonacci subwaves will have impulsive wave ratios. You can find “simple fives,” as I like to call them in A, B, and C waves (ie – in any corrective wave).
In the corrective wave structures, you will never find impulsive waves, so here are the obvious corrections to the book:
- zigzags never have impulsive waves (structure: simple 5, 3, simple 5)
- the C wave of a running, extended, or regular flat is never impulsive (structure: 3, 3, simple 5). In fact, these C waves usually have a 5th wave subwave that is not itself in 5 waves)
So, to your question. C waves are never impulsive waves; they can be “simple fives,” or 3’s, or some other pattern, like an ending diagonal, for example. They can be anything they want to be.
Where a lot of confusion comes in, I think, is that the convention is to number impulsive waves the same way we label “simple fives.” However, one is in a trending market (impulsive) and has VERY strict guidelines and the other is in corrective patterns (simple five) and has no guidelines, other than the fact that you must be able to count 5 waves within them.
The difference between these waves isn’t even addressed in the book and it took me a couple of years early on to prove the difference and refine my own set of rules around them. So, the book is a good start, but Prechter and Frost made changes to Elliott’s work (and some assumptions) that they should not have made. In any event, as I consider the Elliott Wave Principle to be a science, like any science, it evolves as we study it more and truly understand the intricacies. Too many have taken the book at face value, a book written decades ago.
Now to WXYZ labelling: When a corrective large pattern (could be a large C wave) has individual patterns within it, we use the WXYZ labelling. This denotes a more complex structure. For example, when a C wave is composed of 3 zigzags, each of those zigzags should be delineated by a W, Y, or Z. The ends of each subpattern are labelled with an X.
Getting to your last comment about the B wave at the top of the market. Very obviously, it cannot possibly be an impulsive wave up — that’s an absolutely ridiculous conclusion, based solely on the requirements of an impulsive wave. And that’s only one of several reasons it can’t possibly be one — the waves adjacent preclude that opinion. I’ve seen a few ludicrous labelings that I can only just laugh at. It shows a complete misunderstanding of the basic rules of the Elliott Wave Principle, even with the errors in the book.
Hope this helps.


