
The Second to Last (Penultimate) Pattern
 Fourth wave triangle patterns are a warning that the larger trend is about to turn the opposite direction. This is an Elliott Wave rule: It happens every single time we get a triangle in a fourth wave position. Every time!
That’s the pattern we’re in now, and it means that we’re just a few weeks away from a new all time high.
This weekend, I’ll take apart the triangle pattern a bit and try to provide more information as to what to expect going forward, as this penultimate pattern plays out.
Understanding Triangle Patterns
Elliott Wave Theory has two primary components:
- fibonacci wave relationships that give clues as to wave lengths (and probable measured targets)
- wave counts in impulsive waves and corrective patterns (each corrective pattern has its own rules and guidelines)
Trend waves, or impulsive waves (which we haven’t really had since 2007), consist of a five wave pattern that measures accurately to prescribed wavelengths. We’ll get a set of impulsive waves in the A wave down after the top of the market.
Corrective waves are typically in patterns. You’ll see a list of corrective patterns in the sidebar in the Trader’s Gold area. They’re there so you can become familiar with the rules and guidelines for the pattern we’re in.
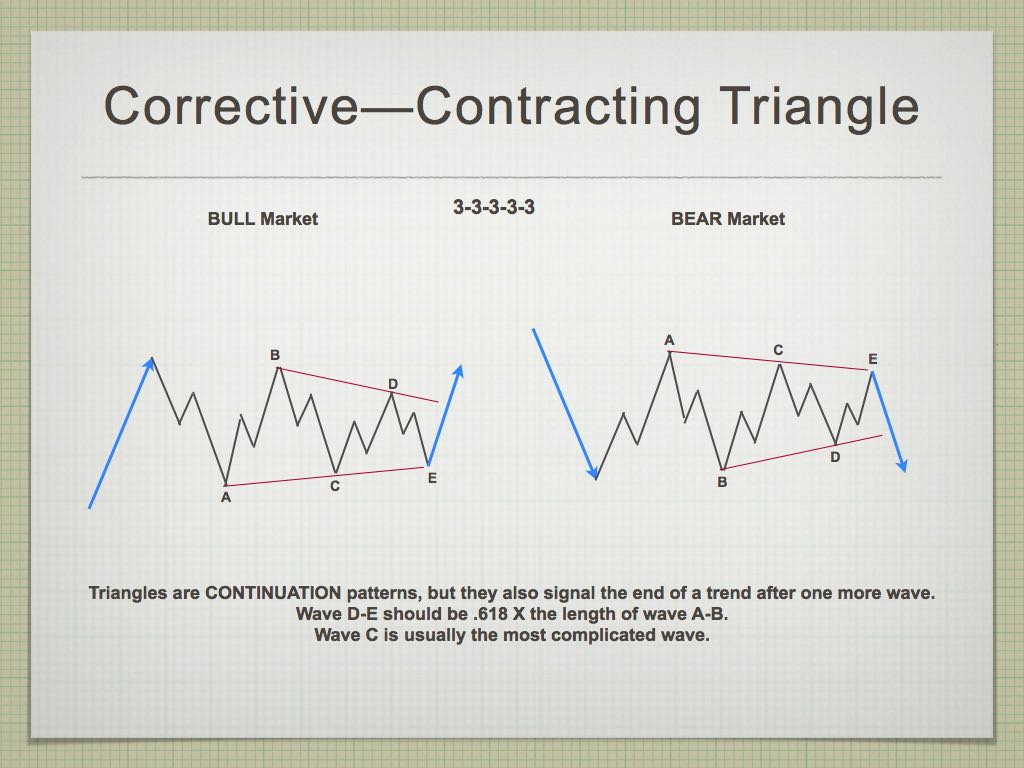
Contracting triangles in a fourth wave position (which we have unfolding in ES and the SP500 at the moment) have rules, which cannot be broken (or the pattern is negated) and guidelines, which are typical attributes of the pattern, but don’t necessarily always play out.
With a contracting triangle, the rules are that it will have a set of five waves. However, the triangle pattern is never actually confirmed until the D (or fourth) leg is in place. That means the high probability trade is always the E leg, and the final fifth wave at the end of the triangle. Fourth wave triangles (or any type) warn that after a final fifth wave to a new high (bull market) or low (bear market), the trend is going to change.
However, within the triangle, there’s really only one rule: each of the five “legs” of the triangle will trace out in three waves. The C leg is usually the most complex, but this is a guideline. There are no other rules within the triangle, and this makes it a risky pattern to trade (within the upper lower trendlines. Keep that in mind as this triangle plays out, and for future triangle patterns.
There is Almost Always a Second Wave
Most traders over-trade. They don’t have the patience to wait for the set-ups. Set-ups (from and Elliott Wave perspective) consist of second wave turns (at a fibonacci retrace level of about 62%) and turns within patterns (once the pattern has been confirmed.)
Picking tops and bottoms is risk-prone. Probable tops and bottoms can keep going, and even if you have a measured objective (a fibonacci ratio), there is seldom just one measured fibonacci ratio to deal with. You don’t have to high probability spot to place a stop; it’s guess-work. Waves typically turn at a fibonacci measurement, but which one?
However, after a 5 wave first wave in either direction and a second wave in three waves that retraces 62%, you have a recognizable pattern with a very high success rate of completion. Your stop can go at the 76% retrace level, as waves that exceed this level usually retrace the entire previous first wave (which means it really wasn’t a first wave) or you can place your at the start of the first wave (less desirable).
It’s rare that you don’t get a second wave in a corrective pattern. You always get them in trend waves (impulsive waves); that’s one of the defining differences.
It’s more of a mind game than anything else. Traders have this fear of losing out on a trade, and often jump in early because of bias that the set-up is a correct one. However, in these markets particularly, with low volume and high volatility, it’s really important to be highly disciplined. Wait for the turn and honor your stops.
Have a pattern that you follow consistently, and wait for the turn. It’s better to miss a trade that’s risky than jump in early because you “believe” it’s about to turn soon. Waiting a little longer than usual and losing a percentage off the top is much less risky. The objective is to treat this like a business and only take on those projects that will prove to be profitable based upon a set of pre-defined objectives.
Trade what you see, not what you think.
There will always be another great set-up around the corner. It pays to be patient and wait for it.
____________________________
Registration for Commenting
Want to comment? You need to be logged in to comment. You can register here.
If you register, it protects your information. It also allows you to comment without filling in your information each time. Once you’re registered, simply go to the home page and click on the login link top right in order to log yourself in. Usually, you’ll be logged in for several days before needing to be logged in again.
______________________________
Problem receiving blog comment emails? Try whitelisting the address. More info.
______________________________
Get an upper hand … JC 2
Get an upper hand in trading …Seeing all the different currency pairs and the wave structures and hearing you explain why this has to do that on a nightly bases gives one a upper hand when trading. Elliott Wave applies to all stock and indices and can be applied to any candlestick chart. If someone ask what you want for Christmas – Tell them a membership to Peter’s “Traders Gold!”—JC |
The best of them JL 2
The best of them …Last couple of years, I subscribed to several ‘market traders’. You are by far the best of them and the personal contact is awesome. Daily and daily updates are very well written! Besides your expertise in EW, I also like your cycles analysis. Best investment I ever made! —JL |
the real deal SM 2
The real deal …‘Educational, insightful and thorough market analysis for all levels of traders. It’s Elliott Wave at its best….Peter Temple is the real deal’ —SM |
Tops in your field DZ 2
Tops in your field …You are tops in your field. Tried to follow Elliot Wave international for years. They were always behind the market. After discovering you, I perceive that you are an expert in reading the waves, which puts you way ahead of the rest of your peers. And you can read the Waves like you are reading tomorrow’s financial section. I pray you stay healthy. —DZ |
Couldn’t be happier … KK 2
Couldn’t be happier …The analysis and insight you provide is simply amazing! I’ve been trading the futures and equity markets for well over thirty years and usually average around 5% monthly. Since joining your Traders Gold Service two months ago, that number has better than doubled. I couldn’t be happier.—KK |
A true expert in Elliott Wave FL 2
A true expert in Elliott Wave …You are a true expert in EW analysis. What you provide is not available anywhere and is priceless. Subscription on your services is the best thing I have ever done. Many thanks for your effort to make me a better investor. I now have more trust in my investment decisions. I hope you will continue the excellent work! —FL |
Rise above the rest … SM 2
Rise above the rest …I have only ever met a few people who, in their chosen fields (astrology, medicine, music, martial arts, technical analysis), rise above all the rest and you are one of them…you have ‘the gift’…and that’s why I’m a Trader’s Gold member. —SM |
Have not had a losing week RW 2
Have not had a losing week …I have been with Peter almost a year. The only thing that matters is have I made money with his service. I think I have finally turned the corner using Peter’s EW. I have not had a losing week in the last 5 months. Thanks Peter, for your amazing amount of hard work. —RW |
The Market This Week
Here's the latest daily chart of ES (emini futures)
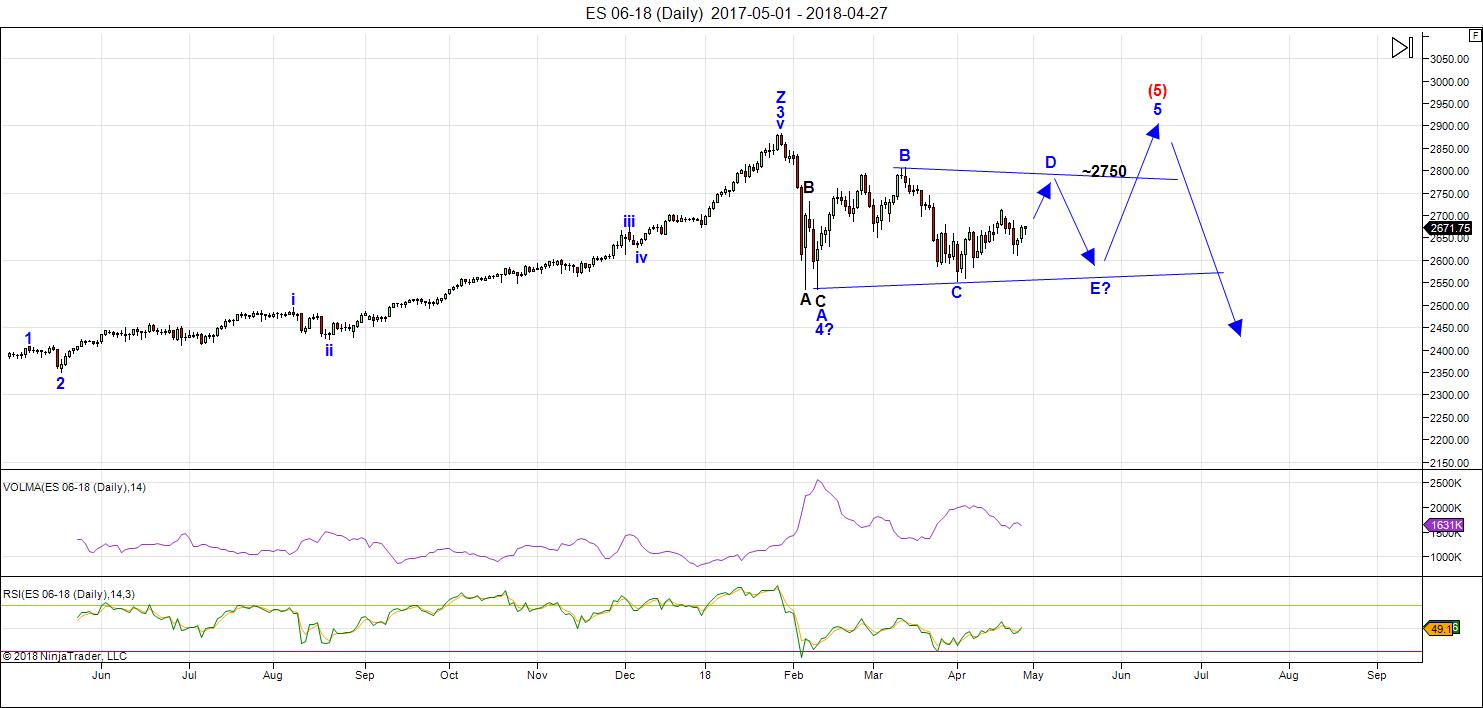
Above is the daily chart of ES (click to enlarge, as with any of my charts).
This past week was bearish and produced a larger B wave in the continued rally of the D leg of the contracting triangle — the final fourth wave of the trend.
The drop this week changed the target slightly — that and the fact that the length of time for this rally is changing the level at which we'll connect with the down-sloping, upper trendline. The target on the upside now looks to be in the 2750 area.
After the top of the D wave, we'll turn down into the E wave, a higher probability trade, as the completion of the D wave actually confirms the triangle. It's not until that point that we have the slopes of the upper and lower trendlines in place.
After the E wave down is complete, we'll take off again to the upside in a fifth wave, which will simply finish off the pattern. We'll get to a new high and probably more, but don't expect (as I've been saying for a very long time) a large fifth wave that travels any great distance. (I think 3000 is possible but at the high end of the probability spectrum)
Summary: We should continue up in the balance of the D leg this week. It looks like we'll have some weakness this weekend, but should turn up early in the week. Once D wave is complete, only the E leg (down) and a final fifth wave to a new high are left. That fifth wave up to a new high will be the end of the 500 year bull market.
___________________________
Trader's Gold Subscribers get a comprehensive view of the market, including hourly (and even smaller timeframes, when appropriate) on a daily basis. They also receive updates through the comments area. I provide only the daily timeframe for the free blog, as a "snapshot" of where the market currently trades and the next move on a weekly basis.
______________________________________
Sign up for: The Chart Show
Next Date: Wednesday, May 2 at 5:00 pm EST (US market time)

The Chart Show is a one hour webinar in which Peter Temple provides the Elliott Wave analysis in real time for the US market, gold, silver, oil, major USD currency pairs, and more. You won't find a more accurate or comprehensive market prediction anywhere for this price.
Get caught up on the market from an Elliott Wave perspective. You’ll also get Andy Pancholi cycle turn dates for the SP500 for the balance of the current month. There’ll be a Q&A session during and at the end of the webinar and the possibility (depending on time) of taking requests.
All registrants will receive the video playback of the webinar, so even if you miss it, you’ll be sent the full video replay within about an hour of its conclusion. For more information and to sign up, click here.


Thanks again for the weekly update.
Monday the LOW and Tuesday the HIGH, Wednesday/Thursday the 2th HIGH and then down into the weekend. Thats what I see(= what I Trade).
http://www.prognoseus500.nl/
Looking at my asto,we should see a sharp sell off with a new bottom om May 5 or 6.
$RUT
Daily chart looks like a finished contracting triangle as of today.
Triangle thrust to be expected to new all time highs .
this does not change my larger bearish bias yet what i see is a completed pattern.
If it turns out to be something else we will know soon.
Today’s lows are now key to this index
Definitely not a contracting triangle.
Joe is once again right on the money as we clearly had a sharp reversal with a long shadow at lower BB. We go up to at least tap 50 day underside or if triangle done, break upper boundary.
Peter-
Any possibility that the triangle is now complete and the top line was more “sloped”? I am referring to SPX/ ES
Nope.
Peter,
Do you still think we visit 2750 in next 2 weeks or is that target little lower.
On a different note what do you think of house prices in next 3 years do you think we see a downturn like 2007/2008. I am not sure how will that happen.
Bill,
The upside target hasn’t changed all that much. Difficult to pin it down at the moment until I’m sure we have a bottom in place.
Houses will drop to 20% or their current value over the next five years. It will be much worse than 2007/8 … much worse.
Monday the high and then the decline into the weekend?
http://www.prognoseus500.nl/
The Lowest LOW on 11th or 16th or 17th early inthe morning
Be carefull
Looks like we have an interim low and reversal Friday. So far three waves up, so either we get a new high after a wave four completes Monday or we are headed back down to new lows.
Not clear to me if E done, or a c of D up underway.
A new free blog post is live at: https://worldcyclesinstitute.com/the-astounding-mr-elliott/
This website is for educational purposes relating to Elliott Wave, natural cycles, and the Quantum Revolution (Great Awakening). I welcome questions or comments about any of these subjects. Due to a heavy schedule, I may not have the time to answer questions that relate to my area of expertise.
I reserve the right to remove any comment that is deemed negative, is unhelpful, or off-topic. Such comments may be removed.
Want to comment? You need to be logged in to comment. You can register here.