
My Frustration with Elliott Wave International (or “Don’t Try This at Home!”)
I’ll share this information with my subscribers, but make sure you don’t copy these charts as they’re proprietary (EWI).
Some of you know that I had a really frustrating experience (some of you have had a similar one) with Elliott Wave International. It’s what turned me to technical analysis and eventually to this site. I knew I could do way better than what EWI was doling out.
I have access to some elements of their site, in particular, the STU (which is a newsletter that comes out on Mondays, Wednesdays, and Fridays). However, I haven’t looked at it in at least a couple of months. I often joke that if my analysis is the same as theirs, I get worried about whether I’m correct. Usually, I like to be on the “other side” of the market from them … lol.
Well, this weekend, their charts are so wacky that I thought I’d share some of them and show you what NOT to do in labelling or analyzing charts. There are some good lessons here if you’re learning EW. The downside, of course, is that this terrible analysis, which breaks EW rules, poisons the perception of Elliott Wave analysis for the rest of us. Seeing this “crap” out there gives me a good understanding of why I get so much flak on my counts and predictions. So many people have been burned by these folks that I pay the price with a heaping dose of skepticism … a big sigh here.
You can click on any of the charts below to expand.
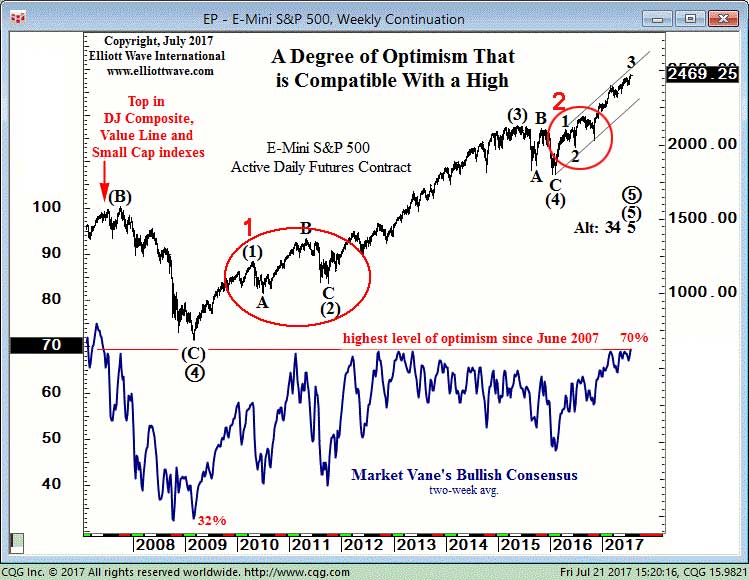
This is a daily chart of ES with perhaps the most ridiculous count I’ve ever seen! You cannot stick an ABC (in the red circle 1 , which is my addition) set of labels in the middle of a wave with the second wave (2) ending above the first wave. Where somebody learned to do this, I have no idea. Then in the second circle 2, you see a three wave count, but they’ve decided to skip over a large wave just above the wave 2 labelled on the chart. You have to account for ALL waves. You can’t pick and choose. Amazing!
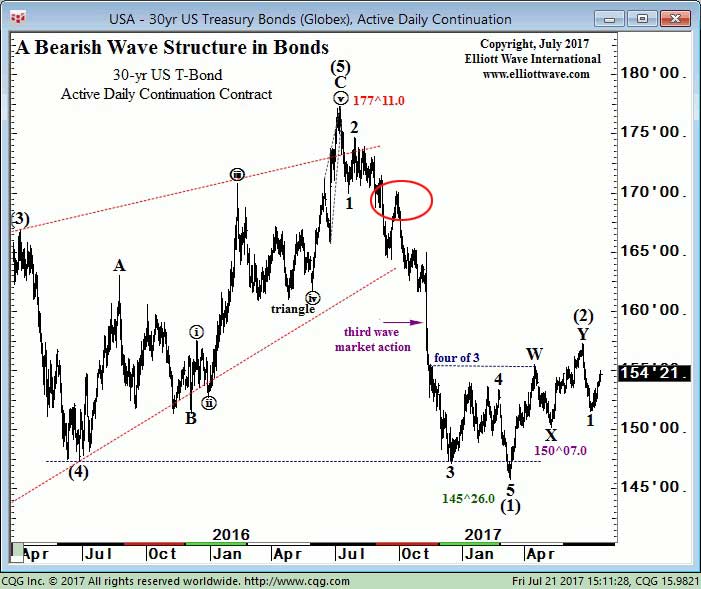
This is a daily chart of 30 year US bonds. It’s very much the same as the 20 year bonds that I analyze as part of the chart show every week. The red circle that I’ve drawn on top identifies a second wave of the third wave, which they’ve decided to ignore, which changes the count, of course.
This leaves their second wave (2) way too short, but it’s interesting as this count has changed from last week, which was also wrong for a completely different reason. The bottom line is that you have to account for all waves.
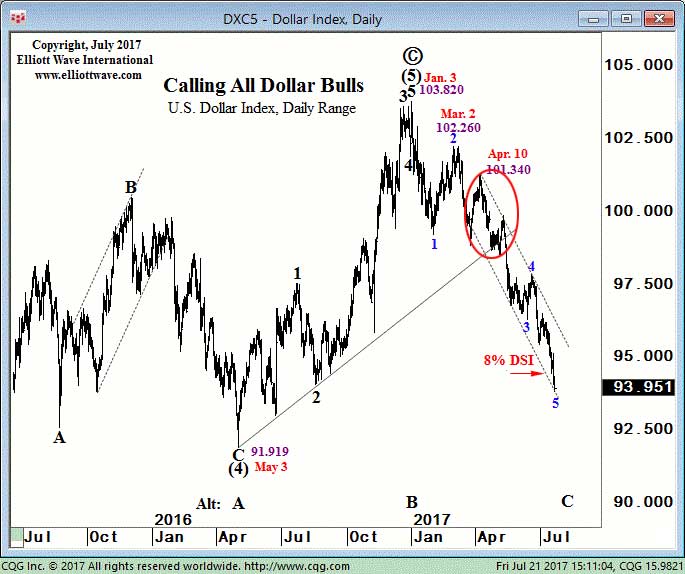
This is the daily chart of the US dollar. The message is the same here: You have to account for all waves. You can’t pick and choose what you want to include in your count.
This has made their prediction on the dollar wrong right from the turn at 104. or so. This count makes no sense—none—nada. They’re calling for a turn to the upside now to a new all time high and it just isn’t going to happen.
The message here is that there are lots of “pretenders” out there. It frustrates me to no end, but I don’t expect this to change anytime soon. This is the reason I don’t look at the charts of others very often. It’s a sure-fire way to destroy objectivity. It’s also why I try to explain my calls as much as possible (obviously, there’s time-factor involved in providing ALL my thinking, so there’s only so much I can explain in the sort timeframe of a video).
There’s a lot of bias in a lot of EW analysis you’re going to see all over the internet. The Elliott Wave Principle is science, as far as I’m concerned. It’s the analyst that’s the weak link. I try very hard to keep the bias out of my counts.
Remember, I’m a trader, so my counts have to be as correct as possible, or it hurts me just as much as it does you! Most analysts, in my experience, are not traders.


