
Triangles in the fourth wave position signal the end of the 5 wave sequence is near. They are continuation patterns and will continue the direction of the trend upon exit. These charts are intended to show a typical fourth wave pattern but also to show the elements a technical analyst looks for in determining whether the waves are in 3 or in 5. A triangle must have waves that are in 3’s (3-3-3-3-3).
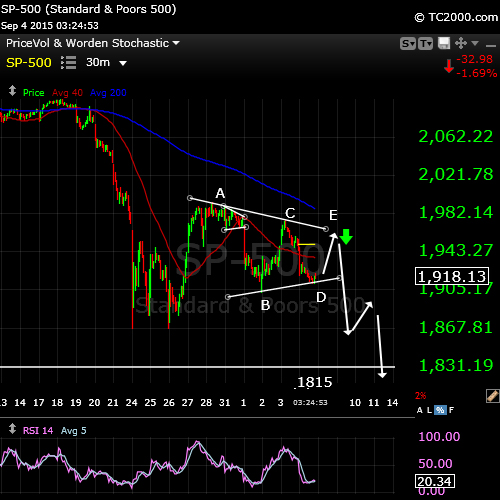
Here is a chart of the SP500 in September, 2015 showing the culmination of a textbook fourth wave triangle. We are are the start of the final wave up (wave E). At the top of wave E, the market will turn down into the fifth and final wave of the sequence.
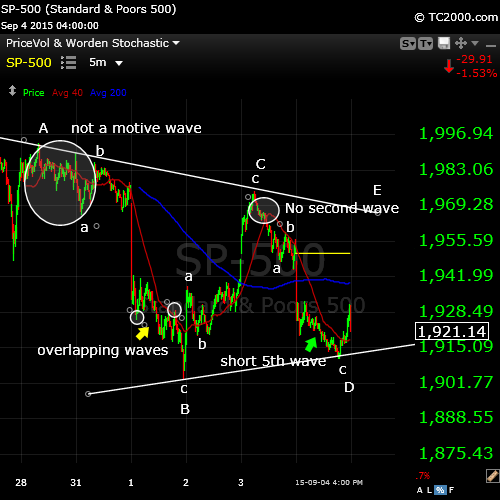
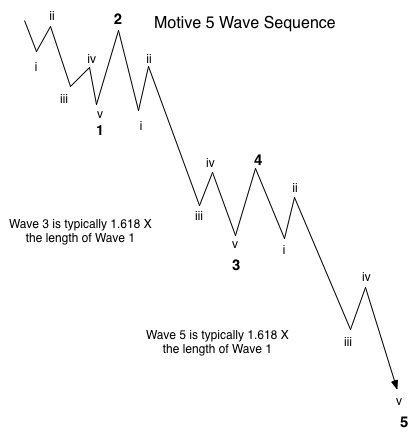 Above is a close up shot of the previous SP500 chart and a tremendous study on what to look for in waves to determine whether they’re motive (trend waves in 5) or corrective (3 wave moves). On the left is a diagram of what a motive wave must look like. As well as following all the Elliott rules, it must “look” correct and have the proper proportions.
Now, let’s look at the problems from the chart and why they don’t adhere to the requirements of a motive wave down.
Not a motive wave: In the chart there is a starting wave that is not in 5 waves. Elliott waves are fractal, so each wave must consist of five waves. In addition, this wave now looks “heavy” at the top compared to the bottom (it doesn’t have the right “look”—it takes a little while to get used to spotting these discrepancies, so if you don’t see it now, you’ll see it as you spend more time looking at wave patterns). Therefore this wave looks to be in an abc configuration (corrective).
Overlapping waves: a five wave sequence cannot have overlapping waves. The rule is that wave 4 cannot overlap into the area of wave 1. In the chart you can see that the circle on the left (the bottom of subwave i) clearly overlaps with the circle on the right (the top of subwave iv). This is a very strict Elliott Wave rule and cannot be broken.
No second wave: Second waves typically retrace 62% from the top of wave 1. This wave is missing a second wave in this position. The b wave is far too short and so this is an instant clue that this is a corrective wave. Without a valid second wave it consists of only 3 waves.
Short 5th wave: Wave 5 is typically 1.618 times the length of wave 1. On rare occasions, they can be .618 the length of wave 1 or the same length. However, this wave had a random length. This wave also did not move below the low of the previous wave down (wave B).Therefore, it is still in a triangle configuration. In addition, wave ii within this final wave is too short. So, there are some real problems with this final wave. It’s corrective.
Looking at this pattern as a whole, all the waves are in 3’s—barely— but they are, and this is what typically confounds the technical analysts who don’t spend the time to drill down to a 5 or even 1 minute waves chart levels. If you’re going to be consistently right in predicting market moves, you absolutely have to spend this kind of time and attention to detail to ferret out motive from corrective.


