
Here are the longer term Elliott Wave projections for Gold and Oil (as at January 13, 2018)
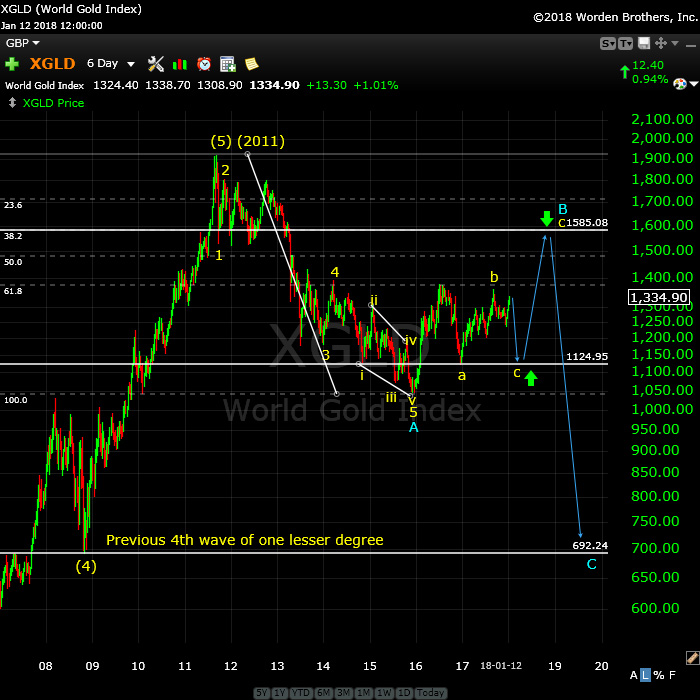
Above is the 6 day log chart for Gold. We’re showing a large (blue A) wave down to about 1050, ending with an ending diagonal. The wave up from there is clearly corrective and I expect it to retrace to the 1124 area.
Then we’ll rally in a (blue B) wave, which should top at around either the $1585 area (the 62% retrace level (horizontal line). Then we should head down to the previous 4th wave level approaching the $700.00 level. Based on the time it’s taken for the A wave to form, we may be looking at about 5 years at least for this entire move.
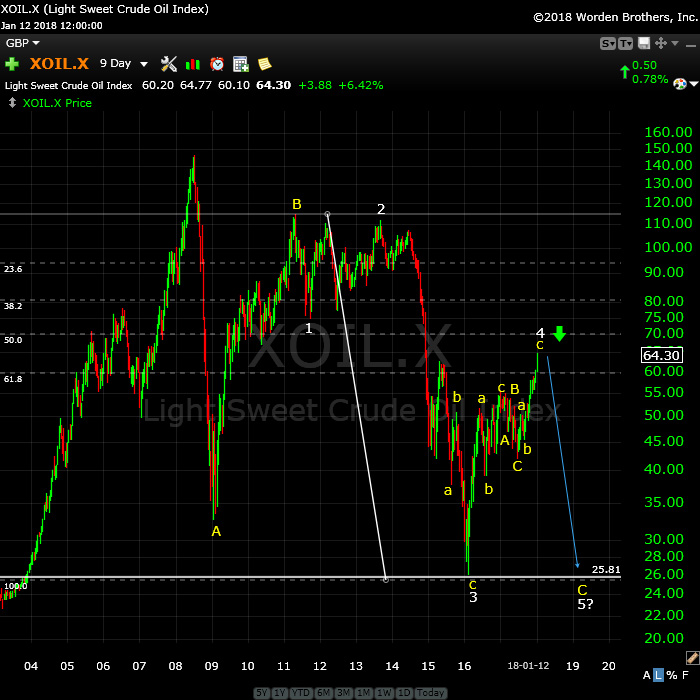
Above is the 9 day chart log chart for West Texas Intermediate oil. We’re in the midst of tracing out a very large fourth wave. We’re currently at the top of the fourth wave, ready to drop down in a C (or 5th) wave to perhaps a double bottom at about 26.00 (or slightly below this level).
The overall structure from the very top at about 150 is corrective. Very often the A wave will equal the length of the C wave and that’s what’s shown here. The fibonacci tool shows the length of the A wave transposed to the top of the yellow B wave. We already have a bottom here. As a corrective structure, the probability is that we’ll get a double bottom at about $25-26.
It took two years for the third wave to unfold. The bounce from the $26 area took another two years. It wouldn’t surprise me to see a two year period for the final wave to drop again to the $26 area.
A


