
As the World Turns
We’re at a full Elliott Wave count in the US indices, as we are in exchanges around the world. The next major move is to the downside. They may not all turn on the same day, but they should turn more or less together. Below is a selection of exchanges from countries around the world showing similar counts that suggest we’re extremely close to a major change in trend.
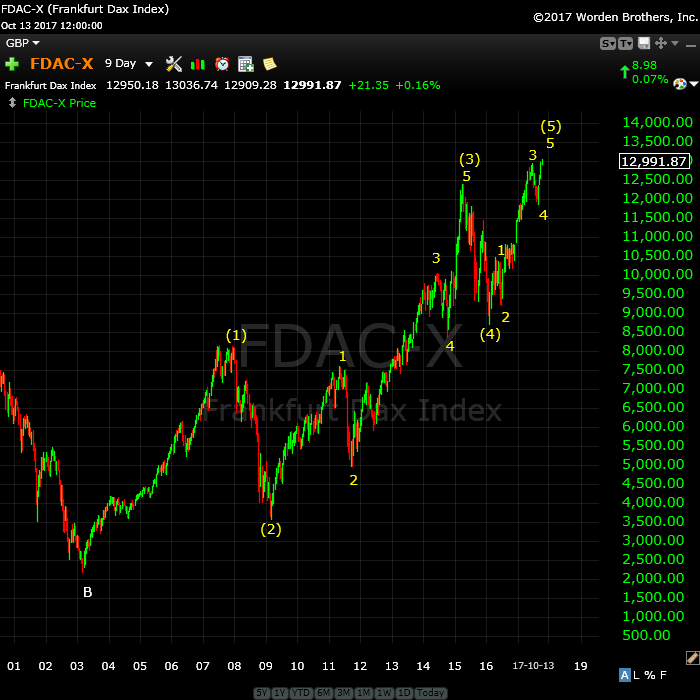
Above is the 9 day chart of the DAX (the Frankfurt exchange) showing the 5 wave pattern that’s near an end. Five waves up ends a trend. Look for a change of trend in the very near future. The first wave down will very likely bounce at the previous 4th wave (around 11,868) allowing for a short entry after a 62% retrace.
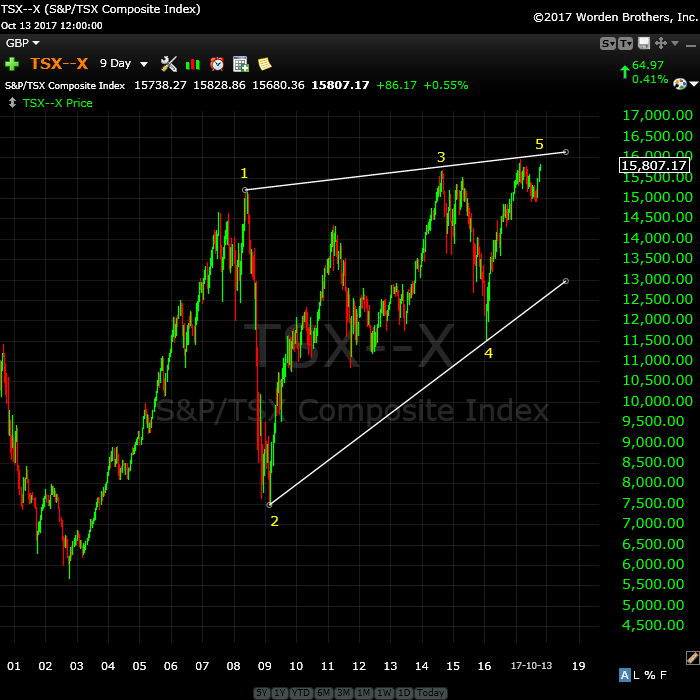
Above is the 9 day chart of the TSX (Toronto) showing an extraordinarily bearish ending diagonal. This exchanged is poised to implode shortly.
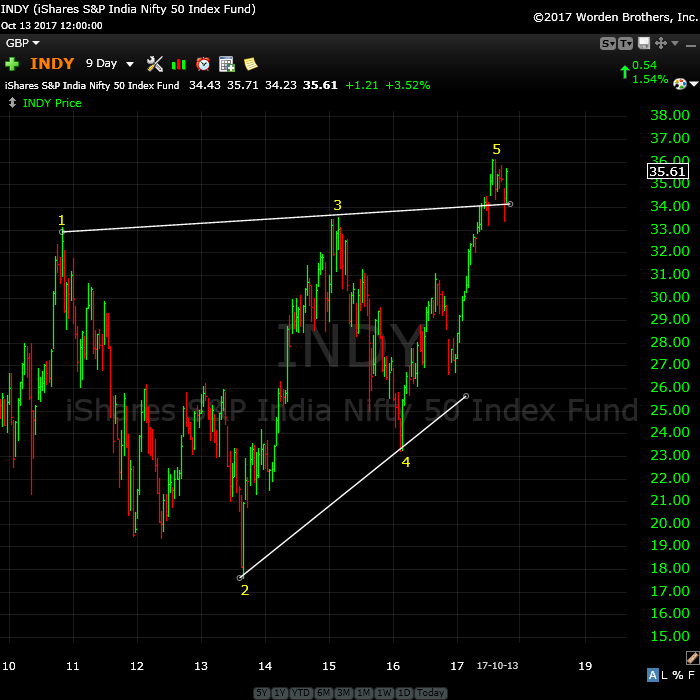
Above is the 9 day chart of the Nifty 50 (India) showing a similar pattern to the Toronto exchange. Ending diagonals are ending waves. This one is virtually complete with a “throw-over,” a very typical extension above the upper trendline. Ending diagonals also have dramatic turns in the opposite direction once complete.
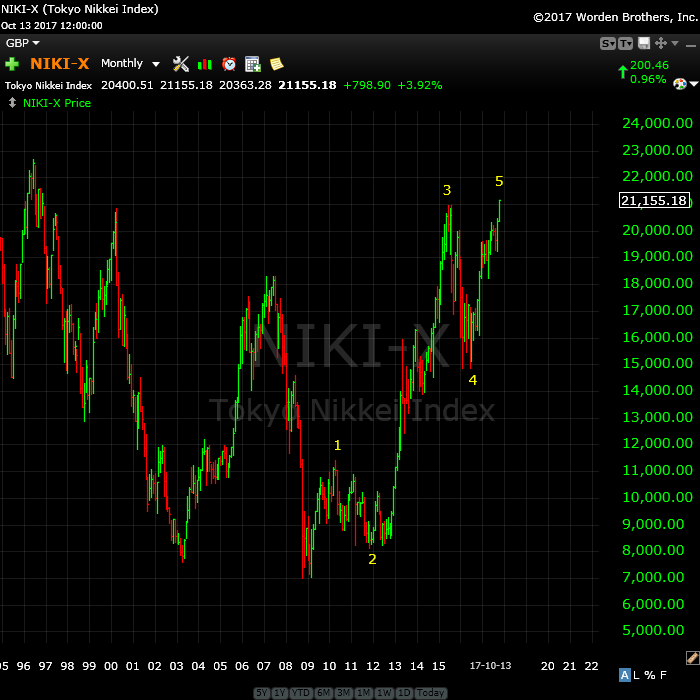
Above is the monthly chart of the Nikkei (Tokyo) showing a five wave pattern to the upside. Note that the fifth wave also has 5 subwaves within it. This exchange is also getting very close to a change in trend.
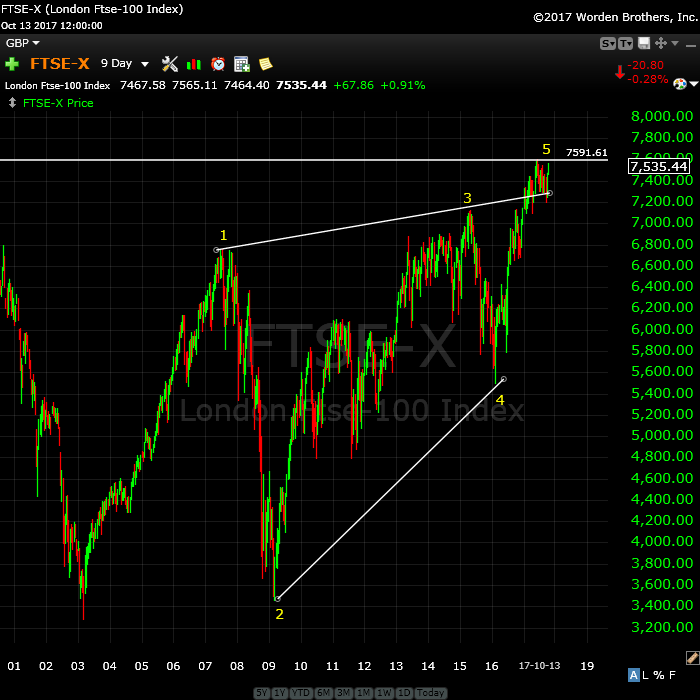
Above is the 9 day chart of the FTSE 100 (London exchange) with a similar ending diagonal pattern
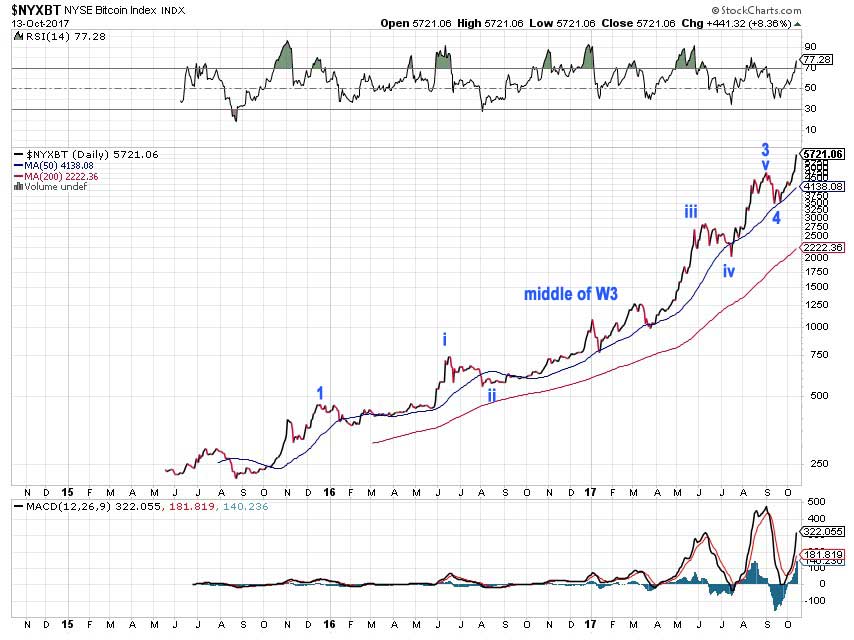
Above is the daily chart of Bitcoin showing the progress we’ve made in reaching for the sky in the past two and a half years. These are the kinds of speculative bubbles you get at the very top of a major international bubble. The euphoria at the tops of these 500 year cycles sends people into a greed frenzy, as they search for returns that have become elusive as the international indices near a top.
In analyzing this “rogue” asset, my “marker” (the pattern that gives me orientation within the larger pattern) is the two wave pattern in the middle of wave three. From there, it’s a relatively simply process to “fill in” the adjacent labelling.
Let’s look for a crash of the entire bitcoin world as the markets around the world begin to implode together. This asset is not quite done, but it’s in the fifth wave. We may see even more of a “blow-off” wave here as this final fifth wave reaches its apex.
Looking ahead, with all these indices coming down together, the momentum to the downside is going to be strong.
_______________________
A true expert in Elliott Wave FL 2
A true expert in Elliott Wave …You are a true expert in EW analysis. What you provide is not available anywhere and is priceless. Subscription on your services is the best thing I have ever done. Many thanks for your effort to make me a better investor. I now have more trust in my investment decisions. I hope you will continue the excellent work! —FL |
The best of them JL 2
The best of them …Last couple of years, I subscribed to several ‘market traders’. You are by far the best of them and the personal contact is awesome. Daily and daily updates are very well written! Besides your expertise in EW, I also like your cycles analysis. Best investment I ever made! —JL |
Have not had a losing week RW 2
Have not had a losing week …I have been with Peter almost a year. The only thing that matters is have I made money with his service. I think I have finally turned the corner using Peter’s EW. I have not had a losing week in the last 5 months. Thanks Peter, for your amazing amount of hard work. —RW |
Couldn’t be happier … KK 2
Couldn’t be happier …The analysis and insight you provide is simply amazing! I’ve been trading the futures and equity markets for well over thirty years and usually average around 5% monthly. Since joining your Traders Gold Service two months ago, that number has better than doubled. I couldn’t be happier.—KK |
Get an upper hand … JC 2
Get an upper hand in trading …Seeing all the different currency pairs and the wave structures and hearing you explain why this has to do that on a nightly bases gives one a upper hand when trading. Elliott Wave applies to all stock and indices and can be applied to any candlestick chart. If someone ask what you want for Christmas – Tell them a membership to Peter’s “Traders Gold!”—JC |
Tops in your field DZ 2
Tops in your field …You are tops in your field. Tried to follow Elliot Wave international for years. They were always behind the market. After discovering you, I perceive that you are an expert in reading the waves, which puts you way ahead of the rest of your peers. And you can read the Waves like you are reading tomorrow’s financial section. I pray you stay healthy. —DZ |
the real deal SM 2
The real deal …‘Educational, insightful and thorough market analysis for all levels of traders. It’s Elliott Wave at its best….Peter Temple is the real deal’ —SM |
Rise above the rest … SM 2
Rise above the rest …I have only ever met a few people who, in their chosen fields (astrology, medicine, music, martial arts, technical analysis), rise above all the rest and you are one of them…you have ‘the gift’…and that’s why I’m a Trader’s Gold member. —SM |
The Market This Week
Here's the latest daily chart of ES (emini futures)
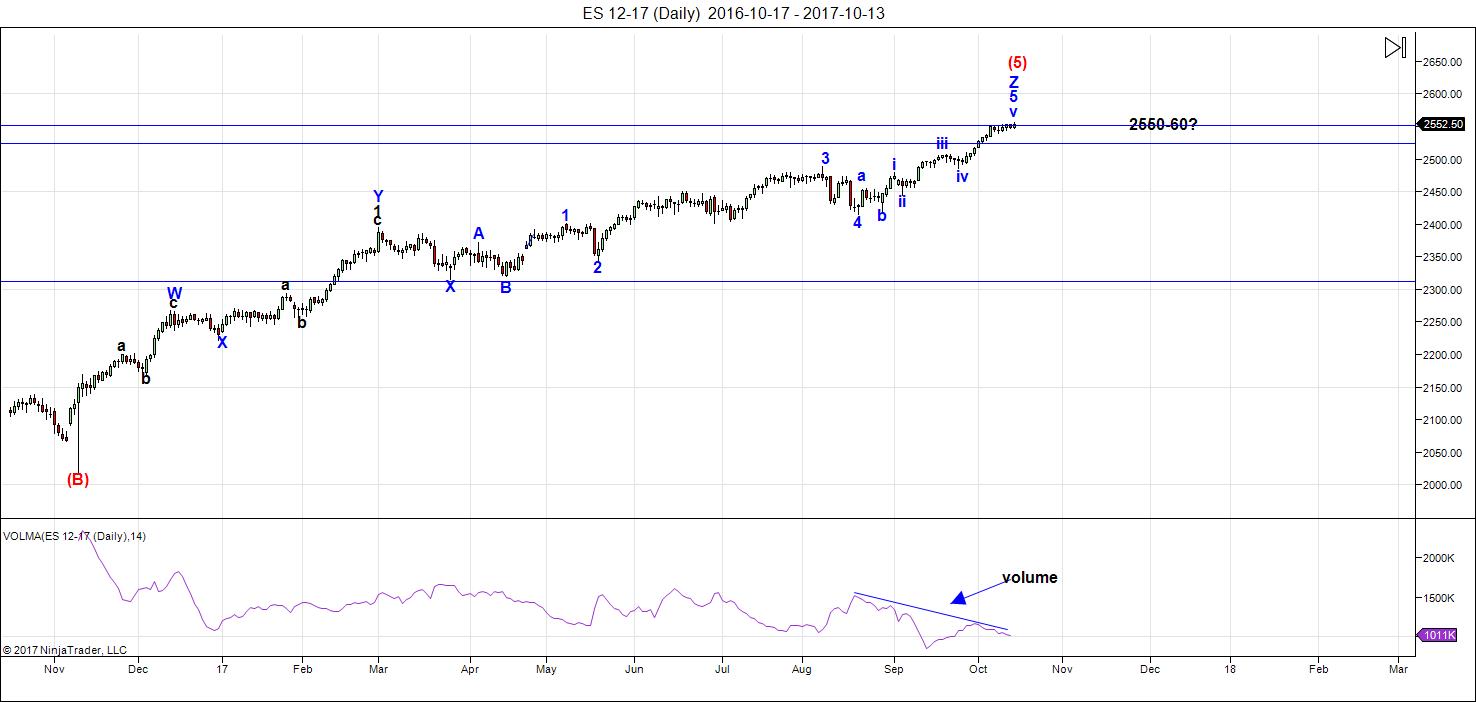
Above is the daily chart of ES (click to enlarge, as with any of my charts).
I have a full count on ES/SPX/NQ/NDX, etc. There are major turn dates this week and next. My preference is for a turn down early this coming week.
That doesn't necessarily mean we're going to drop on Monday, but the likelihood of an imminent drop is high. Turn dates don't provide direction, but they're strong indicators of a change in trend. I view them as secondary indicators to Elliott Wave analysis, which consists of an analysis of wave structure, wave count, and price level resistance (based upon fibonacci ratios). In this case, there is no more "up" available.
The wave structure on the 15 minute chart shows a setup for one more high, but it's the last wave in an ending diagonal and the maximum high (based upon the length of the third wave of the ending diagonal) is 2557. NQ is also at the top of a fifth wave of a larger ending diagonal with about 20 points of "play" to the upside.
With Elliott Wave, the confirmation of a change in trend is one wave down (in 5 motive waves, in this case) to a previous fourth wave level, followed by a 62% second wave retrace in three waves). A turn down there to a new low will confirm the change in trend.
Volume: Note that for some time now, volume has been expanding with selling, and drops considerably when the market heads back up. This is yet another signal of the larger, impending top. I've been predicting for quite some time here that it will drop off suddenly towards the top of the final fifth wave top. This it has indeed done.
Summary: The count is full. We're waiting for a turn down and a subsequent confirmation of a change in trend.
___________________________
Trader's Gold Subscribers get a comprehensive view of the market, including hourly (and even smaller timeframes, when appropriate) on a daily basis. They also receive updates through the comments area. I provide only the daily timeframe for the free blog, as a "snapshot" of where the market currently trades and the next move on a weekly basis.
______________________________________
Sign up for: The Chart Show
Wednesday, October 25 at 1:00 pm EST (US market time)

The Chart Show is a one hour webinar in which Peter Temple provides the Elliott Wave analysis in real time for the US market, gold, silver, oil, major USD currency pairs, and more. You won't find a more accurate or comprehensive market prediction anywhere for this price.
Get caught up on the market from an Elliott Wave perspective. You’ll also get Andy Pancholi cycle turn dates for the SP500 for the balance of the current month. There’ll be a Q&A session during and at the end of the webinar and the possibility (depending on time) of taking requests.
All registrants will receive the video playback of the webinar, so even if you miss it, you’ll be sent the full video replay within about an hour of its conclusion. For more information and to sign up, click here.


“gravity always wins in the end”?????????………. ahhh so sorry to bring you up to the 21st century but its called “BOTOX”….and “COLLAGEN” ……….. and yes, i will say it……its called “PLASTIC SURGERY”………!
how do you like DEM “apples”….
hey is anyone else out there having issues bringing up “google” or “youtube” or “yahoo”……. for example…… i am unsure if this issue is localized, or widespread….i am getting only a few select sites – peter, your site is one…..
No problem with those sites from my end.
I will be on the other side of that trade Peter for this week. Hopefully the following week ( 23rd) you have that same scenario with ew . I will finally be on the BIG BAD BEARISH side. All the best.
As I said in the post, there are multiple turn dates here. However, US indices are at a top.
Thanks Peter, the charts look exactly how you have been saying for quite some time now. Everything at the top.
Question, what are your thoughts on volatility in the up coming markets? Will it be violent at first and then calm down as the trend turns down?
Regards,
Charles
Volatility coming like you’ve never seen.
Thanks a lot Peter for posting INDY. I was about to ask regarding Indian markets during last chart show but then forgot. Anyways, you somehow touched it today.
I unsubscribed from all EWI services approx 2 years ago, when they were claiming that Indian stock market will sky rocket for long term and djia will drop below 2k.
I never bought this and this is one of the reasons for me not to continue with them anymore. It’s not possible that BSE will reach 50-70k and djia will be at 2k in this global fake economy. Same CBs are manipulating and running the entire show. All should collapse together.
God Bless All!
Agreed.
🙂
looks like we top out tomorrow
black circle shows tops
in each stair step rise
https://s1.postimg.org/3cjprp4yy7/SP500-_Market_Update-2-101317.png
As a matter for the public record,
i have meticulously counted the “unfilled” – “gap ups” – on the daily time frame for the spx since the feb. 2016 low – there is now 16 at last count.
Does anyone have a count for the daily time frame for the unfilled gap ups from the 2009 low, i am unable to see back that far on this platform…….
I hope you’ve named each one of them. I would expect nothing less.
ok – this must be said – you are “EVIL” peter – “EVIL ACCURATE”…. and you know me too well!
yes in fact i HAVE attached abbreviations beside each gap up – each named ignominiously after a central banker…… remember the likes of “jean claude trichet” [jct]??? …. gap up #2.
william martin [wm] is gap #1 and alan greenspan [blech] is gap #6…… and of course ‘anna nicole smith [anc] ” gap #7 – and while ANC had no real lineage as a central banker – does have a lineage of snorting cocaine, and marrying RICH……..
OMG … Anna Nicole Smith!!? How old are you? And William Martin ….? I’m having to look that one up!
Anna Nicole Smith – as was her previous “reincarnation” self in Marilyn Munroe and of course the reincarnation before that one in Cleopatra – …………..”is” and “was” TIMELESS…… and AGELESS…….
no age needed to be aware of this legacy……….
william martin – longest running chairman of the Federal Reserve no relation to the computer adjusted voicings of “RICKY MARTIN” –
Luri, I posted this on Twitter in March…haven’t done a real count since this post, but you can count from this chart 🙂
https://twitter.com/DWL618/status/837468179714682880
EWI has been so much focused on so called “gaps” and “sentiment index – bulls vs bears” which are almost useless and at least did not work since last 8 years. If you are bullish since last 9 years, then, you don’t need to look into any tech analysis or fundamentals.
thank you.
will no one rid me of this meddlesome “priest”……….!
right on support….grrr……
https://invst.ly/5guyi
https://invst.ly/5gv3r
BE VARNED!!!!!
What is VARNED? Is it Warned? THANKS!
You would have to know luri to know the answer to that. Otherwise, a long story.
🙂
Thanks! 🙂
All the perma bears are out in force. They have been wrong for 8 years now, but it could change. I simply do not see the hyperbolic type euphoria a 500 year top would indicate. I see a run of the mill melt up.
Perhaps the past 8 years has been the hyperbolic type euphoria of which you speak. Looking forward to Peter T’s Chart Show.
Gold in 1980 and 2011. Oil in 2008, .Com in 2000, housing in 2006 are examples of euphoria. Generally people rush into them thinking they will get rich quick w/o risk, ironic right. There is a basic thesis justifying the absurdity like peak oil and .com new era paradigm, etc. The last 8 years is setting the table for a 64 month parabolic blow off ending probably around 2026-7. We have nothing like that now, people I know are worried about the mkt. I last heard that the individual investor survey is only 1/3 bullish. What is the thesis?
And what, pray tell did the sentiment data and euphoria look like 500 years ago?… 🙂
We are starting to hear the same kind of fanciful numbers we began to hear around the 2000 top just before the Nasdaq 100 began a decline of 83.5%. Now let’s just say there will be a 500 year top coming up. Are you looking for a decline of 84% again… or 90%… or 95.? Well, guess what? Investors intelligence sentiment data show the 10 wk MA of Bulls divided by (Bulls + Bears) is currently around 8% higher now than it was at the March 2000 top in the Nasdaq 100. Assets in Rydex bear funds have NEVER been lower! Google Dow 50,000 and Dow 100,000 and see what happens. Based on reliable historic valuation data from Hussman, the odds very much favor no progress in the popular market averages over the next 10-12 years.
Peter G,
It has been quite awhile since I last saw Investors Intelligence numbers. If my memory is accurate that in that survey the Bullish percentage occasionally climbs into the mid 60’s and the Bearish percentage falls into the teens. I think the remaining respondents were neutral.
Is that even close today’s reading that you see? It seems the bulls would be maybe 65% and bears 15%. Bulls plus Bears would be approximately 80% to give you around 8%. Is that how you get to 8%?
I stopped following Investors Intelligence because it seemed that the Bullish number rarely climbed out of the mid 50’s. At least for the time I followed it I did not perceive anything useful.
I would be interested in your insight. I always appreciate your posts.
Peter G,
My late night/early morning math is highly inaccurate. Just reread your post. You said “8% higher than in 2000.” So what you are saying is Investors in that survey have never been more Bullish, is that even close to right? I should NEVER POST before early morning coffee! Wow!
I don’t think sentiment data will ever guide us to exact tops or bottoms, Ed, but they are useful nonetheless. Investors Intelligence data are the oldest, going back to Jan ’63 when they gathered data every 2 weeks. In 1969, it became a weekly process. One of the problems, of course, is that over the course of a half century, different people interpreted the sentiment data so there might be a discrepancy in interpretations for their 3 categories of Bulls, Bears, and Correction. The latest readings show 60.4% Bulls and 15.1% Bears, a spread they consider dangerous. Current 10 week MA of Bulls/(Bulls+Bears) is 74.3%. The equivalent readings on March 24, 2000 at the NDX top prior to an 84% decline were 54.1% Bulls, 29.4% Bears with the 10 Week MA at 65.6%. I reiterate that sentiment numbers are almost never consistent enough for market timing but they are quite useful for overall sentiment perception. Today’s readings certainly qualify as equal or more extreme than the 2000 or 2007 market tops. For comparison purposes, the early October 2007 readings were 62.0 Bulls, 19.6 Bears and 63.1 10 Wk MA. For those who don’t remember, the subsequent decline into March 2009 was the greatest Dow and S&P % decline in history except for 1929-32. Sorry, but I don’t have the exact readings from the year 1517, 500 years ago… 🙂
And why not? That’s the missing number (from 1517) that I could really use to put the capper on my Henry VIII/Trump reincarnation theory … sigh.
🙂
Good stuff on the II survey. You are correct about the 62% bullish reading in Oct 2007 prior to the big bear of 2008. However, in the bull market of 2002 to 2007, there were 9 readings above 60% and they were high during most of the bull. In fact, the highest reading was in 2004. So it took 5 years for the bullish 62% reading to be bearish, prior to that one would have to say they were bullish like positive momentum. This bull mkt started in Feb of 2016, so we are more similar to 2004, not 2007. The feb 2016 low was marked by readings of less than 30% bulls which sets up multi year bulls. 2008 and 2002 also saw such rare readings that preceed several year bull markets.
Well Peter, $MS, $GS & $NFLX all smash estimates and ES is flat if not down slightly.
You may be on to something here ole chap. If your correct your dance card will be full of interview engagements.
They will all be asking “Peter Peter when will the carnage stop?”
Then you just tell them “Sign up for my chart show”. lol.
Cheers,
Charles
watching 23004-23007 this morning on cash dow
still favor a high on the 19th though which is Thursday
and option expiry is Friday .
Dec 1st should be a more important high yet ………..
that is part of the what ifs .
What do you guys think about ‘stock market is going to double’ according to Martin Armstrong?
I think sounds crazy, but he has like never been wrong…
Cheers,
W
MA also said last year the market was going to crash. He sell subscriptions.
I have no idea how you came to that conclusion. He never said the market was going to crash. I have seen and followed Mr Armstrong since 2003. Is he 100% correct with his market analysis, of çourse not. Who Is? But I would certainly rank him in the top five market analysis in the world.
I meant 1993. Not 2003
…..so it seems he has the ‘BOND’ market bubble popping……..spiking interest rates…… and all those “$$’s” fleeing the bond market will flood into equities…..
where does one begin with this one dimensional “linear” logic……. a bubble by its very nature requires “ALL IN”….. and this “all in” is with maximum amount of leverage…….. who will be the “buyer” when everyone is selling?? how do you get your $$’s out AND extinguish your leverage, in order to “flow” those funds into equities… [i am speaking of the popping of the world wide bond bubble that has been created]
They have put up regulatory “gates” now on bond funds, and money market funds to “shut” them if there is a run on bonds………
“FIRE……FIRE…..”” everyone “ALL IN” is running for the exits at the same time. Who will buy for you to get your $$’s out – central banks? and what of the leverage? margin calls/derivatives…….. this must be satisfied first before you can claim your “profits”………………. and when leverage goes unpaid – $$’s disappear……….and what of the spiking rates on derivative contracts, and of course on the “interest” expense line item of the sp 500 companies – which are now at all time highs in terms of nominal debt amounts……… hmm…..
for me, if one bubble pops, the all pop at the same time!………………what say you?
Hmmm … logic .. a new concept, perhaps.
🙂
The credit cycle has been growing exponentially for decades. In other words, all that money the FED created to bail out the banks ends up going into stocks and primarily Real Estate. So doubling is wrong, it is way to conservative.
There was a man named Armstrong
Who told everyone he was never wrong
No matterhow many times
He did not make any dimes
He is such a guru he wears a sarong
Believe me, he has been wrong.
Apologies to Mr, Nantucket.
I think everyone who has read martin Armstrong work are all
now trading the same play book . he may be correct yet with out
understanding his entire model i have to stick to my own work .
im more interested in nat gas and wheat then the stock market at this moment.
yet ill attempt a short on the dow futures if i see the cash dow get into the 23004-23007 range . on nat gas the mentality is sell the 3.00 area so
unless it can get through 3.17 id say im pre mature on my entry even it the trade
between ung and weat is up slightly since my purchase .
first freeze in new york hit this morning . nothing to get excited about
come on – ……”REALLY!”……… could this be any more …..ummm….. “engineered”?
https://invst.ly/5h82l
Good Call Peter T
Within .75 pts
Luri
If the bond markets bursts lets say and those who have money in money market
know they can loose money then there is only two choices.
sell everything and take your money out of that account or stuff everything into stocks . either case its all over .
once everyone is long there is no more buyers left .
was with in 2 points of cash dow yet no short since target was not hit .
another thing on martin Armstrong, he also stated that the 23500 area
was the main resistance on the dow . a break above there is needed to signal the blow off . quick math . the 11750.28 year 2000 top *2 = 23500.56
we have not even tested that level let alone broken through it .
not saying he is wrong or right just saying that was the level he mentioned
that signaled the blow off .
im sticking to next year being decidedly down . and sticking to my timing
into December . Today was to be a short term trade yet maybe i wont get filled.
sticking with 23004-23007 as my entry area on the cash dow.
leaves no room for a stop since that is the max as i see it for now .
joe,
so let us imagine if you will that the “bond bubble pops”……….. there are “regulations” on the books that “require” money market/bond funds to close the door on “redemptions” – for as long as required, before they release funds to you, potentially bankrupting the funds………. you are holding paper, that is worthless, because it is unable to be redeemed……….You are without a legal choice in this case.
They shut the gates on you, and your “funds” are frozen – even though you are looking for ‘redemption’.
so what of this? how do you “sell everything” and “get out” as you put it?? how?
linear logic it seems – so that, If selling is smooth today – it will be smooth selling tomorrow, and also during the dynamics of a popping bubble and i will have access to my funds at will……………… i posit, that during market stress – smooth and uninterrupted redemptions will almost never be the case….
Luri, here is the dirty little secret that no one is telling you and makes all this moot. Money market funds are all going to “break the buck”.
Oh, I know that a lot of folk who think their shares cannot go below a dollar don’t know that but that does not change the fact. The SEC a few years ago quietly changed the rules about what MMF were permitted to invest in and a lot of them are holding soon-to-be worthless assets as a result of imprudent yield chasing. This thing is going to get very ugly, and there WILL be a revolt when the herd figures out what the banksters have ONCE AGAIN, done to them.
1 minute cash dow chart a failed potential bullish triangle .
its a 1 minute chart so i cant get to excited yet if the dow cant break back
through 22990-22995 id say its over .
going to be difficult to be patient into December yet short term wave count
looks corrective to me .
Dec 19 to nov 7 i have as a high to low cycle.
i guess that will be my decision point as to this market.
im off the blog for rest of the day .
winter is coming !
Some volatility in market today.
Luri
you have been Varned !!!!
Verne nailed it . all hell will break loose
if your ” cash ” is frozen .
…..so perhaps that is “the plan”…… divide and conquer – civil war…………. that would be a great opportunity to tear up the remaining rest of the constitution.
“BE WARNED!.”…
:-)))))) now everyone – all at once……….
again “I SAY”…….”reallllly”……….. engineered by a criminal organization…..
https://invst.ly/5hbu9
hmmm…… ok we have new marginal highs in the ES, and do we need an overthrow?
https://invst.ly/5hcnk
ES actually ES went to exactly 2557.75 and got rejected.
Noticed. So did NQ and SPX – to their targets.
I saw that on NQ. On the button. amazing.
If we can just get on with a little trend change instead of dancing with these doji’s
Thanks for all the work Peter. Much appreciated.
🙂
Red sky at night … we’ll see. Ominous.
methinks we have a squiggle iv and squiggle v in an overthrow to be done on the ES……?
thoughts anyone? https://invst.ly/5he34
scratch out 1 of my es’s please. lol
Hi Joe,
With your Mars-Uranus plot, did you calculate the raw numbers yourself to generate the plot or have you used a rough approximation of Crawford’s work? https://www.scribd.com/document/152299534/Crawford-A-Mars-Uranus-Cycle-in-US-Stock-Prices
The ASX 200 has just closed up for the ninth session in a row. I went short one of our major banks today as there is enough technical evidence to suggest a pullback is imminent – and this ties in nicely with the Mars-Uranus cycle which I only have started learning about, hat tip to you Sir.
Taz
I wonder if Mahendra Sharma will admit defeat and an erroneous signal of his astro models this week or wait till next week to confirm. Hopefully his avid followers have a suitable stop loss strategy.
morning update of the ES…….. it seems we did do a squiggle “iv” and “v”….with an overthrow…… let us see what happens
https://invst.ly/5hmea
The ending diagonal in ES just keeps widening the trendlines and morphing into extensions. As a result, the tops and bottoms of the 3rd and 4th waves keep moving along the pattern, so it’s impossible to analyze at the moment. It simply won’t correct. All other assets seem to be moving in their normal ways, but the US indices are clearly on their own.
…..”just because”…….. i am a total glutton for “punishment” and “ridicule” at the early morning hours…….
so fire away peoples…….!
https://invst.ly/5hnyn
update …… hmmmmm… is this my “academy award” winning moment?
“cough”……i would like to thank the academy for giving me this incredible ego boost……
https://invst.ly/5hpum
Damn Luri, could I have your number? Just to be sure, if Peter lets this through, absolutely in jest.
2575 could be next before wave iv happens.
Chart did not come out ,but look it up. Fits peter’s model
Rajacar @TimeandCycles 21h21 hours ago
A close up shows the daily has a bearish rising wedge, with an 10/23 Apex CIT (Change in Trend)
1 reply 0 retweets 5 likes
Rajacar @TimeandCycles 19h19 hours ago
Make that an 10/20-23 Apex CIT
I think this guy is good but hard to understand.
I am certainly not going to venture calling top in this market but I did have a target of at least 2560 for SPX.
DJT had a key reversal day, and DJI has tagged its upper B band today. Calling a top has been futile as bearish signals for some time now are repeatedly being negated by cash dumps. Money flows show this clearly.
We are witnessing in my opinion, the absolute limits of bankster hubris, who have convinced themselves, and others, that they are masters of the financial universe. We shall see…
agreed verne – ………”agreed”………
hubris is meant for the spring!!
methinks the market is “waiting” for the RUT to make a new high. It has failed so to do.
wave 5’s should be “weak” – which is what we are seeing – yes, i know friday is OPEX.
BE WARNED! https://invst.ly/5htgm
there is now no doubt that this market is being run as a “criminal organization”, sanctioned by the global governance of shadows and lies.
“ok”…… i got it out of my system……. tomorrow is a 111 day 10/19/2017 [1+0 = 1// 1+9=10=1+0=1 // 2+0+1+7=10=1+0=1] or 111…… Liz “heads up”!
The ending diagonals keep morphing into bigger ones. They create more points along the trendlines and so it extends the 3rd and 4th waves (and the 5th, as a result). It’s ridiculous – never seen it do it to this extend.. So there’s much more to come on the upside. It goes back to my video on everything moving together. Once the US Dollar bottoms, everything will turn.
Don’t pick tops. We have a ways to go.
We definitely do, Peter.
As mentioned earlier on the blog, looking for next week to get aggressively short. Monday on my model, says the final high before heading down in some kind of a correction. Can we see 2570ish ? Joe has oct 19th, which is a very pivotal day on my model, but yet Monday is either a double top or higher high. If we get a higher high Thursday oct 19th, I will buy one or two batches. The third batch Monday. If we do indeed see a correction from oct 24th, I can see this correction running till nov 7th (Gann date ). Which is also Joe date for a low. I personally see only a 5- 8 % correction. For all you bears sake, I hope I am wrong. If the market does correct more than the 8% I will take the ride down. All the best every one.
very close to what may be the key astro day– early a.m 10-26 Sun at its most debilitated reaches Jupiter. That should be a market moving conjunction. Same day! Saturn shifts signs which is also huge. Previous day 10-25, Moon at maximum South declination, big sentiment shift. BE WARNED!
Good to know. Either way, I will cut my shorts loose very quickly if the market takes off to the up side by the 25th. As Peter said , do not top pick. Very good advice for newbies. Thanks for the astrol update whitemare.
Andre’,, have you investigated on Daniels code? I am seriously looking at throwing some money and time in learning the code.
Peter
New computer now online and using different ISP.
somehow I’m expecting the waiting on moderator message
yet checking to see.
I’ll be converting data as well as re setting up newer software ect…
and hoping to be able to create larger stock groups to help analyze
this market in more depth .
A high was Due today with a low due Nov 7th , the depth of this future decline is open for debate .
I’m Swamped with converting everything at the moment so no comment
and price targeting .
Joe,
No, it’s definitely not you. I’m going to attempt to move my site this month and I’ll re-install everything, cause there’s really no reason I can see for this going on, except maybe a conflict with my security software.
Peter
i have posted from my phone , my laptop and my new computer
so ill go with yahoo email address . ( yahoo may be the conflict )
Typo earlier, Oct 19 is tomorrow ( i was a day ahead in my mind ) .
I would like to thank the “ACADEMY” and of course my life long companion – GRAVITY, for this amazing recognition…..
cough……… wahooooooooo
https://invst.ly/5i27i
Yes Luri, I like ‘Gravity’ ……..relevant…….because its a natural phenomenon! just like this pullback. BUT how low will it go? will it be like ‘shelling peas’ or ‘eating Gelati on a very hot day…….messy!!!!’
wayne,
what about ….”eating Gelato” …..”hot day”…….”while shelling peas”…… you get a little of EVERYTHING….
I would never pretend to “know” the end – i can only gauge what has occurred at the beginning…….and a drop to the base of the ED [dark red horizontal line on chart above] is the first port of call…….. will it be a stealth feedback loop creating a “cascading” type drop all predicated upon short covering of the historic short positions of the VIX?? will it be a BTFD moment????? …….. hmmmm…… we will know all “that is and will be”…. shortly enough…….
p.s……….. can anyone tell me the “last” time we had a “bloody” type OPEX? it has seemingly been “preprogrammed” for the “up”…. since forever……..
oh yes, and a question – has anyone noted the “shift” that has occurred in the comment sections of the “financial” sites that we all visit? In general, after 09 lows, the bears knew when the rally was “ending” and the return to “crash” was beginning [the market’s price advances seemingly has silenced all bearish predictors and prognosticators]………..NOW , years and years later…………. the bulls [or bears wearing bull hats] have been emboldened to comment on “EXACTLY” the moment the price “advance” is ending, ……….when the small BTFD “pull back ” will start…….. and the moment when the ADVANCE in prices will begin once again………………………….. i have seen, read and become aware that this shift in commenting expertise is found in this forum as well………. this phenomena………it is worth noting – FOR THE PUBLIC RECORD of course…. :-))
I get the hint. Over and out.
dave ……. “D-A-V-E”……. i was truly and honestly making a very generic observation about the subtle shift in overall “sentiment” – using anecdotal type “observations”……… Truly. I WAS!!!!
There is NEVER a hint i would need to make “specifically” to you Dave. I understand to “little” of this world and universe to ever be ……..”specific”……….. unless you count the time when i told Liz “she had been drinking of the “KOOL AID” and inferred that she might need to ease up on the cocaine use…….. for my defense – this was said in “JEST” – ladies and gentlemen of the jury…… JEST…….!
WSJ reports that investors withdrew more money this year ftom the stock market than they invested. One could legitimately ask how then could the market have continued to relentlessly notch new all time highs. I sometimes get derided for my only partly tongue in cheek refetence to banksters but their participation, directly or indirectly must be factored in in my view to correctly undetstand price action. Harry Dent was right about baby boomers retiring and withdrawing money from the market. He woefully underestimated CB intervention and was therefore wrong on his market calls. Whether it is via the direct purchase of equities as has been the case with the SNB and BOJ, or indirectly through the financing of corporate stock buybacks, the rally has been largely bankster driven, pure and simple. Sovereign wealth funds have also contributed and people would be quite naive to think that the FED has not directly provided, unofficially of course, liquidity to US markets. This is unsustainable. How do I know this? If you take a close look at DJi for example and the tear that it has been on lately, you will discover that its advance has been focused in fewer and fewer specific stocks. Yesterday’s pop was primarily due to the ridiculous ramp in IBM. The gap up open and ramp took price above DJI’s top boundary of the huge bearish rising wedge- a classic termination move. If Wednesday’s gap is closed today it would be an exhaustion gap. These are in my view acts of desperation, and a futile attempt to maintain the appearance of a healthy market. I believe this move up is terminal. I was just about ready to concede defeat when price moved past my long term target of SPX 2560…perhaps not so fast…! 🙂
verne,
…..thus is the very nature of “ALL IN”…….. the central banks have “bubbled” in ONE direction the “ALL IN” in bond/equity/real estate financial markets……… $500 trillion dollars world wide of “one way’ bets………………. how did they do it? it was a psy ops……. they convinced participants to be “confident”…………. It is our herding “nature” to start to get ANXIOUS at “ALL IN” phenomena………… why? i am unsure…….
Central banks are not big enough to stop a sudden “flow of funds” of $500 trillion OUT of the “ALL IN” trade. Central Banks are helpless to counter such a move. Suddenly, the dam bursts on the “CONFIDENT” psy ops…..and with it, the exposing of the Central Banks roll in creating the “psy ops”…….or as Mario Draghi says – “whatever it takes”………….
keep the faith verne……. the herd can smell that the lions need to feed, and are “on the hunt”………………. “ALL IN” will collapse upon itself – BIGLY and FASTLY!!
oh yeah verne,
forgot to mention – the “psy ops” can only “work” under a “low volume” regime. rigging the equity markets can ONLY work with LOW VOLUME…..and that is EXACTLY what is occurring……………… “ALL IN” trade will evoke the “opposite” reaction – HUGE volume as the herd’s nervousness goes full on STAMPEDE mode – once again, just because herd’s get very nervous with ALL IN………!
Luri,
BTW today 10/19/2017 is a 1-1-1 day. 😛
oh yeah!!!!!! hey liz – coincidence?? 10/1 – Las Vegas ritual sacrifice, and Catalonia election where bloodletting of old grannies going to vote was sanctioned……
……and now this….. hmmm……!
NOT A FAN OF HARRY DENT’S…HOWEVER, DENT’S PUBLIC ARTICLE REFERENCES ANDY PANCHOLI’S CYCLE WORK AND EXPECTATIONS
“Beware… We Face The Greatest Turning Point In October” – Harry Dent | July 14, 2017
http://tinyurl.com/y84n73fj
“Andrew Pancholi…weekly models point specifically to around October 20…Andy also sees possible turning points…in late January 2018”
Tks Rotrot.
I have to say I now agree with Prechter’s view on cycle turn dates. They are far too erratic to effectively use in making trading decisions.
Saturday, February 3, 2018…mark the date on your calendar…that’s when Yellen’s term expires…will the market will find a tradable bottom the end of January 2018/beginning of February 2018?
http://tinyurl.com/hjm5ufv
“Where Have All The BUY Programs Gone?” – Seven Sentinels | October 19, 2017
http://sevensentinels.com/issue/2017/article/october-19-special-report
Rotrot, again very good info. Thanks.
October 20, 2017
https://twitter.com/TimeandCycles/status/921383268028702721
October 20, 2017
https://twitter.com/spakkal/status/920326991257227264
Well how bout that?
9.8 meters per second squared does apply to the market.
Boy does that familiar acceleration standard bring back some fond memories.
Just think about it – I was still using a slide rule back in those days! 🙂
its sorta – “kinda” ………lookin like a “B”ear flag???
what say you? https://invst.ly/5i9sm
1-2?….i-ii? https://invst.ly/5iavl
Now Luri, what have you done to me? I promised I was not going to drink any kool-aid today and as a consequence, I missed the momo run in ADBE.
LIZ……. “L-I-Z”……. i hear you can get……. [cough]…….. STD’s …. from “momo’s”??……now are you REALLY sure – are you sure – you want to “run” with them…… i am concerned for your general health as well as the development of your “higher consciousness”……
think about it liz.- think………….. STD’s……. ah huh……….
Luri, this my momo-mode thinking.
BIDU 10/16 move, 9 am 1-hr bar open 264, end of day close 273 high. Can ADBE do the same thing?
9 am 1-hr bar open 164 so target 173?
Liz,
having spent all of 30 seconds on this absolutely ridiculous chart – yes, that target is achievable – nasty momo’s!
prices are well outside the 2 standard deviation trading range on the “daily”, “weekly” AND “monthly” time frames – epic!….. the reversion back to mean – when it happens – will be a great shorting opportunity too.
https://invst.ly/5ic5s
Thanks Luri. Didn’t get 173, only 172. It was only an intra-day trade. Can’t be caught holding the bag.
Possible small dip to test today’s lows tomorrow. Back up Monday to previous recent highs. I will throw in the shorts Monday for possible correction next week. Just went short for Friday. Luri. I forgot to put lol at the end of my comment.. no problem.
2558 es
Just one small batch for Friday as I am always concerned for option expiry.
its like throwing spaghetti against the wall to see what sticks…….
is this the pattern we are seeing unfold? https://invst.ly/5idyf
I think you are getting closer Mr spaghetti . Lol
Zero hedge put out an article today titled, buy the black Monday echo dip. China bubble warning. Buy the the dip and let it rip. This is why, I turn off the tv (cnbc) and not read zero hedge. I usually use them as contrarian indicators. The only reason I read this article, is that some one sent me the article.
This is classic contrarian move on zero hedges part to screw the novice traders. If I was a novice trader, I would want to wait for Monday black Mondays so called echo dip to go long. I would wait and wait for the sizable dip. But yet the market keeps climbing . I get scared and I buy at the high end of the rise for the day fully expecting the market to rip higher for the rest of the week. I maybe wrong, but I fully expect the markets to be in a correction . Again the novice trader gets taken out to the wood shed. Classic ! I have seen this move countless times. How do I know ? Because I have lost 10 of thousands of dollars when I use to be a novice trader. All the best every one.
Dave,
Can you clarify what you wrote? You said you “fully expect the markets to be in a correction,” but still you expect ATH this coming Tuesday. We can’t be in a 3rd wave and a 4th wave at the same time. I just read ZH’s article. I think he is referring to today as an echo of the 10/19/1987 crash. So yes buying the “bargain” dip was correct today if you follow the momentum stocks like NFLX and NVDA. He isn’t referring to this coming Monday. At least that’s how I understood it. I just scanned quickly down the article though.
I’m still short QQQ. VXN (NDX Volatility Index) is still holding 10/5 low and looks to be in an uptrend. If it repeats 10/25/16 to 11/4/16 fractal then that’s perfect for my short. So I’ll keep the short in my short-term trading account. Worst case scenario, I consider it as a hedge to my long-term accounts.
I apologize Liz. It was a tweet I received . I just saw the head lines in the tweet and jumped all over it. You are correct as usual. Either way, any new investors buying today will get burned later next week. Yes LizH, fully expect to see new highs by the oct 24th. Possible highs 2568. – 2577 range. Very prudent to have a insurance hedge Liz. With your shorts.
I don’t have a range for /ES. My target is just 2571.xx.
Beyond that, I have no idea. Now it hits 2571.75.
Please Note, I scaled my model on the wrong date. The high should be oct 24th. Not this Monday but Tuesday 24th for the high before the correction. Whitemare astrol aspects seem to line up nicely. All the Best every one.
We need to see 5 waves down followed by 3 waves up
before concluding a top has been made .
That said my model points lower into Nov 7th .
Options expiry is here .
https://www.youtube.com/watch?v=O4h8sEKDGtQ
Retrot
it is obvious that harry dent is not a market timer
as for Andy pancholi i have no comment what so ever.
my post from Feb 11th 2017 , Link -https://worldcyclesinstitute.com/todays-predictable-problems-a-cycle-top/
I see no reason to amend this yet i have pointed out to dec 1st as well as dec 13th and into Jan 2nd for other reasons .
all that said this upcoming decline if it comes begining pretty much now and runs into nov 7th will be important for me and ill admit i have a couple issues
with the nov 7th date yet im keeping my thoughts as is until proven wrong .
My post feb 11 2017.
Joe February 11, 2017, 2:31 pm
The late George Lindsay was the most consistent Market timer
in our life times .
To deny his work i feel is a mistake .
Here is why i am focused on Oct 2017 For the top
this is in addition to my other posts .
The late Jerry favors used to say that the nya was the
best index for market timing how ever he used the Dow
for patterns because everyone follows the Dow all over
the world .
Jerry Favors was the most influential and educational
person in my life in terms of understanding the stock market cycles,
timing as well as indicators .
If we see a decline ( Big IF ) ill add more to my bullish positions .
The Lindsay diagram Posted Below
http://imgur.com/MU0Tslz
Monthly $Nya showing the timing Below
http://imgur.com/k02KvS5
WTF DAVE!!!! huh……… what do you have to say about this??? https://invst.ly/5io3g
YOU ARE SOOOOOO GROUNDED RIGHT NOW YOUNG MAN!!!
Looking better Luri !!! Hòw about showing a chart with 2615 as on it. How about sacrificing your self to the stake as a contrarion indicator. I am going to keep my longs from earlier this week. I still have a very small short as a hedge which I will let go of some time today. The trend is your friend. Everything I am looking at says next Tuesday is some kind of a TEMP TOP.
why would anyone expect a black market dip or panic on monday
when this market has been doing the opposite ??
joe……is it to be a …..”contrarian”………..?
Because there’s absolutely no volume.
Options expiry
drive stocks higher and force any short calls to go into the money
and force delivery of those stocks onto someone else .
once expiry over say in the first half hour look to go short yet
some options settle on Saturday so its a day trade
its end of quarter plus 20 days .
the 160 million dollar vix trade is now a bust
and with that out of the way along with options expiry
id say we have the set up for a drop
Joe, this is precisely my concern with these head lines from zero hedge and other media outlets. I took a mental note at that time when the article was was first published. I thought at that time, it was no more than a scare tactic for new traders to excite out of their long positions and to go short.
This website is for educational purposes relating to Elliott Wave, natural cycles, and the Quantum Revolution (Great Awakening). I welcome questions or comments about any of these subjects. Due to a heavy schedule, I may not have the time to answer questions that relate to my area of expertise.
I reserve the right to remove any comment that is deemed negative, is unhelpful, or off-topic. Such comments may be removed.
Want to comment? You need to be logged in to comment. You can register here.